Covenant Journal of Informatics & Communication Technology. Vol. 8 No. 1, June, 2020
ISSN: print 2354 – 3566 electronics 2354 – 3507 DOI:
An Open Access Journal Available Online
A Hybrid Fuzzy Time Series Technique for
Forecasting Univariate Data
Alhassan Mohammed B., Muhammad Bashir Mu’azu, Yusuf Abubakar
Sha’aban, Shehu Mohammed Yusuf, Salawudeen Ahmed Tijani &
Suleiman Garba
2Department of Computer Engineering, Ahmadu Bello University, Zaria, Nigeria.
Corresponding Author: [email protected]
Received: 20.08.2019 Accepted: 29.11.2019 Date of Publication: June, 2020
Abstract: In this paper a hybrid forecasting technique that integrates Cat Swarm optimization Clustering (CSO-C) and Particle Swarm Optimization (PSO) with Fuzzy Time Series (FTS) forecasting is presented. In the three stages of FTS, CSO-C found application at the fuzzification module where its efficient capability in terms of data classification was utilized to neutrally divide the universe of discourse into unequal parts. Then, disambiguated fuzzy relationships were obtained using Fuzzy Set Group (FSG). In the final stage, PSO was adopted for optimization; by tuning weights assigned to fuzzy sets in a rule. This rule is a fuzzy logical relationship induced from FSG. The forecasting results showed that the proposed method outperformed other existing methods; using RMSE and MAPE as performance metrics.
Keywords: Forecasting, Fuzzy Time Series, Cat Swarm Optimization based Clustering, Particle Swarm Optimization.
1. Introduction
The estimation of what is likely to happen in the future especially in business and relative financial investment or practice is an unavoidable task (Singh, 2016). It is a key function that aids decision, planning and development in science, technology and engineering (Songh & Chissom, 1993).
As the application of information technology is growing very rapidly, the proper utilization of data becomes undoubtedly necessary. The most applicable form of data is mostly available in time series. Fuzzy Time Series (FTS) forecasting technique is capable of handling both numeric and linguistic time series data. In terms of
URL: http://journals.covenantuniversity.edu.ng/index.php/cjict development, forecasting plays a role
everywhere in our lives ranging from economy to technology and every aspects in between. Economically, accurate forecasting results can lead to improvement of a country’s Gross National Product and Gross Domestic Product, increase strength of currency and expand industries. Technically, forecasts predict new practical developments that could change the operations of an organization. For example, in computing; the introduction of transistors removed vacuum tubes from business.
In contrast with the traditional methods, Fuzzy time series forecasting is the application of linguistic mathematical reasoning to model and predict the future value of a variable from a time series historically presented or available in either numeric or imprecise form. It is a reliable method that deals with uncertainties in observations recorded over successive period. Not only that but also, assumptions and too much back ground knowledge of the variable under forecast is not required.
Song and Chissom were the first to introduce FTS in 1993. It comprise of three stages namely; fuzzification, determination of fuzzy relationships (fuzzy inference) and defuzzification. In the fuzzification stage crisp observations are converted into linguistic values by identifying variations in the crisp data. In this first stage, decision on interval length is highly significant for dividing the universe of discourse. In this work interval lengths were objectively obtained using Cat Swarm Optimization based Clustering (CSO-C), define memberships that best explains the
unknown structure of the observations; having taken these steps, defining universe of discourse becomes unnecessary, in fuzzy time series forecasting. Defuzzification is the final stage in fuzzy time series forecasting. This is the process of deriving future crisp forecasts from fuzzy forecasting rules. In a bid to remove recurrent fuzzy relationship; Fuzzy Set Group (FSG) was introduced. Finally, particle swarm optimization was proposed to assign weights to elements of forecasting rules and obtain defuzzified forecasts.
The rest of the paper is presented as follows: a brief discussion of Cat Swarm Optimization based Clustering (CSO-C) and Particle Swarm Optimization (PSO) were explained in section 2. Section 3 discusses Fuzzy Time Series (FTS). Section 4 discusses the results obtained from the application of the proposed forecasting model to two data sets. Finally, the conclusion was presented in Section 6.
2. Methods
Over decades, different methods have been used to improve FTS forecasting. The beauty in FTS forecasting is that regardless of the stage a researcher chooses to work upon, an appreciative reduction of error or increase in accuracy can be achieved in the FTS forecasting technique (Egrioglu et al, 2016). The complicated maximum minimum composition operation was replaced by a simplified arithmetic operation (Chen 1996), in order to achieve effective interval length, it is advisable to set the heuristic in a way that at least half the fluctuation in the time series will be reflected by the
Alhassan Mohammed B., et al. CJICT (2020) 8(1) 34-50
URL: http://journals.covenantuniversity.edu.ng/index.php/cjict chosen lengths of intervals (Huarng
2001), Differential Evaluation Algorithm (DEA) was utilized to avoid subjective judgments for determining the interval lengths while discrete weights assigned to fuzzy relation that occurred in the defuzzification process. Consequently, improved result was presented (Bas et al., 2013), temporal information was utilized to partition the universe of discourse into intervals with unequal lengths through Gath-Geva clustering (Wang et al., 2013), a hybrid FTS forecasting model with empirical mode decomposition to partition universe of discourse, three layer back propagation artificial neural network for the determination of fuzzy relation and particle swarm optimization to optimize the weights and threshold of bpANN (Huang and Wu, 2017), an adaptive FTS model for multivariate forecasting of Shanghai Stock Exchange; Cuckoo search was utilized to partition a training data set into unequal intervals. Then relationships were generated using Fuzzy Logic Relationship Group. The results showed an improvement in forecasting accuracy. However, computational complexities involved might make the model not work effectively for higher variable sets (FLRG) (Zhang et al., 2017).
2.1 Cat Swarm Optimization based Clustering (CSO-C)
This algorithm was used to code the fuzzification module of the hybrid FTS forecasting model, so as to objectively determine interval length among other steps in the first stage. Cat Swarm Optimization for Clustering was first
proposed by Santosa and Ningrum in 2009 (Bahrami et al., 2018). According to Bahrami et al., 2018; CSO-C is made up of two parts namely:
i) Clustering of data and
ii) Searching for the best cluster center.
The following are inputs for clustering CSO:
i) Population of data ii) Number of clusters iii)Number of copy
The phases of CSO-C are described as follows:
Phase 1: Define initial cluster center:
In this phase, k point is chosen arbitrarily from the collected data in order to form the initial cluster center.
Phase 2: To Group data into clusters:
Data is imputed into cluster with the closest cluster center. Distance between data and cluster data can be obtained by
(Bahrami et al., 2018): 2 1 ( , ) ( ) n i i i d x y x y x y
(1)Phase 3: To Calculating the Sum of
Squared-Error (SSE): The fitness
function of the algorithm can be obtained by: 2 1
(
)
k i i x DiSSE
x m
(2) Where:,
ix data member of cluster D
m
cluster center i
k number of cluster
Phase 4: Clustering optimization with
CSO: With regard to this algorithm, the
URL: http://journals.covenantuniversity.edu.ng/index.php/cjict
cat is represented by a cluster center, while the new cluster center will be the solution set and is expected to come up with a smaller SSE value than before. A few adjustments are necessary in order to gain efficiency in the application of CSO to CSO-C. The adjustments are:
i. In order to allow every cat pass through the seeking and tracing mode; it becomes necessary to remove the Mixture Ratio (MR). Consequently, the time needed to find the best cluster centre will be reduced.
ii. If the value of CDC were always assumed to be 100% in the seeking mode, it will allow a change for every dimension of cat copy.
Phase 4.1: Seeking mode: The function
of seeking mode is to enable the possession of the ability to search for best points around the cluster centres that have possibilities of attaining optimal fitness value. This is the reason that necessitated the need to define three parameters as outlined below:
i) Seeking Memory Pool (SMP): this will represent the number of copy a cluster have.
ii) Seeking Range of the Selected Dimension (SRD): this declares the mutative ratio, with a value between [0, 1].
iii)Self Position Considering (SPC): it is a Boolean random value (Amjad
et al., 2012).
The algorithm for seeking mode in CSO-C is given as follows (Santosa & Ningrum, 2009):
1. Evaluation of the parameter of seeking mode which include; SMP, SRD, SPC
2. For i = 1 to k (number of cluster center), do Copy cluster center (i) position as many as SMP.
Determine j value
Compute the shifting value (SRD*cluster center (i))
3. For m = 1 to SMP, do
Addition or subtraction of cluster centres with shifting value is performed randomly.
The output will be (SMP x k) cluster center candidates
4. Compute the distance, sub classify data into clusters, and compute SSE 5. Choose a candidate to be the new cluster centre roulette wheel selection
Phase 4.2: Updating SSE and cluster centre
The numerical quantity of SSE obtained from seeking mode is compared with the previous result of SSE. If the SSE numerical quantity obtained from seeking mode is less than the earlier SSE, then the result obtained from the seeking mode becomes the new cluster center. Conversely, if the numerical quantity obtained from seeking SSE is greater than or equal to the value of earlier SSE, we use the previous cluster centre.
Phase 4.3: Tracing Mode: The aim of
the tracing mode is to shift point of concentration to a better position for obtaining optimal fitness value.
The Tracing Mode algorithm for CSO Clustering is as follows (Bahrami et al., 2018):
1. For i = 1 to k, do Update velocity (i) Update position (i),
get the new cluster center (i)
Alhassan Mohammed B., et al. CJICT (2020) 8(1) 34-50
URL: http://journals.covenantuniversity.edu.ng/index.php/cjict
2. Calculate the distance, grouping data into clusters, and calculate SSE
Phase 4.4: Repeat step 4.2 for tracing
SSE and cluster centre: With regard
to SSE, the numerical quantity obtained from tracing mode is compared with the previous result of SSE. If the numerical
quantity happens to be less than the previous, it will be used or considered as the cluster center. Conversely, if the result of tracing SSE is greater than or equal to earlier SSE, the previous cluster centre is used.
Phase 5: Repeat phase 4 until it
reaches the stopping criteria.
Table 3.1: CSO-C Parameters and Specifications
Parameters Specifications SMP CDC SRD Const1 r1 Velmax Number of clusters Maximum number of iterations 5 100% 0.2 2 [0,1] 0.9 7 100
38
URL: http://journals.covenantuniversity.edu.ng/index.php/cjict
2.2. Particle Swarm Optimization
It was first introduced in 1995 by Kennedy and Eberhart (Kennedy and Eberhart 1995). PSO is a population-based evolutional algorithm that mimics the behaviour of birds flocking or fish grouping in search for the location of food (Eleruja et al., 2012). Particle Swarm Optimization (PSO) is in the class of evolutionary computation (EC) and it is related to genetic algorithm and evolutionary programming, (Kennedy & Eberhart, 1999). The only thing it needs is traditional mathematical operators and in terms of speed and memory requirement it is computationally
economical, (Amjad et al., 2012). Empirically, it has been proven to be effective with different kinds of problems not only in the forecasting domain.
Problem optimization in PSO is achieved by having a population of candidate solution, in this process dubbed particles are moved around within a search space in accordance with simple mathematical formula over the particles position. The particles are also guided towards the best known position in the search space and are updated as better positions are found by other particles (Amjad et al., 2012).
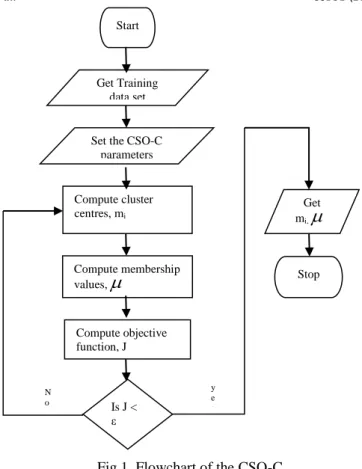
Figure Error! No text of specified style in document..1: Flow Chat for the Fuzzification
Fig 1. Flowchart of the CSO-C modification Module
Start
Get Training data set
Set the CSO-C parameters Compute cluster centres, mi Compute objective function, J Compute membership values,
Get mi,
Stop y e s N o Is J < ε39
Alhassan Mohammed B., et al. CJICT (2020) 8(1) 34-50
URL: http://journals.covenantuniversity.edu.ng/index.php/cjict
3. Fuzzy Time Series
The concept of fuzzy time series was first introduced by Song and Chissom (1993a).
The most important advantage of the fuzzy time series approach is to be able to work with a very small set of data.
Definition 1: Let
U
be the universe of discourse, whereU
{ ,
u u
1 2,...,
u
n}.
then a fuzzy set
A
i ofU
can be defined as(Bas et al., 2013):1 1 2 2
(u ) / u
(u ) / u
,...,
(u ) / u
i i i i A A A n nA
(3) Where i A
is the membership function of the fuzzy setA
i and;
[0,1]
i A
U
. In addition to(u ), j 1, 2,..., n
i A j
denote the generic elements of fuzzy set
;
(u )
i i A jA
is the degree of belongingness ofu
j to;
(u ) [0,1]
i i A jA
.Definition 2: Fuzzy Time Series; let
Y
(t) (t ..., 0,1, 2,...),
a subset of real numbers, be the universe of discourse by which fuzzy sets(t)(i 1, 2,3,...)
i
f
are defined. IfF(t)
is a collection off
i(t)(i 1, 2,3,...),
thenF(t)
is called a fuzzy time series defined onY(t)(t 1, 2, 3,...) (Yusuf et al., 2015).Definition 3: Fuzzy Logic Relation (FLR); if there exist a fuzzy logic relationshipR(t 1, ) t , such
thatF(t)F(t 1) R(t 1, t) , where represents an operator, then F(t)is
said to be caused by F(t 1) . The relationship between F(t)and F(t 1) is denoted by; F(t 1) F(t) (4) If F(t 1) A iand
F
(t) A
j then i jA
A
Definition 4: Fuzzy Logic Relationship Group (FLRG).
Relationships with the same fuzzy set on the left hand side can further be grouped into a relationship group. Relationship groups are also referred to as Fuzzy Logic Relationship Groups (FLRG).
Suppose that:
1, 2,... ,
i j i j i jn
AA AA AA then, they can be grouped into a relationship group as follows:
1
,
2,...,
i j j jn
A
A
A
A
(Yusuf et al.,2015).The simulation parameters used to achieve the results are quantified in given in Table 1.
4. Results and Discussions
The FTS forecasting modules were coded in MATLAB 2016a, on a laptop computer with Intel core (TM) i3-3250M micro processor, frequency speed rate (2.30 GHz) and Random-Access Memory (RAM) of 4.00 GB. The main objective of this study is to increase forecasting accuracy by using CSO-C in the fuzzification stage of FTS to objectively and unequally determine interval lengths. PSO was integrated into the defuzzification stage to optimize the process by tuning the “if-then” rules as discussed earlier.
URL: http://journals.covenantuniversity.edu.ng/index.php/cjict Table 4.1 below shows the shows the set
of values for the PSO parameters used
(Yusuf et al., 2015).
Table 4.1: The PSO parameters used
Parameters Specifications
Swarm Size
Maximum Number of Iterations Target Fitness Value as MSE
Min and Max Particles Position Limited to Min. and Max. Vel. Range
Learning Factors C1 and C2
Inertial Coefficient, w
Maximum number of iterations
5 500 1 [0,1] [-0.01,0.01] 2 1.4 100
In the course of application, so as to verify the performance of the proposed hybrid forecasting model, it was applied to two different time series data sets: yearly deaths in car road accidents in Belgium data set and enrollments at the University of Alabama data set. The obtained results were compared with the results obtained from other fuzzy time series models in the literature using Root Mean Squared Error (RMSE) and Mean Absolute Percentage Error (MAPE) as performance metrics which are mathematically represented as shown: 2 ^ 1 1 T t t t RMSE x x n
(5) ^ 1 1 100 t t n t t x x MAPE n x
(6)For each time series observations, the decided CSO-C parameters are as shown in table 3.1. The definitions of the PSO parameters are also shown in table 4.1.
4.1 Forecasting Car Road Accident in Belgium
In a bid to verify efficiency of the developed model, the first implementation was carried out on a time series data set of the observation in the occurrence of car road accident in Belgium. Table 4.2 shows the cluster centers and their linguistic values which were obtained in ascending order. The FSG and optimal weights assigned to the forecasting rule contents as observed in the enrollment sets is shown in table 4.4. In addition a tabular presentation was made to compare between enrollment forecasts for both proposed and previous techniques. In terms of; RMSE and MAPE.
Alhassan Mohammed B., et al. CJICT (2020) 8(1) 34-50
URL: http://journals.covenantuniversity.edu.ng/index.php/cjict
Table 4.2: Cluster Centers and Defined Fuzzy Sets for Yearly Deaths from Road Accidents in Belgium
Cluster Center Fuzzy Set
m1 1172.10 A4 m2 1380.00 A5 m3 1432.00 A6 m4 1478.10 A6 m5 1574.06 A6 m6 1616.00 A7 m7 1644.00 A6 4.2 Forecasting Enrollments at University of Alabama
The implementation of the developed model was also carried out on University of Alabama student enrollment time series standard data set. Table 4.3 comprises of the cluster centers and their linguistic values, they were obtained in ascending order. Table
4.5 shows the fuzzy set groups and optimal weights assigned to the forecasting rule contents as observed in the enrollment sets. A comparative presentation of enrollments forecasts and the RMSE and MAPE values for the proposed methods and some other methods are given.
Table 4.3: Cluster Centers and Defined Fuzzy Sets for Students Enrollment in University of Alabama.
Cluster Center Fuzzy Set
m1 13055.11 A1 m2 13565.35 A2 m3 15164.65 A2 m4 15862.01 A3 m5 16917.99 A3 m6 18149.95 A3 m7 19333.69 A4
Table 4.4: Fuzzy Set Groups and Optimal Weights for Accidents in Belgium.
Data points Maps Optimal weight(s)
1 #, #→ A4 #,# 2 #,A5→ A5 #,# 3 A5, A6→ A6 0.022442, 0.977558 4 A5, A6, A7→ A6 0.23847,0.0023311, 0.81188 5 A7, A7→ A6 0.98302, 0 6 A7, A7 , A6→A7 0.47619, 0.28692, 0.25285 7 A7, A6, A7→ A6 0.45287, 0.08873, 0.43831 8 A6, A7, A6→ A4 0.93558, 0, 0 9 A7, A6, A5→ A3 0.081525,0.041537, 0.89499 10 A6,A5, A5→ A3 0.47014, 0.19109, 0.25047 11 A5, A5, A4→ A2 0.34784, 0.14902, 0.44225
42
URL: http://journals.covenantuniversity.edu.ng/index.php/cjict 12 A5,A5, A4, A4→ A4 0.983841, 0, 0, 0.016159 13 A5,A5,A4, A4, A5 →A2 0.42501,0, 0.5797, 0,0 14 A4, A5, A4→ A3 0.21641, 0.7953, 0 15 A5, A4, A5→ A4 0, 0.076319, 0.96584 16 A4, A5, A5→ A5 0.46637, 0.40469, 0.25499 17 A5, A5 ,A6→ A4 0.54514, 0.24358, 0.21717 18 A5, A6, A5 → A2 0.69881, 0, 0.26337 19 A6,A5,A4→ A2 0 , 0 20 A6,A5, A4,A4→A3 0.32258,0.42598,0.13994,0.082344 21 A6,A5,A4,A4,A5→A1 0.0073059,0, 0.034287, 0.86937 22 A5, A3→ A1 0.15219, 0.73786 23 A3, A1→A1 0.72378, 0.23485 24 A1, A2→ A1 0.044945, 0.955055 25 A1, A2, A3→ A1 0.33401, 0.68015, 0 26 A3, A2→A1 0.99895, 0.025133 27 A3, A2, A3→ A2 0, 0.13372, 0.92348 28 A3, A4→A1 0.93486, 0 29 A4, A1→A1 0.34751, 0.50543 30 A1,A1→A1 0.023115, 0.82616
Figure 2: Graph of Forecasts of the Proposed Method and Actual Observations of Yearly Deaths from Accidents in Belgium
Alhassan Mohammed B., et al. CJICT (2020) 8(1) 34-50
URL: http://journals.covenantuniversity.edu.ng/index.php/cjict
Table 4.5: Generated Fuzzy Set Groups and Optimal Weights for Enrollments
Data Points Maps Optimal Weight(S) 1 #, #→ A1 #, # 2 #, A1 → A2 #, # 3 A1 , A1 → A2 0 , 0.955055 4 A1, A1, A1→A3 0.85229, 0, 0.20749 5 A1, A2→A3 0, 0.56155 6 A1, A2, A2→A3 0, 0.42887, 0.56148 7 A1, A2, A2, A2→A4 0.9149, 0, 0, 0.18862 8 A2 , A3→A4 0.9743, 0.0257 9 A3, A4→A5 0.052746, 0.947254 10 A3, A4, A6→A5 0, 0, 0.9743 11 A6, A6→A5 0.21978, 0.74883 12 A6, A5→A3 0.14587, 0.79113 13 A5, A2→A3 0, 0.18867 14 A5, A2, A2→A3 0, 0.37964, 0.59998 15 A5, A2, A2, A2→A3 0.80891, 0, 0 16 A2, A2, A2, A2→A4 0, 0.033894, 0 17 A2, A4→ A5 0.95174, 0.13425 18 A2, A4, A6→A6 0.090562,0.28332,0.72234 19 A6, A7→A7 0.090562,0.28332,0.72234 20 A6, A7, A7→A7 0.02116, 0, 0.97884 21 A6, A7, A7, A7→A7 1,0, 0.085242, 0.042223 22 A7, A7, A7, A7→A7 0, 0, 0.41191, 0.58313
44
URL: http://journals.covenantuniversity.edu.ng/index.php/cjict
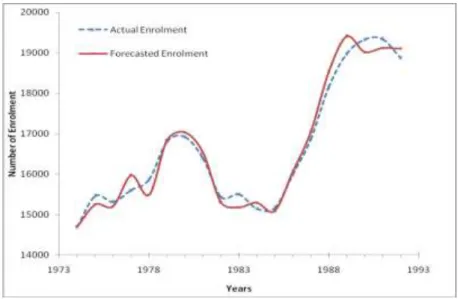
Figure 3: Graph of Forecasts of the Proposed Method and Actual Observations of Students Enrollment
Table 4.7: A Comparative Presentation of Yearly Deaths from Car Road Accidents Forecasts
Year Actual Egrioglu
et al 2010 Jilani et al 2007 Uslu et al 2014 Yusuf et al 2015 Proposed Model 1974 1574 1497 1975 1460 1497 1506 1976 1536 1497 1453 1542 1977 1597 1500 1497 1598 1597 1588 1978 1644 1500 1497 1584 1643 1650 1979 1572 1500 1497 1584 1573 1560 1980 1616 1500 1497 1506 1633 1607 1981 1564 1500 1497 1584 1566 1572 1982 1464 1500 1497 1506 1464 1463 1983 1479 1500 1497 1453 1479 1487 1984 1369 1500 1497 1375 1369 1371 1985 1308 1400 1396 1383 1308 1315 1986 1456 1300 1296 1454 1457 1447 1987 1390 1500 1497 1453 1389 1390 1988 1432 1400 1396 1383 1432 1434 1989 1488 1400 1396 1509 1489 1484 1990 1574 1500 1497 1598 1574 1580 1991 1471 1500 1497 1506 1470 1462
45
Alhassan Mohammed B., et al. CJICT (2020) 8(1) 34-50 URL: http://journals.covenantuniversity.edu.ng/index.php/cjict 1992 1380 1500 1497 1375 1380 1382 1993 1346 1400 1396 1383 1346 1338 1994 1415 1300 1296 1383 1414 1417 1995 1228 1400 1396 1231 1228 1229 1996 1122 1100 1095 1135 1065 1123 1997 1150 1200 1196 1180 1113 1148 1998 1224 1200 1196 1245 1223 1223 1999 1173 1200 1196 1135 1112 1177 2000 1253 1300 1296 1245 1212 1252 2001 1288 1300 1296 1284 1287 1288 2002 11445 1100 1095 1143 1146 1152 2003 1035 1000 995 970 1036 1041 2004 953 1000 995 970 954 945 RMSE 85.35 83.12 41.61 19.2 5.931 MAPE 5.25% 5.06% 2.29% 0.67% 0.34%
Table 4.8: Comparative Presentation of Enrollments Forecasts.
Year Actual Enroll- ment S&C 1993 Chen 1996 Huarng 2001 Huarng et al 2006 Uslu et al 2014 Yusuf et al 2015 Proposed Model 1971 13055 1972 13563 14000 14000 14000 14242 13650 1973 13867 14000 14000 14000 14242 13650 13873.3 13874 1974 14696 14000 14000 14000 14242 14836 14685 14701 1975 15460 15500 15500 15500 15474.3 15332 15465.6 15453 1976 15311 16000 16000 15500 15474.3 15447 15312.1 15307 1977 15603 16000 16000 16000 15474.3 15447 15600.7 15611 1978 15861 16000 16000 16000 15474.3 15447 15860 15860 1979 16807 16000 16000 16000 16146.5 16746 16813.5 16809 1980 16919 16813 16813 17500 16988.3 17075 16913.7 16921 1981 16388 16813 16813 16000 16988.3 16380 16389.9 16393 1982 15433 16789 16789 16000 16146.5 15457 15435.3 15430 1983 15497 16000 16000 16000 15474.3 15457 15508 15493 1984 15145 16000 16000 15500 15474.3 15457 15136.7 15150 1985 15163 16000 16000 16000 15474.3 15332 15174.3 15152 1986 15984 16000 16000 16000 15474.3 16027 15988.5 15985 1987 16859 16000 16000 16000 16146.5 16746 16860.9 16858
46
URL: http://journals.covenantuniversity.edu.ng/index.php/cjict 1988 18150 16813 16833 17500 16988.3 18211 18146.5 18162 1989 18970 19000 19000 19000 19144 19059 18979.3 18961 1990 19328 19000 19000 19000 19144 19059 19330.7 19340 1991 19337 19000 19000 19500 19144 19059 19348.4 19349 1992 18876 19000 19000 19144 19059 18887.4 18882 RMSE 650 638 476 478 178 7.02 6.669 MAPE 3.22% 3.11% 2.45% 2.20% 0.90% 0.04% 0.03%
5. Significance of Forecast Results
A smaller value for both performance metrics (RMSE and MAPE) in comparison to results obtained by previously used models is an indication of an improved forecasting. Meanwhile, forecast results obtained for car road accidents are (RMSE of 5.931 and MAPE of 0.34%). The results obtained for Alabama University student enrolment are (RMSE of 6.669 and MAPE of 0.03%).
The graphical representation of car road accidents is shown in Fig. 2. It compares actual value and forecasted value of proposed technique. A record of yearly deaths from car accident was presented. From visual inspection one can see the accuracy in pattern followed for forecasted values in relation to the actual values.
The graphical illustration in Fig. 3 shows forecasted results for student enrollment. The proposed technique followed actual pattern with few points of mismatch. An error as a result of method of collection of data, chosen parameters for tuning in the problem solving technique used and the like. On a lengthy note, the proposed technique followed trend of actual forecast.
Table 4.7 shows a comparative presentation between the proposed technique and previous techniques for car road accident. Similarly, table 4.8 compares the performance of the proposed model in relation to other previous techniques for student enrollment.
6. Conclusion
Researchers’ observation has revealed that, objective partitioning of universe of discourse and the use of optimization technique to improve both fuzzification and defuzzification stages of the FTS forecasting process brings about accuracy in obtained results. This study presented an improved hybrid FTS forecasting technique used to handle any form of univariate dataset. Cat Swarm Optimization based Clustering (CSO-C) algorithm was utilized to objectively partition the universe of discourse and learn membership in datasets, while Particle Swarm Optimization algorithm was utilized in assigning optimal weights to elements of a fuzzy rule at the defuzzification stage. The results obtained demonstrate that the proposed forecasting technique provides more accurate forecasts
In a future development of forecasting model, it is necessary to consider other soft computing techniques that will be
Alhassan Mohammed B., et al. CJICT (2020) 8(1) 34-50
URL: http://journals.covenantuniversity.edu.ng/index.php/cjict incorporated with FTS in order to form
hybrid FTS techniques capable of handling errors caused by recurrence number of fuzzy relations and make objective choice of interval lengths.
Acknowledgement
The authors wish to utilize this medium to acknowledge the inputs and support provided by the Computer and Control Engineering Research Group of Ahmadu Bello University, Zaria. Their intellectual and technical help brought about the success of this work.
References
Amjad, U., Jilani, T. A., & Yasmeen, F. (2012). A two phase algorithm for fuzzy time series forecasting using genetic algorithm and particle swarm optimization techniques. International Journal of Computer Applications, 55(16).
Anderson, D. R., Sweeney, D. J., Williams, T. A., Camm, J. D., & Cochran, J. J. (2015). An introduction to management science: quantitative approaches to decision making: Cengage learning.
Bahrami, M., Bozorg-Haddad, O., & Chu, X. (2018). Cat Swarm Optimization (CSO) Algorithm. In O. Bozorg-Haddad (Ed.), Advanced Optimization by Nature-Inspired Algorithms (pp. 9-18). Fargo, North Dakota: Springer Nature Singapore Pte Ltd.
Bas, E., Egrioglu, E., Aladag, C. H., & Yolcu, U. (2015). Fuzzy-time-series network used to forecast linear and nonlinear time series. Applied Intelligence, 43(2), 343-355.
Bas, E., Uslu, V. R., Yolcu, U., & Egrioglu, E. (2013). A Fuzzy Time Series Analysis Approach by Using Differential Evolution Algorithm Based on the Number
of Recurrences of Fuzzy Relations. American Journal of Intelligent Systems, 3(2), 75-82. Chen, M.-Y., & Chen, B.-T. (2015). A
hybrid fuzzy time series model based on granular computing for stock price forecasting. Information Sciences, 294, 227-241.
Chen, S.-M. (1996). Forecasting enrollments based on fuzzy time series. Fuzzy sets and systems, 81(3), 311-319.
Cheng, C.-H., Cheng, G.-W., & Wang, J.-W. (2008). Multi-attribute fuzzy time series method based on fuzzy clustering. Expert systems with applications, 34(2), 1235-1242. Chu, S.-C., & Tsai, P.-W. (2007).
Computational intelligence based on the behavior of cats. International Journal of Innovative Computing, Information and Control, 3(1), 163-173.
Eğrioglu, E., Aladag, C. H., Yolcu, U., & Dalar, A. Z. (2016). A Hybrid High Order Fuzzy Time Series Forecasting Approach Based on
PSO and ANNs Methods.
American Journal of Intelligent Systems, 6(1), 22-29.
Eleruja, S. e. A., Mu'azu, M. B., & Dajab, D. D. (2012). Application of trapezoidal fuzzification approach (TFA) and particle
URL: http://journals.covenantuniversity.edu.ng/index.php/cjict swarm optimization (PSO) in
fuzzy time series (FTS) forecasting. Paper presented at the Proceedings on the International Conference on Artificial Intelligence (ICAI).
Huang, D., & Wu, Z. (2017). Forecasting outpatient visits using empirical mode decomposition coupled with back-propagation artificial neural networks optimized by particle swarm optimization. PloS one, 12(2), e0172539.
Huarng, K. (2001). Effective lengths of intervals to improve forecasting in fuzzy time series. Fuzzy sets and systems, 123(3), 387-394.
Kennedy, J., & Eberhart, R. C. (1999). The particle swarm: social adaptation in information-processing systems. Paper presented at the New ideas in optimization.
Lu, W., Chen, X., Pedrycz, W., Liu, X., & Yang, J. (2015). Using interval information granules to improve forecasting in fuzzy time series. International Journal of Approximate Reasoning, 57, 1-18. Pei, A. (2015). Load forecasting based on fuzzy time series. Paper presented at the Proceedings of the 3rd international conference mater. mech. manuf. eng.(IC3ME 2015), Guangzhou, China.
Qiu, W., Zhang, P., & Wang, Y. (2015). Fuzzy Time Series Forecasting Model Based on Automatic Clustering Techniques and Generalized Fuzzy Logical Relationship. Mathematical Problems in Engineering, 2015.
doi:http://dx.doi.org/10.1155/2015 /962597
Santosa, B., & Ningrum, M. K. (2009). Cat Swarm Optimization for Clustering. International Conference of Soft Computing and Pattern Recognition, 23, 54-59. doi:10.1109/SoCPaR.2009.23 Sets, F., & Zadeh, L. (1965). Inform.
Control, 8, 338-353.
Singh, P. (2016). Fuzzy Time Series Modeling Approaches: A Review Applications of Soft Computing in Time Series Forecasting (pp. 11-39): Springer.
Song, Q., & Chissom, B. S. (1993). Forecasting enrollments with fuzzy time series—part I. Fuzzy sets and systems, 54(1), 1-9. Wang, L., Liu, X., & Pedrycz, W.
(2013). Effective intervals determined by information granules to improve forecasting in fuzzy time series. Expert Systems with Applications, 40(14), 5673-5679.
Wang, W., Pedrycz, W., & Liu, X. (2015). Time series long-term forecasting model based on information granules and fuzzy
clustering. Engineering
Applications of Artificial Intelligence, 41, 17-24.
Yusuf, S., Mohammad, A., & Hamisu, A. (2017). A novel two–factor high order fuzzy time series with applications to temperature and futures exchange forecasting. Nigerian Journal of Technology, 36(4), 1124-1134.
Yusuf, S., Mu'azu, M. B., & Akinsanmi, O. (2015). A Novel Hybrid Fuzzy Time Series Approach with
Alhassan Mohammed B., et al. CJICT (2020) 8(1) 34-50
URL: http://journals.covenantuniversity.edu.ng/index.php/cjict Applications to Enrollments and
Car Road Accidents. International Journal of Computer Applications, 129(2), 37-44.
Zhang, W., Zhang, S., Zhang, S., Yu, D., & Huang, N. (2017). A multi-factor and high-order stock forecast model based on Type-2 FTS using cuckoo search and self-adaptive harmony search. Neurocomputing, 240, 13-24.
Arora, S., & Singh, S. (2013). The firefly
optimization algorithm:
convergence analysis and parameter selection. International Journal of Computer Applications, 69(3).
Augerat, P., Belenguer, J. M., Benavent, E., Corberán, A., Naddef, D., & Rinaldi, G. (1998). Computational