International Journal of Finance and Managerial Accounting, Vol.4, No.16, Winter 2020
1
With Cooperation of Islamic Azad University – UAE BranchFinancial Reporting Fraud Detection: An Analysis of Data
Mining Algorithms
Mahmood Mohammadi
Ph.D. Candidate in Accounting, Department of Accounting, Damavand branch, Islamic Azad University, Damavand, Iran
Shoreh Yazdani
Assistant Professor of Accounting, Department of Accounting, Damavand branch, Islamic Azad University, Damavand, Iran (Corresponding Author)
Mohammadhamed Khanmohammadi
Assistant Professor of Accounting, Department of Accounting, Damavand branch, Islamic Azad University, Damavand, Iran
Keyhan Maham
Assistant Professor of Accounting, Department of Accounting, Qazvin branch, Islamic Azad University, Qazvin, Iran
ABSTRACT
In the last decade, high profile financial frauds committed by large companies in both developed and developing countries were discovered and reported. This study compares the performance of five popular statistical and machine learning models in detecting financial statement fraud. The research objects are companies which experienced both fraudulent and non-fraudulent financial statements between the years 2011 and 2016. The results show, that artificial neural network perform well relative to a Bayesian network, Discriminant Analysis, logistic regression and Support vector machine. The results also reveal some diversity in predictors used across the classification algorithms. Out of 19 predictors examined, only nine are consistently selected and used by different classification algorithms: Employee Productivity, Accounts Receivable to Sales, Debt -to-Equity, Inventory to Sales, Sales to Total Assets, Return On -to-Equity, Return on Sales, Liabilities to Interest Expenses, and Assets to Liabilities. These findings extend financial statement fraud research and can be used by practitioners and regulators to improve fraud risk models.
Keywords:
1. Introduction
In the last decade, high profile financial frauds committed by large companies in both developed and developing countries were discovered and reported. The frauds by harris scarfe in Australia, parmalat in Italy, Ahold in Netherland, Satyam in India and Vivendi in France further demonstrate that the damage from this problem is felt around the world. Corporate fraud has not been confined to the well-advertised cases of Enron, World com, Tyco, Lucent, etc. organizations lose an estimated 5 percent of annual revenues to fraud in general and 1.6 percent of annual revenues specifically to financial statement fraud (Association of Certified Examiners [ACFE] 2014).further, when resources are misallocated because of misleading financial data, fraud can harm the efficiency of capital, labor, and product markets. Financial reporting fraud also increase business risk. For example, audit of firms can face lawsuit, reputational costs, and loss of clients, and investors and banks are more likely to make suboptimal investment and loan decisions (perols et al, 2017).
both academic and auditing firms have been searching for ways to detect corporate fraud. Data analytic is an important emerging field in both academic research (e.g, Agrawal and Dhar 2014; Chen, Chiang, and Storey 2012) and in practice (e.g, Brown Chui, and Manyikia 2011; Lavalle, Lesser, Shokley, Hopkins, and Kruschwitz 2011). Phau et al(2012), summarized the status of fraud research into four primary areas: internal, insurance, credit card, and telecommunications. In most of internal fraud research, the object was to detect employee fraud or theft; financial reporting fraud involving senior management was not a major research focus. Most attempts to detect financial reporting fraud use financial ratios, applying various methodologies with various results. Phau et al. concluded that the use of unstructured data in fraud detection is essentially unexplored. Nagi et al. (2011), identified that research into corporate fraud (which includes financial statement fraud) was prevalent compared with other types of financial fraud. Despite this research, Antifraud legislation such at the 2002 Sarbanes-Oxley act in United States, changes to auditing standards and enforcements efforts, the risk of financial statement fraud remains substantial(Deloitte, 2009).
Managers commit financial statement fraud by manipulating specific accounts, e.g., they may improve
reported earnings by artificially increasing revenue or reducing expenses. Many financial statement fraud variables used in the literature are inherently related to a specific type of fraud. For example, abnormal revenue growth is a potential measure of revenue fraud, while an abnormally low amount of allowance for doubtful accounts is a potential measure of expense fraud. Although these variables may provide useful information about a specific type of fraud, they are less likely to detect multiple type of fraud. Additionally, by combining different fraud types into binary classification problem, the classification algorithms focus on finding patterns common to all types. Given heterogeneity among different fraud types, such patterns may be difficult to detect.
In the fraud context, data analytics can, for example, be used to create fraud prediction models that help (1) auditors improve client portfolio management and audit planning decisions, and (2) regulators and other oversight agencies identify firms for potential fraud investigation(securities and exchange Commission [SEC] 2015; Walter 2013). However, the usefulness of data analytics in fraud prediction is hindered by three challenges. First, fraud prediction is a “neddle in a haystack problem.” That is, the relative rarity of fraud firms compared to non-fraud control firms (Bell and Carcello 2000) makes fraud prediction difficult (perols 2011). Second, fraud prediction is complicated by the “curse of data dimensionality” (Bellman 1961). The rarity of fraud observations relative to large number of explanatory variables identified in the fraud literature (Whiting, Hensen, McDonald, Albercht, and W. Albercht 2012) can result in overfitted prediction models that perform poorly when predicting new observations. Third, prior research generally treats all frauds as homogeneous events. This can make fraud prediction more difficult because prediction models have to detect patterns that are common across different fraud types (e.g., revenue versus expense fraud).
along with a discussion of research contributions and limitations, and suggestions for future research.
2. Literature Review
Research on financial reporting fraud prediction contributes to understanding factors that can be used to predict fraud. Prior research includes testing fraud hypotheses grounded in the earnings management and corporate governance literatures (e.g., Beasley 1996; Dechow, Sloan, and Sweeney 1996; Summers and Sweeny 1998; Beneish 1999; Sharma 2004; Ericson Hanlon, and Maydew 2006; Lennox and Pittman 2010; Feng, Ge, Luo, and Shevlin 2011; Perols and Lougee 2011; Caskey and Hanlon 2013; Armstrong, Larcker, Ormazabal, and Taylor 2013; Markelevich and Ronser 2013). This research also evaluates the significance of a variety of other potential explanatory variables, such as red flags emphasized in auditing standards, discretionary accruals measures, and nonfinancial indicators(e.g., Loebbecke, Eining, and Wilingham 1989; Beneish 1997; Lee, Ingram, and Howard 1999; Apostolou, Hassell, and webber 2000; Kaminski, Wetzel, and Guan 2004; Ettredge, Sun, Lee, and Anandarajan 2008; Jones, Krishnan, and Melendrez 2008; Brazel, Jones, and Zimbelman 2009; Decho et al. 2011). We use independent variables from this research as input into our models.
According to the primary studies on frauds in financial reporting by Feroz, Pastena, and Park
)2000), fraudulent companies almost have distorted inventories and amounts receivable. Later, Beneish (1997) analyzed the differences between fraudulent and non-fraudulent companies and introduced amounts receivable and debt collection period as separate variables of two groups. Beneish (1999), developing his suggested model identified debt collection prediction, gross profit margin, asset growth index, sales growth index, and accruals (capital change in non-working capital plus dis-prediction) as potential fraud detection indexes.
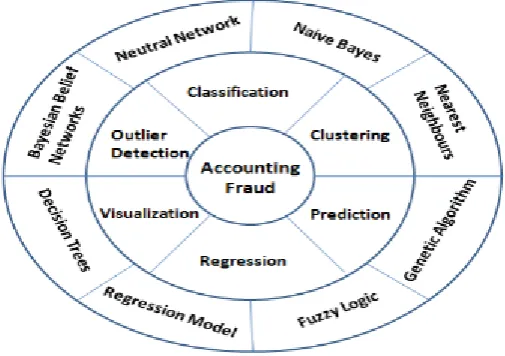
Fig 1. Consist of two layers, the first comprising the six data mining application classes of classification, clustering, prediction, outlier detection, regression, and visualization, supported by a set of algorithmic approaches to extract the relevant relationship in the data (Turban, 2007).
Feroz et al. (2000) compared the utility of an ANN model with Logistic regression based on Hit-rate, overall error rate, and Estimated Relative Costs of misclassification (ERC), while Lin et al. (2003) compared of fuzzy ANN to Logistic regression using the same performance measures. The results in Feroz et al. (2000) showed that Logistic regression performed better than ANN at relative error costs from1:1 to 1:40 and that the ANN performed better than Logistic regression at relative error costs of 1:50.
Kotsiantis et al (2006) used 41 fraud and 123 non-fraud firms in Greece to examine 11 classification algorithms: C4.5, RBF, K2, 3-NN, RIPPER, SMO, logistic regression, MP stacking, MLR stacking, Grading, and simple voting. The results, in terms of overall accuracy, showed that MP stacking provides the best performance, while logistic regression and ANN provide relatively poor performance.
Kirkos et al. (2007) used 38 fraud and 38 non-fraud firms to investigate the relative utility of an artificial neural network, a Bayesian belief network, and a decision tree learner. The reported class accuracies indicated that the Bayesian belief network outperforms the artificial neural network and decision tree.
Varian (2014) highlights the importance of the emerging field of data analytics. He suggests that researchers using traditional econometric methods should consider adapting recent advances from this field. A second stream of financial reporting fraud prediction research follows this suggestion and applies developments in data analytics research to improve fraud prediction. Early research within this stream concludes that Artificial Neural Networks (ANN) perform well relative to discriminant analysis and logistic regression (e.g., Fanning and Cogger 1998; Lin, Hwang, and Becker 2003). More recent research in this stream examines additional classification algorithms, such as Support Vector Machines(SVM), Decision trees, Genetic Algorithm(GA) and adaptive learning methods (e.g., Perols 2011; Gupta and Gill 2012; Whiting et al. 2012), and text mining methods (e.g., Glancy and Yadav 2011; Goel and Gangolly 2012; Larcker and Zakolyukina 2012). We implement all prediction models using Support Vector Machines (SVM). Support vector machines determine how to separate fraud firms from non-fraud firms by finding the hyperplane that provides the maximum separation in the training data between fraud and non-fraud firms. We also use artificial neural network and Bayesian network to examine the robustness of our results.
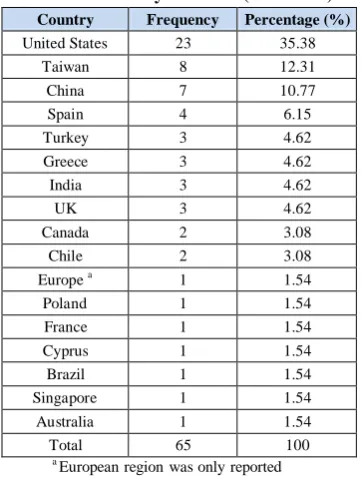
Most of articles had been conducted in the United States, followed by Taiwan, China and Spain (albashrawi, 2016) (Table 1).
Table 1: The number of articles for detecting financial fraud by countries (2004-2015)
Country Frequency Percentage (%)
United States 23 35.38 Taiwan 8 12.31 China 7 10.77 Spain 4 6.15 Turkey 3 4.62 Greece 3 4.62 India 3 4.62
UK 3 4.62
Canada 2 3.08 Chile 2 3.08 Europe a 1 1.54
Poland 1 1.54 France 1 1.54 Cyprus 1 1.54 Brazil 1 1.54 Singapore 1 1.54 Australia 1 1.54 Total 65 100
a European region was only reported
In Iran, various studies are conducted on fraud detection and some of them are as follows:
Maham and Torabi (2012) determined the risk of fraud in financial reporting using some of financial and non-financial indexes by logistic regression. The results indicated that the presented model is able to determine fraud in financial reporting at an acceptable confidence level.
Etemadi and Zolghi (2013) investigated the use of logistic regression in detecting fraudulent financial reporting in companies listed on Stock Exchange. In this study, using 9 financial ratios and information of 34 companies with fraud signs and 34 companies without fraud signs and also logistic regression, it was attempted to develop a suitable model with the accuracy level of 83.8%.
Mashayekhi and Hoseinpour (2016) investigated the relationship between real earning management and accrual-based earning management in companies suspected of fraud in TSE. These companies were selected according to a series of factors related to false accounting information in financial reporting. The results of this study indicated that in suspected companies, real earning management has a significant negative effect on accrual-based earning management. To summarize, extant research has offered insights into the relative performance of different classification algorithms. ANN performs well relative to logistic regression and other algorithms when dataset is balanced. More recent studies have examined the performance of additional classification algorithms under relatively balance conditions and have shown that meta-classifier have the best classification accuracy. Using the prior literature as a foundation, this study extends this literature by evaluating the performance of relatively representative set of classification algorithms.
3. Methodology
The next three subsections describe three factors that were manipulated in the experiments: Classification algorithms, Prior fraud probability, and relative error costs. The final three subsections describe the financial reporting fraud predictors, data sample and the Experimental Procedures.
3.1. Classification Algorithms
The overarching goal of this research was to examine the performance of different classification algorithms in financial reporting fraud detection. The primary experimental factor of interest was, therefore, classification algorithm. The classification algorithms were obtained from SPSS modeler 18 software, an open source data mining tool. Using an open source tool facilitates the replication and extension of this study. SPSS modeler implements a relatively complete set of classification algorithms, including many of the most popular. Based on the related research (i.e., prior financial statement fraud research and prior data mining research in domains balanced dataset mentioned earlier), five algorithms were selected from SPSS modeler: (1) Bayesian Network, (2) Discriminant Analysis, (3) Logistic Regression, (4)
Artificial neural networks, and (5) Support Vector Machine.
Bayesian Network, Discriminant Analysis and Logistic Regression were included, as they had performed well in prior fraud research (Green and Choi 1997; Fanning and Cogger 1998; Froz et Al. 2000; Lin, Hwang, and Becker 2003; Kotsiantis et al. 2006). However, it was not clear if these classification algorithms would perform well under realistic conditions and relative to not-yet-examined classification algorithms. Artificial neural networks and Support Vector Machine were included because prior data mining research (Fries et al. 1998; Phoa et al. 2004; West et al. 2005) found that these classification algorithms performed well in domains with balance data. However, not known how these classification algorithms would perform in fraud detection.
3.2. Prior Fraud probability
The prior probability of fraud impacts both classifier training and evaluation. Two classifiers that are based on the same classification algorithm can produce different results if they are trained on data with different prior probabilities. To determine appropriate training prior fraud probabilities, classification algorithm performance was examined after under sampling the majority class at different ratios of fraud to non-fraud cases.
Furthermore, for results to generalize to the population of interest, the evaluation prior fraud probability should reflect the prior probability of fraud in the population (the naturally occurring prior fraud probability). Bell and Carcello(2000) estimate that only around 0.6 percent of all firm years are fraudulent. However, this estimate is likely to change over time and be different for different populations of interest. Following prior fraud research (Feroz et al. 2000; Lin et al. 2003), the evaluation prior fraud probability was, therefore, manipulated in the calculation of the dependent variable and not by under sampling the evaluation data.
When the prior fraud probability was manipulated for evaluation purposes, the manipulation only impacted the calculation of the dependent variable and did not change the data.
3.3. Classification cost
Given a binary problem like fraud, there are four potential classification outcomes: (1) true positive, a fraud firm is correctly classified as a fraud firm; (2) false negative, a fraud firm is incorrectly classified as non-fraud firm; (3) true negative, a non-fraud firm is correctly classified as a non-fraud firm; and (4) false positive, a non-fraud firm is incorrectly classified as a fraud firm. False negative and false positive classifications are associated with different misclassification costs. Similar to prior fraud probability, the ratios of these costs impact both training and evaluation of classifiers. The classifiers, therefore, have to be both trained using appropriate cost ratio assumptions. When determining appropriate training cost ratios, classification algorithm performance was examined after under sampling the majority class instead of manipulating the cost ratio, which was not possible as the examined classification algorithms are not cost-sensitive. As stated earlier, under sampling the majority class is a common, simple, and effective approach to deal with cost and class imbalances (Drummond and Holte, 2003).
When evaluating the classification algorithms using specific assumptions about relative error costs, the results might not hold for other relative error cost levels. Therefore, the relative error costs used in the evaluation should reflect the relative error costs in the population. These costs are, However difficult to estimate. Researchers typically examine the classification performance over a wide range of evaluation relative error costs (Feroz et al. 2000; Lin et al. 2003), which reduces the risk of cost misspecification and provides richer information to other researchers and practitioners.
To summarize, the relative error cost was manipulated both when training classifier for classifier tuning purposes and when evaluating the performance of the classification algorithms. When the relative error cost was manipulated for training purposes, the prior fraud probability, instead of the relative error cost, was changed in the training sample by under sampling the data. When the relative error cost was manipulated for evaluation purposes, the manipulation
only impacted the calculation of the dependent variable and did not change the underlying data.
3.4. Financial reporting fraud predictors
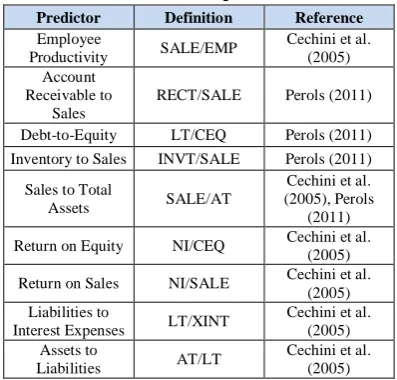
Financial reporting fraud predictor research has evaluated a large number of potential financial fraud predictors. The experiment included predictors that were found to be significant in prior research and that were available from electronic sources. Other variable were included, since they were less likely to be used in practice due to difficulty in obtaining them. We examine 17 financial ratios for this research. The results of the Kolmogorov-Smirnov test have reported that the nine financial ratios come from a normally-distributed population. Therefore, these ratios are explored with the t-test. See table 2 for the final selection of the 9 predictors included in the experiment and how these predictors are calculated.TABLE 2. Fraud predictorsa
Predictor Definition Reference
Employee
Productivity SALE/EMP
Cechini et al. (2005) Account
Receivable to Sales
RECT/SALE Perols (2011)
Debt-to-Equity LT/CEQ Perols (2011) Inventory to Sales INVT/SALE Perols (2011)
Sales to Total
Assets SALE/AT
Cechini et al. (2005), Perols
(2011) Return on Equity NI/CEQ Cechini et al.
(2005) Return on Sales NI/SALE Cechini et al.
(2005) Liabilities to
Interest Expenses LT/XINT
Cechini et al. (2005) Assets to
Liabilities AT/LT
Cechini et al. (2005)
a
All predictors found to be significant determinants of financial reporting fraud in prior research and that were relatively easy to obtain were included in the experiment.
3.5. Sample data
following the applicable criteria specified above for fraud firms) are added to the fraud firm dataset to create sample with 0.5 percent fraud firms. We include explanatory variables (summarized in Table 2) that have been used in recent literature to predict fraud or material misstatements (Beneish (1997); Decho et al. (1996); Lee et al. (1999); Kotsiantis et al. (2006); Cecchini et al. 2010; Dechow et al. 2011; Perols et al. 2017).
3.6. Experimental Procedures
To evaluate the classification algorithms, the classifiers were trained using the training data and evaluated using the evaluation data. For evaluated the classification algorithms, the classifiers were trained using the training data and evaluated using the evaluation data.
After the training and evaluation completed, the results from the five test algorithms for each seed were combined and optimal thresholds were determined and used to calculate scores for each classifier, evaluation relative error costs and evaluation prior fraud probability combination. Note that for each treatment level, the best, as determined during preprocessing, classifier tuning configuration, attribute transformation, and training prior fraud probability was used. This evaluation procedure generated a final result set per classification algorithm type, evaluation relative error costs, and evaluation prior fraud probability treatment group.
By using the entire data sample in the preprocessing steps, and then using the same data and the results from the preprocessing steps to evaluate the classification algorithms, the classification algorithms are compared under near optimal performance for each classification algorithm given the examined attributes, training prior fraud probabilities; attribute transformation methods, and classifier configurations. Furthermore, during preprocessing and evaluation, the same dataset is never used at the same time to both train and evaluate the classifier. This should improve the generalizability of the results, with the assumption that it is possible to select the best attributes, training prior fraud probability, attribute transformation method, and classifier tuning configuration for each classification algorithm.
4. Results
Financial statement fraud is a costly problem that has far-reaching negative consequences. Hence, the accounting literature investigates a wide range of explanatory variables and various classification algorithms that contribute to more accurate prediction of fraud and material misstatements. However, the rarity of fraud data, the relative abundance of variables identified In prior literature, and the broad definition of fraud creates challenges in specifying effective prediction models.
As shown in Table 3, the fraudulent financial statement detection accuracy and overall accuracy of the Artificial Neural Network model were the highest at 69.8 and 80.2 %, respectively. This study also discloses classification cost of each model’s contains Type I and Type II errors, as shown in Table 4.
Table 3: Detection accuracy of classification models
Model FFS (%) Non-FFS (%) accuracy (%)Overall
Bayesian
Network 69.7 63 65.8 Discriminant
Analysis 67 58 62 Logistic
Regression 69.1 66.1 67.9 Artificial
neural network 69.8 80.2 75 Support Vector
Machine 67.5 66.7 67
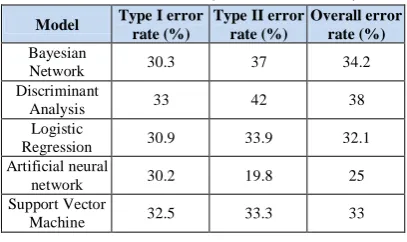
Table 4: Type I error and Type II error of classification models (Classification cost)
Model Type I error rate (%)
Type II error rate (%)
Overall error rate (%)
Bayesian
Network 30.3 37 34.2 Discriminant
Analysis 33 42 38 Logistic
Regression 30.9 33.9 32.1 Artificial neural
network 30.2 19.8 25 Support Vector
Type I errors indicate fraudulent financial statements that have been mistakenly labeled as not being fraudulent. Type II errors indicate fraudulent financial statements which have been classified as fraudulent financial statements. Logically, a Type I error is a major mistake. Therefore, in addition to comparison with the accuracy of the testing group, the model’s Type I error rate is also considered. The Artificial neural network model has the lowest Type I error rate at 30.2 % and an overall error rate of 25 %.
A limitation of this study is that the entire data sample was used in both preprocessing and classification algorithm evaluation. The entire sample was used in both steps to ensure that enough data were available to determine what training prior fraud probabilities and training classification error costs should be used for training classifiers, and what predictors are useful to these algorithms. Furthermore, by using the entire sample in both steps, the classification algorithms could be compared under near optimal performance for each classification algorithm given the examined attributes, training prior fraud probabilities, attribute transformation methods, and classifier configurations. This is, nevertheless, a limitation that makes it more difficult to assess the generalizability of the relative classifier performance results to situations where it is not possible to select the best attributes, training prior fraud probability, attribute transformation method, and classifier tuning configuration for each classifier. To address this limitation, an additional experiment was performed whereby the original dataset was randomly split in two. The first subset was used for preprocessing and the second subset was used for classification algorithm comparison, in which ANN and logistic regression were compared. The results in this additional experiment corroborate the result in the main experiment and, thus, provide empirical support for the generalizability of the results in the main experiment.
The preprocessing and classification algorithm results can be used by practitioners as guidance for selecting training prior fraud probabilities, attribute transformation methods, attributes, and classification algorithms when building fraud detection models. Improvement in fraud detection models can be useful to auditors during client selection, audit planning, and analytical procedures. Furthermore, the SEC can leverage the findings to target companies that are more likely to have committed financial statement fraud.
Another implication of the results, specifically the attribute selection results, is that researchers developing new fraud predictors need to examine the utility of the fraud predictors using more than one classification algorithm. In addition to using logistic regression, other classification algorithms like SVM and bagging should be used when examining the utility of fraud predictors.
A natural extension of this research is to examine additional classification algorithms. While classification algorithms were selected based on findings in prior research, it is possible that other classification algorithms will performance well in financial statement fraud detection. Future research can also leverage data mining research that focuses on the class imbalance problem, which has proposed a number of sampling techniques, such as SMOTE, to improve classification performance (Chawla et al. 2002). The utility of these techniques in detecting fraud needs to be evaluated. Future research can also follow Cecchini et al. (2010) and develop artifacts that are designed specifically for the fraud domain. Such artifacts could, for example, be designed to address the distinguishing characteristics of the fraud domain.
5. Discussion and Conclusions
Fraud prediction in financial reporting is one of the important discussions in financial and audit fields, because with a correct understanding and prediction of fraud likelihood and employment of necessary measures, the heavy costs can be prevented. The main objective of the present study is to present a model to detect fraud in financial reporting of Iranian companies using classification algorithms. Therefore, the present study, in terms of approach, is a developmental applied, because it designs a model to detect fraud in financial reporting and uses this model to detect fraudulent and non-fraudulent companies.
software, it was observed that Artificial Neural Network as well as Logistic Regression, Support Vector Machine, Bayesian Network and Discriminant Analysis.
Evidence and findings of this research can provide useful information to investors, practitioners, regulators, auditors and other stockholders. Regulators such as the TSE are investing resources to develop better fraud risk models. Our findings may enhance their ability to identify firms that have committed fraud. The negative effects of financial reporting fraud on stockholders, such as employees, auditors, suppliers, customers, and lenders, can also be potentially reduced. For example, auditors can use our model to potentially improve fraud risk assessment models that, in turn, can improve audit client portfolio management and audit planning decisions. Given the significant costs and widespread affects financial reporting fraud, improvements in fraud detection models can have a substantial positive impact on society.
According to the findings of the study, the suggestions are as follows:
1) Investors are recommended to use this model to assess Iranian companies and decide on their stock trading.
2) Creditors, banks, and other financing institutions are recommended to use this model to assess risks as one of the risk assessment indexes to grant facilities. 3) The Stock Exchange should use this model
to list companies and assess them and provide the capital market activists with the results.
4) The audits are recommended to use the presented model before accepting the work and commenting on the company’s financial statements.
5) Universities and research institutes and researchers, according to the findings of this study that has focused on fraud detection in financial reporting, can rely on the presented model in future studies and development of scientific theories.
References
1) Abbasi, A., C. Albrecht, A. Vance, and J. Hansen. )2012(. MetaFraud: A meta-learning framework for detecting financial fraud. MIS Quarterly 36 (4): 1293–1327.
2) Agarwal, R., and V. Dhar. )2014(. Editorial—Big Data, data science, and analytics: The opportunity and challenge for IS research. Information Systems Research, 25 (3): 443–448.
3) Apostolou, B., J. Hassell, and S. Webber. )2000(. Forensic expert classification of management fraud risk factors. Journal of Forensic Accounting, 1 (2): 181–192.
4) Armstrong, C. S., D. F. Larcker, G. Ormazabal, and D. J. Taylor. )2013(. The relation between equity incentives and misreporting: The role of risk-taking incentives, Journal of Financial Economics 109 (2): 327–350.
5) Association of Certified Fraud Examiners (ACFE). )2014(. Report to the Nation on Occupational Fraud and Abuse. Austin, TX: ACFE.
6) Athey, S., and G. Imbens. )2015(. A measure of robustness to misspecification. American Economic Review, 105 (5): 476–480.
7) Bayley, L., and S. Taylor. )2007(. Identifying earnings management: A financial statement analysis (red flag) approach. In Proceedings of the American Accounting Association Annual Meeting. Sarasota, FL: AAA.
8) Beasley, M. )1996(. An empirical analysis of the relation between the board of director composition and financial statement fraud. The Accounting Review, 71 (4): 443–465.
9) Bell, T., and J. Carcello. )2000(. A decision aid for assessing the likelihood of fraudulent financial reporting. Auditing: A Journal of Practice & Theory 19 (1): 169–184.
10)Bellman, R. )1961(. Adaptive Control Processes: A Guided Tour. Princeton, NJ: Princeton University Press.
11)Beneish, M. )1997(. Detecting GAAP violation: Implications for assessing earnings management among firms with extreme financial performance, Journal of Accounting and Public Policy 16 (3): 271–309.
13)Brazel, J. F., K. L. Jones, and M. F. Zimbelman. )2009(. Using nonfinancial measures to assess fraud risk, Journal of Accounting Research 47 (5): 1135–1166.
14)Brown, B., M. Chui, and J. Manyika. )2011(. Are you ready for the era of ‘‘Big Data’’? McKinsey Quarterly, 4: 24–35.
15)Caskey, J., and M. Hanlon. )2013(. Dividend policy at firms accused of accounting fraud. Contemporary Accounting Research, 30 (2): 818– 850.
16)Cecchini, M., G. Koehler, H. Aytug, and P. Pathak. )2010(. Detecting management fraud in public companies. Management Science, 56 (7): 1146–1160.
17)Chan, P., and S. Stolfo. )1998(. Toward scalable learning with non-uniform class and cost distributions: A case study in credit card fraud detection. In Proceedings of the Fourth International Conference on Knowledge Discovery and Data Mining. New York, NY.Available at: http://www.aaai.org/Papers/KDD/1998/KDD98-026.pdf
18)Chawla, N. V., K. W. Bowyer, L. O. Hall, and W. P. Kegelmeyer. )2002(. SMOTE: Synthetic minority oversampling technique. Journal of Artificial Intelligence Research, 16: 321–357. 19)Chen, H., R. H. Chiang, and V. C. Storey. )2012(.
Business intelligence and analytics: From Big Data to big impact. MIS Quarterly, 36 (4): 1165–1188. 20)Dechow, P. M., R. G. Sloan, and A. P. Sweeney.
)1996(. Causes and consequences of earnings manipulation: An analysis of firms subject to enforcement actions by the SEC. Contemporary Accounting Research, 13 (1): 1–36.
21)Dechow, P. M., W. Ge, C. R. Larson, and R. G. Sloan. )2011(. Predicting material accounting misstatements. Contemporary Accounting Research, 28 (1): 17–82.
22)Duin, P. W. R., and M. J. D. Tax. )2000(. Experiments with classifier combining rules. In Proceedings of the International Workshop on Multiple Classifier Systems. Available at: https://www.researchgate.net/publication/2210939 06_Experiments_with_Classifier_Combining_Rul es
23)Erickson, M., M. Hanlon, and E. L. Maydew. )2006(. Is there a link between executive equity
incentives and accounting fraud?, Journal of Accounting Research 44 (1): 113–143.
24)Etemadi, H, Zolqhy, H. )2013(. Using Logistic Regression to Identify Fraudulent Financial Reporting, Journal of Audit Science, 13(51), 163-145.
25)Ettredge, M. L., L. Sun, P. Lee, and A. A. Anandarajan. )2008(. Is earnings fraud associated with high deferred tax and/or book minus tax levels?, Auditing: A Journal of Practice & Theory 27 (1): 1–33.
26)Fanning, K., and K. Cogger. )1998(. Neural network detection of management fraud using published financial data, International Journal of Intelligent Systems in Accounting, Finance and Management 7 (1): 21–41.
27)Feng, M., W. Ge, S. Luo, and T. Shevlin. )2011(. Why do CFOs become involved in material accounting manipulations?, Journal of Accounting and Economics 51 (1): 21–36.
28)Feroz, E., T. Kwon, V. Pastena, and K. Park. )2000(. The efficacy of red-flags in predicting the SEC’s targets: An artificial neural networks approach, International Journal of Intelligent Systems in Accounting, Finance and Management 9 (3): 145–157.
29)Galar, M., A. Ferna´ndez, E. Barrenechea, H. Bustince, and F. Herrera. )2012(. A review on ensembles for the class imbalance problem: Bagging-, boosting-, and hybrid-based approaches, IEEE Transactions on Systems, Man, and Cybernetics, Part C: Applications and Reviews 42 (4): 463–484.
30)Glancy, F. H., and S. B. Yadav. )2011(. A computational model for financial reporting fraud detection, Decision Support Systems 50 (3): 595– 601.
31)Goel, S., and J. Gangolly.) 2012(. Beyond the numbers: Mining the annual reports for hidden cues indicative of financial statement fraud, Intelligent Systems in Accounting, Finance and Management 19 (2): 75–89.
32)Green, B. P., and J. H. Choi. )1997(. Assessing the risk of management fraud through neural network technology, Auditing: A Journal of Practice & Theory 16 (1): 14–28.
descriptive data mining techniques, International Journal of Computer Applications 58 (1): 22–28. 34)Humpherys, S. L., K. C. Moffitt, M. B. Burns, J.
K. Burgoon, and W. F. Felix. )2011(. Identification of fraudulent financial statements using linguistic credibility analysis. Decision Support Systems, 50 (3): 585–594.
35)Jahanshad, A., and Sardarizadeh, s. )2014(. Relation between difference of financial measure (Revenue growth) and nonfinancial measure (Employee growth) with fraudulent financial reporting, Journal of Accounting Research, 4 (13): 181-198.
36)Jones, K. L., G. V. Krishnan, and K. D. Melendrez. )2008(. Do models of discretionary accruals detect actual cases of fraudulent and restated earnings? An empirical analysis, Contemporary Accounting Research 25 (2): 499– 531.
37)Kaminski, K., S. Wetzel, and L. Guan. )2004(. Can financial ratios detect fraudulent financial reporting?, Managerial Auditing Journal 19 (1): 15–28.
38)Kittler, J., M. Hatef, R. P. W. Duin, and J. Matas. )1998(. On combining classifiers, IEEE Transactions on Pattern Analysis and Machine Intelligence 20 (3): 226–239.
39)Kotsiantis, S., E. Koumanakos, D. Tzelepis, and V. Tampakas. )2006(. Forecasting fraudulent financial statements using data mining, International Journal of Computational Intelligence 3 (2): 104–110. 40)Larcker, D. F., and A. A. Zakolyukina. )2012(.
Detecting deceptive discussions in conference calls, Journal of Accounting Research 50 (2): 495– 540.
41)LaValle, S., E. Lesser, R. Shockley, M. S. Hopkins, and N. Kruschwitz. )2011(. Big Data, analytics and the path from insights to value, MIT Sloan Management Review 52 (2): 21–32. 42)Lee, T. A., R. W. Ingram, and T. P. Howard.
)1999(. The difference between earnings and operating cash flow as an indicator of financial reporting fraud, Contemporary Accounting Research 16 (4): 749–786.
43)Lennox, C., and J. A. Pittman. )2010(. Big five audits and accounting fraud, Contemporary Accounting Research 27 (1): 209–247.
44)Lin, J., M. Hwang, and J. Becker. )2003(. A fuzzy neural network for assessing the risk of fraudulent
financial reporting, Managerial Auditing Journal 18 (8): 657–665.
45)Loebbecke, J. K., M. M. Eining, and J. J. Willingham. )1989(. Auditors’ experience with material irregularities: Frequency, nature, and detectability, Auditing: A Journal of Practice & Theory 9 (1): 1–28.
46)Maham, K., Torabi, A. )2012(. Providing Financial Reporting Fraud Risk Rating Model. National Conference on Economic Jihad (With Emphasis On National Production, Supporting Iranian Labor and Capital), University of Mazandaran.
47)Maloof, M. )2003(. Learning when data sets are imbalanced and when costs are unequal and unknown. In Proceedings of the 20th International Conference on Machine Learning. Washington,
DC. Available at:
http://www.site.uottawa.ca/;nat/Workshop2003/ma loof-icml03-wids.pdf
48)Markelevich, A., and R. L. Rosner. )2013(. Auditor fees and fraud firms. Contemporary Accounting Research, 30 (4): 1590–1625. 49)Mashayekhi, B, and Hosseinpour , A, H,. )2016(.
The relationship between real earnings management and accrual earnings management in companies suspected of fraud listed in tehran stock exchange. Empirical Studies in Financial Accounting Quarterly, 12(49): 29-52.
50)Nguyen, H. M., E. W. Cooper, and K. Kamei. )2012(. A comparative study on sampling techniques for handling class imbalance in streaming data. In Proceedings of the Soft Computing and Intelligent Systems (SCIS) and 13th International Symposium on Advanced Intelligent Systems (ISIS), 1762–1767. Available at:
https://www.researchgate.net/publication/2613015 01_A_
comparative_study_on_sampling_techniques_for_ handling_class_imbalance_in_streaming_data 51)Perols, J. L. )2011(. Financial statement fraud
detection: An analysis of statistical and machine learning algorithms, Auditing: A Journal of Practice & Theory 30 (2): 19–50.
53)Phua, C., D. Alahakoon, and V. Lee. )2004(. Minority report in fraud detection: Classification of skewed data, SIGKDD Explorations, 6 (1):50– 59.
54)Price, R. A. III, N. Y. Sharp, and D. A. Wood. )2011(. Detecting and predicting accounting irregularities: A comparison of commercial and academic risk measures. Accounting Horizons, 25 (4): 755–780.
55)Provost, F. J., T. Fawcett, and R. Kohavi. )1998(. The case against accuracy estimation for comparing induction algorithms. In Proceedings of the Fifteenth International Conference on Machine Learning, Madison, WI, 445–453.
56)Securities and Exchange Commission (SEC). )2015(. Examination Priorities for 2015. Available at:
http://www.sec.gov/about/offices/ocie/
national-examination-program-priorities-2015.pdf 57)Sharma, V. )2004(. Board of director
characteristics, institutional ownership, and fraud: Evidence from Australia, Auditing: A Journal of Practice & Theory 23 (2): 105–117.
58)Shin, K. S., T. Lee, and H. J. Kim. )2005(. An application of support vector machines in bankruptcy prediction models, Expert Systems with Application 28: 127–135.
59)Summers, S. L., and J. T. Sweeney. )1998(. Fraudulently misstated financial statements and insider trading: An empirical analysis, The Accounting Review 73 (1): 131–146.
60)Varian, H. R. )2014(. Big Data: New tricks for econometrics, Journal of Economic Perspectives, 28 (2): 3–27.
61)Walter, E. )2013(. Harnessing tomorrow’s technology for today’s investors and markets. Speech Presented at American University School of Law, Washington, DC. Available at: https://www.sec.gov/News/Speech/Detail/Speech/ 1365171492300
62)Weiss, G. )2004(. Mining with rarity: A unifying framework, ACM SIGKDD Explorations Newsletter, 6 (1): 7–19.
63)Whiting, D. G., J. V. Hansen, J. B. McDonald, C. Albrecht, and W. S. Albrecht. )2012(. Machine learning methods for detecting patterns of management fraud, Computational Intelligence, 28 (4): 505–527.
64)Witten, I. H., and E. Frank. )2005(. Data Mining: Practical Machine Learning Tools and Techniques. Second Edition. San Francisco, CA: Morgan Kaufmann Publishers.