Copyright © 2013 CTTS.IN, All right reserved
Simulation Based R-peak and QRS complex detection in ECG
Signal
Name: Bishweshwar Pratap Tasa
Designation: Student, Organization: College: DBCET, Azara, Guwahati, Email ID: [email protected]
Name:Pompy Das
Designation: Student, Organization: College: DBCET, Azara, Guwahati, Email ID: [email protected]
Name:Avinash Sinha
Designation: Student, Organization: College: DBCET, Azara, Guwahati, Email ID: [email protected]
Name:Tulika Chenglari
Designation: Student, Organization: College: DBCET, Azara, Guwahati, Email ID: [email protected]
Name:Hemashree Bordoloi
Designation: Assistant Professor, Department of ECE, Organization: College: DBCET, Azara, Guwahati, Email ID: [email protected]
Abstract — ECG is the graphical recording of the electrical activity of the heart used for clinical diagnosis. The project has been devised to find a method for ECG signal analysis which is simple and has good accuracy and takes less computation time. The initial task for efficient analysis is the removal of noise. It involves the extraction of the required cardiac components by rejecting the background noise. The ECG signal is very sensitive in nature, and even if small noise is mixed with original signal, the various characteristics of the signal changes. The signal voltage level is as low as 0.5 to 5mV and the frequency components fall in the range of 0.05 to 100Hz. As far as the noise is concerned the muscle movements, main current and ambient electromagnetic interference generate it.
Hence filtering remains an important issue, as data corrupted with noise must either be filtered or discarded. The characteristics of the components of the ECG signal P, Q, R, S and T determine the clinical status of the activity of the heart. Detection of R wave in heart signal is easier than other portions of ECG signal due to its structural form and high amplitude. This paper discusses R-peak and QRS complex detection in ECG signal processing.
Keyword —ECG, notch filter, R-peak detection, QRS complex detection
1. INTRODUCTION
Electrocardiogram (“ECG”) consists of graphical recording of electrical activity of the heart over time. It is the most recognized biological signal, and with non-invasive method; it is commonly used for diagnosis of some diseases by inferring the signal. Cardiovascular diseases and abnormalities alter the ECG wave shape. Each portion of the ECG waveform carries information
that is relevant to the clinician in arriving at a proper diagnosis. The electrocardiograph signal taken from a patient generally gets corrupted by external noises; hence it necessitates the need of a proper noise free ECG signal. A signal acquisition system consist of several stages, including signal acquisition through hardware and software instrumentation, noise or other characteristics; filtering and processing for the extraction of information. A simple ECG waveform is shown in Fig 1. It is a combination of P, T, U wave, and a QRS complex. The complete waveform is called an electrocardiogram with labels P, Q, R, S and T indicating itsdistinctive features.
Fig. 1.Schematic representation of the ECG signal
2. BASICS OF ECG
depends mainly on the detection of the QRS complex and T and P waves. The P-wave represents the activation of the upper chambers of the heart, the atria, while the QRS complex and T-wave represent the excitation of the ventricles or the lower chamber of the heart. The detection of the QRS complex is the most important task in ECG signal analysis. Once the QRS complex has been identified a more detailed examination of ECG signal including the heart rate of the ST segment can be performed. In the normal state of the heart, the P-R interval is in the range of 0.12 to 0.2 seconds. The QRS interval is from 0.04 to 0.12 seconds. The Q-T interval is less than 0.42 seconds and the normal rate of the heart is from 60 to 100 beats per minute. So, from the recorded shape of the ECG, we can determine whether the heart activity is normal or abnormal.
3. IMPORTANCE OF ECG
It can be used to determine the speed of heart beat. Any abnormality in the rhythm of heart beat such as
steadiness, disturbances or irregularities can be detected.
The strength and timing of electrical signals can be detected as they pass through each part of the heart.
4. PROBLEMS IDENTIFIED BY ECG
It is used to detect various cardiac disorders including heart attack and congestive heart failure of a person.
It can be used to identify diseases such as an enlarged heart that is working under strain, fast, slow or irregular heartbeats called arrhythmias and ventricular tachycardia.
5. METHODOLOGY
5.1. Data acquisition
We have collected a raw ECG sample from ECG machine for our work.
5.2. Noise present in ECG signal
To make appropriate medical diagnosis, doctors often need to compare the ECG signal with the patient’s own individual record. Therefore, modeling the ECG signal for each patient becomes very important. In addition, ECG signal is often corrupted with noise, which makes an accurate diagnosis very difficult. ECG noise removal is complicated due to the time varying nature of ECG signals. A noise is also generated from the supply voltage.
Effects of Noise
PQRS waveform analysis has proved to be a valuable approach for the identification of ECG. However, the waveform analysis could be precluded due to low signal to noise ratios that make the result inaccurate. In particular, fetal ECG recorded with electrodes placed on the abnormal surface represents a problem for the morphological analysis of fetal PQRS complexes.
Addition of noise
ECG signal consists of noise from the power line which has frequency of 50Hz. Another noise present in ECG is baseline wander.
Baseline wander noise can mask some important features of the electrocardiogram (ECG) signal; hence it is desirable to remove this noise for proper analysis and display of the ECG signal. Notch filtering has been proved as one of the method for the removal of baseline wander from ECG signal. Electrocardiography (ECG) is a tool that is widely used to understand the condition of the heart. The electrocardiographic signal is the electrical representation of the heart's activity. Computerized ECG analysis is widely used as a reliable technique for the diagnosis of cardiovascular diseases. However, ambulatory ECG recordings obtained by placing electrodes on the subject's chest are inevitably contaminated by different types of artifacts. Baseline wander elimination is considered as a classical problem. It is considered as an artifact which produces artifactual data when measuring the ECG parameters, especially the ST segment measures are strongly affected by this noise. In most of the ECG recordings, the respiration, electrode impedance change due to perspiration and increased body movements are the main causes of the baseline wander noise. The baseline wander noise makes the analysis of ECG data difficult. Therefore it is necessary to suppress this noise for correct evaluation of ECG.
5.3.
S
amplingThe ECG signal is sampled before filtering the noise from it.
The fundamental consideration in sampling is how fast a signal can be sampled to be able to reconstruct it. The analog signal is continuous in both time and amplitude. The result of the sampling operation is a signal that is continuous in amplitude but discrete in time. Such signals are often referred to as sampled-data signals. A digital signal is formed from a sampled data-signal by encoding the time-sampled values onto a finite set of values. We use computers to store and analyze the data from the signals. To adapt the ECG signal to digital computer systems we need to digitize it. So, sampling is done.
5.4. Methods of noise removal
Different filtering techniques are used to remove noises from an ECG signal. In our proposed work, we have used notch filter to remove noise.
Notch filter
Copyright © 2013 CTTS.IN, All right reserved circle: then the frequency at which the zero is located is
exactly cancelled from the spectrum of input data. Narrow-band filters and sharp cut-off filters should be used with caution. An ever-present penalty for using such filters is that they do not decay rapidly in time. Although this may not present problems in some applications, it will certainly do so in others. If the data-collection duration is shorter than or comparable to the impulse response of the narrow-band filter, then the transient effects of starting up the experiment will not have time to die out. Likewise, the notch should not be too narrow in a 50-Hz rejection filter. Even a bandpass filter has a certain decay rate in the time domain which may be too slow for some experiments.
A curious thing about narrow-band reject filters is that when we look at their impulse responses, we always see the frequency being rejected.
5.5. Fast- Fourier Transform (―FFT‖)
A Fourier Transform is an algorithm that transforms a signal in the time domain, such as a sample buffer, into a signal in the frequency domain, often called the spectrum. ECG signals can be compressed by using many
techniques. One of the most important technique is Fast Fourier Transform (FFT).The total process of FFT consists of the following steps:
Obtaining a ECG sample or input signal.
Compression of the input signal by removing the low frequency components.
Recovery of the original signal by using inverse FFT.
5.6.Differentiation of the ECG signal
Differentiation forms the basis of many QRS detection algorithms. Since it is basically a high-pass filter, the derivative amplifies the higher frequencies characteristic of the QRS complex while attenuating the lower frequencies of the P and T waves. The final step of this method is to do peak detection.
5.7.R-Peak detection
R wave is one of the most important sections of ECG signal, which has an essential role in diagnosis of heart rhythm irregularities and also in determining heart rate variability (HRV). For a normal healthy person the ECG comes as a periodic signal with depolarization followed by repolarization at equal intervals. However, sometimes this rhythm becomes irregular. Cardiac arrhythmia is a term for any of a large and heterogeneous group of conditions in which there is abnormal electrical activity in the heart. The heart beat may be too fast or too slow, and may be regular or irregular. Hence, detection of R-peaks helps in the diagnosis of the activity of the heart.
5.8.QRS complex
The QRS complex is a general term representing activation in the ventricles and is a result of the depolarization of ventricles. The duration is normally less than 100 ms. The Q and S waves represent negative (downward) deflections on the plot of the lead and the R wave represents positive (upward) deflections. The Q
wave comes before the R wave, and the R wave comes, before the S wave. Not all of the Q, R, and S components have to be present on any particular lead. The actual QRS morphology is specified using the letters, q, Q, r, R, s, and S. An upper case letter signifies a bigger size of the wave than the corresponding lower case letter. For example, a QRS morphology consisting of a small downward deflection, followed by a large upward deflection, and then a small downward deflection would be labeled as qRs. A QRS complex duration of more than 120 ms can reflect an abnormality due to intra ventricular conduction.
6. RESULTS
Fig. 2. Standard ECG signal
This is the ECG signal we have collected for our work.
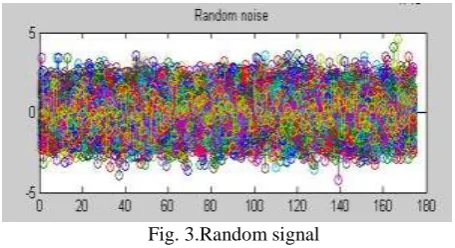
Fig. 3.Random signal
Due to presence of baseline wander noise which is already present in ECG, we generate a random signal.
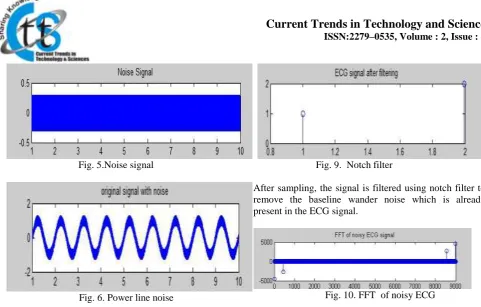
Fig. 5.Noise signal
Fig. 6. Power line noise
Fig. (4),fig. (5) and fig. (6) indicates power line noise. There may be noise from power lines also, so we generate a noise signal of 50 Hz.
Fig. 7. ECG signal with noise from supply voltage
Fig (7) indicates the sum of all the noises and the ECG signal. As a result, noise mixed ECG signal is obtained.
Fig. 8. Sampling of noisy ECG signal
We have done sampling of noise mixed ECG signal so that we can detect the peaks properly. The sampling rate is 750 Hz.
Fig. 9. Notch filter
After sampling, the signal is filtered using notch filter to remove the baseline wander noise which is already present in the ECG signal.
Fig. 10. FFT of noisy ECG
Fast Fourier Transform (FFT) is used so that we can remove the low frequency components of ECG and to straighten the ECG signal. The FFT output is shown in fig. (10)
Fig. 11. First order differentiation
Fig. 12. Second order differentiation
We have done the first order differentiation and second order differentiation in order to preserve the significant values and to remove the small values.
Copyright © 2013 CTTS.IN, All right reserved
Fig. 13(b)
Fig. 13(c)
Fig. 13(d)
Fig. 13(e)
Fig. 13(a) Input signal(Second order differentiation) (b) Normalized signal (c)Peaks and valleys of the normalized signal (d) Second order differentiation input (e)Detection of R-peaks
We used the following steps to detect the R-peaks: • First of all, we found out the absolute values of the positive and negative parts of the differentiated signal and summed them up to obtain the peaks of the signal. This is shown in fig 13(b).
• In fig 13(c) we consider a threshold value such that amplitude becomes equal to 0.3 for peaks greater than the threshold value otherwise the amplitude becomes equal to zero.
• This signal is then multiplied with the differentiated signal to obtain the peaks as shown in fig 13(e). The position of maximum positive value is point R or R-peak in the interval.
Fig. 14. Second order differentiation
Fig. 15. Q-peaks of ECG signal
The Q peak is obtained by taking the output of second order differentiation and comparing the second order differentiation values to a certain threshold. As a result Q peaks is obtained.
Fig. 16.Theoretical ECG signal
Fig. 17. Practical ECG signal
The R peak interval of ECG signal is shown in table(1) and the QRS interval of ECG signal is shown in table(2)
Table (1) R peak interval of ECG signal ECG signal R peak interval
Standard ECG 16 sec Patient ECG 2.5 sec
Table (2) QRS interval of ECG signal ECG signal QRS interval Standard ECG 15 sec
Patient ECG 16 sec
7.
DISCUSSION
During our work, we visited various clinical laboratories to obtain a raw ECG sample on which we can implement our work. Then we collected information on various noises that affects the ECG signal from valid data sources. Then we tried to remove the noise from the signal and after working on it we found that notch filter works well in removing noise from the ECG signal. After filtration we performed FFT on the signal as it helps in detection of intervals between the peaks and valleys of the ECG signal. The sampled ECG signal is further differentiated to get the points of minima or maxima and by using threshold condition we found out the R-peaks of the ECG signal. We also found the interval between the R-peaks and the interval of the QRS complex so that we can interprete the differences between a normal and abnormal ECG signal correctly.
8.
ACKNOWLEDGMENT
We extend our thanks and gratitude to DR.SUNANDAN BARUAH SIR, HOD (ECE Department), and guides HEMASHREE BORDOLOI MADAM and KAUSTUBH BHATTACHARYA SIR under whose guidance our major project could be accomplished and who provided us the timely valuable inputs which enhanced our performance.
REFERENCES
[1] Jenniffer Estrada-Noise corrupted signals and signal processing using matlab.
[2] M. K. Islam, A. N. M. M. Haque, G. Tangim, T. Ahammad, and M. R. H. Khondokar, Study and Analysis of ECG Signal Using MATLAB & LABVIEW as Effective Tools, International Journal of Computer and Electrical Engineering, Vol. 4, No. 3, June 2012
[3] Manpreet Kaur, Birmohan Singh and Seema-Comparisons of Different Approaches for Removal of Baseline Wander from ECG Signal,International Journal of Computer Applications
[4] Mohamed O. Ahmed Omar,Nahed H. Solouma, Yasser M. Kadah-Morphological characterization of ECG signal abnormalities: A new approach [5] Valtino X. Afonso-ECG QRS Detection
[6] Swagatika Priyadarshini- ECG signal analysis: enhancement and R-Peak
[7] K.J.Blinowska and J.Zygierewicz-Practical Biomedical Signal Analysis using MATLAB
[8] sepwww.stanford.edu/sep/prof/pvi/zp/
paper_html/node30.html [9] wwwk.ext.ti.com/SRVS/Data/ti/
KnowledgeBases/analog/document/faqs/notch.htm
[10]
C. Saritha, V. Sukanya, Y. Narasimha Murthy-ECG Signal Analysis Using Wavelet TransformsAUTHOR’S PROFILE
Bishweshwar Pratap Tasa, Pompy Das, Avinash Sinha, Tulika Chenglari
We four are students of final year B.Tech in ECE from Assam Don Bosco University.