An in-vitro Evaluation of Mechanical Properties and Surface Roughness of Bulk Fill vs Incremental Fill Resin Composites
IJPCDR
An in-vitro Evaluation of Mechanical Properties
and Surface Roughness of Bulk Fill vs Incremental
Fill Resin Composites
1Mohammed Muraybid Al Azmi, 2Mohamed I Hashem, 3Mansour K Assery, 4Mohamed Sayed Al Sayed
IJPCDR
ORIGINAL RESEARCH
10.5005/jp-journals-10052-0078
1Postgraduate Student, 2,3Associate Professor, 4Researcher
1Department of Restorative Dentistry, Riyadh Colleges of
Dentistry and Pharmacy, Riyadh, Kingdom of Saudi Arabia
2Department of Dental Health, Dental Biomaterials Research
Chair, College of Applied Medical Sciences, King Saud University, Riyadh, Kingdom of Saudi Arabia
3Riyadh Colleges of Dentistry and Pharmacy, Riyadh, Kingdom
of Saudi Arabia
4College of Engineering, King Saud University, Riyadh, Kingdom
of Saudi Arabia
Corresponding Author: Mohammed Muraybid Al Azmi Postgraduate Student, Department of Restorative Dentistry Riyadh Colleges of Dentistry and Pharmacy, Riyadh, Kingdom of Saudi Arabia, Phone: +966555170073, e-mail: mohammed. [email protected]
ABSTRACT
Aim: To investigate and compare the mechanical properties
of two bulk fill resin composite materials (Tetric EvoCeram and Filtek Bulk Fill) and two incremental fill resin composites (Grandio and Filtek Z350 XT). The surface roughness and
surface topographic analyses of these materials were also evaluated and compared.
Materials and methods: A total of 120 specimens (n = 20) were prepared from two bulk fill nanocomposite restorative materials and two incremental fill nanocomposite restorative
materials to evaluate the mechanical properties [hardness
(H), elastic modulus (E), compressive strength (S), flexural strength (Of), and surface roughness]. The hardness and elastic modulus were measured using nanoindenter equipped with a
Berkovich diamond indenter. Compressive strength and flexural
strength of each material were determined using a universal testing machine. The surface roughness of the materials was
determined using atomic force microscopy. One-way analysis
of variance followed by Tukey’s post hoc test was used to
deter-mine the statistical differences among groups at a significance
of p < 0.05.
Results: The nanoindentation test showed that the Filtek Bulk
Fill exhibited significantly high hardness values (0.67 ± 0.02 GPa) compared with other groups. The elastic modulus values ranged from 12.2 to 18.2 GPa, Tetric EvoCeram presented
with lowest modulus values, and Filtek Bulk Fill presented with highest values. For compressive strength test results, the values
varied from 186.20 MPa for Grandio to 245.13 MPa for Filtek Z350 XT. For flexural strength test results, the values varied from 110.00 MPa for Grandio to 132.61 MPa for Filtek Z350
XT. There was significant difference (p ≤ 0.05) in measured flexural strength values among the bulk fill and incremental fill
composite resin groups.
Conclusion: Each material showed excellent values for some tests, but none of the material showed excellent values of all the
measured properties. Filtek Bulk Fill could be a feasible choice
among the bulk fills.
Keywords: Bulkfill Composites, Nanoindentation, Surface
Roughness.
How to cite this article: Al Azmi MM, Hashem MI, Assery MK, Al Sayed MS. An in-vitro Evaluation of Mechanical Properties and Surface Roughness of Bulk Fill vs Incremental Fill Resin Composites. Int J Prev Clin Dent Res 2017;4(1):37-42.
Source of support: Nil
Conflict of interest: None
INTRODUCTION
Resin-based composites were introduced to dentistry in the 1950s to overcome the esthetic problem rather than the functional problem of dental amalgam.1 Composite resin is “a mixture or combination of two or more micro or macro constituents which differ in form and chemical composition and are essentially insoluble in each other.”2 The composites introduced in the early years had many disadvantages, such as polymerization shrinkage up to 20 to 25%, unstable color, low stiffness, and lack of adhesion to tooth structure.
consum-ment between each increconsum-mental layer of resin composite.10 The introduction of bulk fill composites has aimed at solving the obstacles faced by incremental placement techniques. The advantage of the so-called “bulk fill” composite material is that it can be placed in a 4-mm thickness bulk and cured in one step instead of the current incremental fill technique, without any effect on polym-erization shrinkage, cavity adaptation, and decreased moisture contamination.11,12 Bulk filling composites have higher filler volume percentage, and occasionally a modi-fied initiator system to ensure better curing in depth, as compared with traditional composites, thus ensuring superior physical and mechanical properties to combat higher masticatory forces.13 It is also reported that the bulk fill resin composites reduce cuspal deflection and promote light transmittance.12,14
When defining composites, certain properties should be evaluated. These include, but are not limited to, hardness, flexural strength, and compressive strength.15 Therefore, the aim of this study was:
• To compare the mechanical properties of bulk fill resin composite and incremental fill resin composites. The following properties were evaluated: Nanohardness (H), elastic modulus (E), compressive strength (S), and flexural strength (Of).
• To investigate the differences in surface roughness between the materials.
MATERIALS AND METHODS
The brand, composition, and manufacturer of the com-posite materials used in the current study are listed in Table 1.
Nanoindentation Measurement of Hardness and Elastic Modulus
Five disc-shaped specimens (12 × 8 mm) per each com-posite resin material were prepared using a silicone mold according to manufacturer’s recommendation. The
The hardness and elastic modulus were measured using nanoindenter (Bruker, Tucson, Arizona, USA) equipped with a Berkovich diamond indenter in ambient tem-perature of 23°C and low noise conditions. The indenter loading rate was 0.01 mN/s and unloading rates was 0.02 mN/s, with a 5 s resting period for varying the load between 1.0 and 25 mN. Five indentations per composite specimen were made and mean values of nanohardness were calculated. Once the hardness values of the specimens were determined, the elastic modulus was obtained math-ematically from the load displacement curve.
Compressive and Flexural Strength Measurement
Ten cylindrical specimens (6 × 3 mm) and ten bar-shaped specimens (25 × 2 × 2 mm) were prepared per each composite resin material for compression and flexural strength measurements respectively. All the specimens were stored in distilled water for 24 hours before testing. The test was performed with a universal testing machine (Instron Corporation, Massachusetts, USA). The com-pressive load was applied along the long axis of the specimen at a cross-head speed of 1.0 mm/min until the compressive failure of the specimen occurred. For flexural strength measurements, the specimens were placed on the attachments on a universal test machine with 20 mm distance between the supports followed by a transverse load directed toward the center of the specimen at a cross-head speed of 1 mm/min. The data were collected by the computer connected to the universal testing machine.
Surface Roughness Measurements
Two disk-shaped specimens (12 × 2 mm) per each com-posite resin material were prepared using a silicone mold according to manufacturer’s recommendation. The speci-mens were polished with Swiss flex abrasive disks with a decreasing size of the abrasive particles (coarse, medium, fine, ultrafine) to obtain a smooth surface for surface
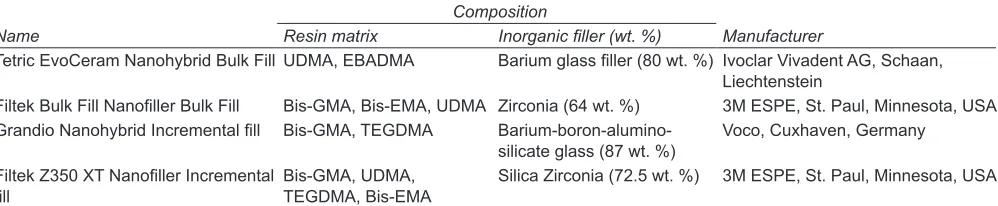
Table 1: Composite materials used in the present study
Name
Composition
Manufacturer Resin matrix Inorganic filler (wt. %)
Tetric EvoCeram Nanohybrid Bulk Fill UDMA, EBADMA Barium glass filler (80 wt. %) Ivoclar Vivadent AG, Schaan,
Liechtenstein
Filtek Bulk Fill Nanofiller Bulk Fill Bis-GMA, Bis-EMA, UDMA Zirconia (64 wt. %) 3M ESPE, St. Paul, Minnesota, USA
Grandio Nanohybrid Incremental fill Bis-GMA, TEGDMA
Barium-boron-alumino-silicate glass (87 wt. %) Voco, Cuxhaven, Germany Filtek Z350 XT Nanofiller Incremental
An in-vitro Evaluation of Mechanical Properties and Surface Roughness of Bulk Fill vs Incremental Fill Resin Composites
IJPCDR
roughness measurement. The specimens were subjected to atomic force microscopic (AFM; MultiMode 8-HR, Bruker, USA) analysis operating in contact mode. The measure-ments were done in air. Totally, six areas (2 in right, 2 in left, and 2 in the center) were scanned for evaluating the surface roughness. The surface roughness was calculated by the Nanoscope software connected to the AFM system.
Statistical Analysis
The data collected from each test were subjected to statisti-cal analysis using Statististatisti-cal Package for Social Sciences version 18.0 (SPSS Inc., Chicago, Illinois). The means of each group were analyzed by one-way analysis of vari-ance (ANOVA), and multiple comparisons of means were tested with Tukey’s post hoc analysis at a significance limit of p < 0.05.
RESULTS
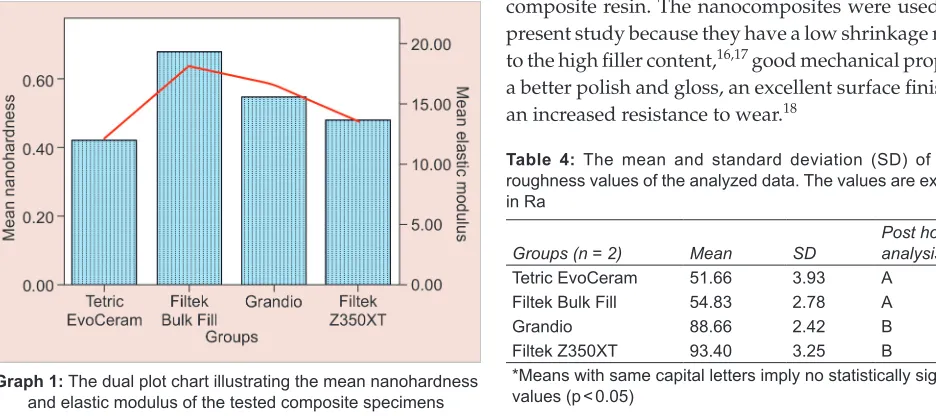
The analyzed data of nanohardness and elastic modulus measurements are presented in Table 2 and Graph 1. The nanohardness values ranged from 0.42 to 0.67 GPa. The one-way ANOVA test presented significant differences (p ≤ 0.05) among the tested composite materials. The elastic modulus values ranged from 12.2 to 18.2 GPa. Tetric
EvoCeram presented with the lowest modulus values and Filtek Bulk Fill presented with the highest values.
The compressive strength values varied from 186.20 MPa for Grandio to 245.13 MPa for Filtek Z350 XT. There were significant differences (p ≤ 0.05) among the tested composite material group as shown by Tukey’s honest significant difference test (α = 0.05) (Table 3). The flexural strength values varied from 110.00 MPa for Grandio to 132.61 MPa for Filtek Z350 XT. There were significant differences among the bulk fill and incremental compos-ite resin groups as shown by Tukey’s post hoc analysis (p ≤ 0.05) (Table 3).
The analyzed data for surface roughness test measure-ments are presented in Table 4 and Figures 1A to D. The values varied from 51.66 MPa for Tetric EvoCeram to 93.40 MPa for Filtek Z350 XT. There were no significant differences (p ≤ 0.05) between the bulk fill composite resin groups and incremental composite resin groups as shown by Tukey’s post hoc analysis.
DISCUSSION
The present study evaluated four nanocomposites, out of which two were bulk fill and two were incremental fill composite resin. The nanocomposites were used in the present study because they have a low shrinkage relative to the high filler content,16,17 good mechanical properties, a better polish and gloss, an excellent surface finish, and an increased resistance to wear.18
Table 2: Mean and standard deviation (SD) of nanohardness
and elastic modulus values of the analyzed data. The values are
expressed in GPa
Groups (n = 5)
Nanohardness Elastic modulus
Mean SD Post hoc analysis* Mean SD Post hoc analysis*
Tetric EvoCeram 0.42 0.05 A 12.2 1.92 A Filtek Bulk Fill 0.67 0.02 B 18.2 0.83 B
Grandio 0.55 0.04 C 16.6 1.81 B
Filtek Z350 XT 0.48 0.04 A,C 13.6 0.89 A
*Means with same capital letters imply no statistically significant values (p < 0.05)
Table 3: Mean and standard deviation (SD) of compressive and flexural strength values of the analyzed data. The values are expressed in MPa
Groups
(n = 5)
Compressive Strength Flexural strength
Mean SD Post hoc analysis* Mean SD Post hoc analysis*
Tetric
EvoCeram 238.32 8.22 A 115.16 8.41 A Filtek Bulk
Fill 213.40 7.89 B 130.84 5.53 B
Grandio 186.20 4.32 C 110.00 5.70 A
Filtek Z350
XT 245.13 9.67 A 132.61 9.09 B *Means with same capital letters imply no statistically significant values (p < 0.05)
Table 4: The mean and standard deviation (SD) of surface roughness values of the analyzed data. The values are expressed
in Ra
Groups (n = 2) Mean SD Post hoc analysis*
Tetric EvoCeram 51.66 3.93 A Filtek Bulk Fill 54.83 2.78 A
Grandio 88.66 2.42 B
Filtek Z350XT 93.40 3.25 B
*Means with same capital letters imply no statistically significant values (p < 0.05)
Nanoindentation is a widely accepted technique for determining the mechanical properties of a material from the derived indentation load–displacement response.19 Nanoindentation is unique from other measurement tech-niques as there is no need to image the indentation area to determine the mechanical properties, such as hardness. These can be obtained directly from the indentation load and displacement measurements.20
Hardness is an indirect measurement of the degree of conversion (%) of the material and gives valuable information on the depth of polymerization when such measurements are carried out on the top and bottom surfaces of cured samples.21-23
The elastic modulus describes the relative stiffness of a material. A high elastic modulus is required to withstand deformation and cuspal fracture especially in stress-bearing occlusal contact areas. The materials with a low modulus deform more under masticatory stresses and may cause a catastrophic failure.11,24,25
The nanohardness and elastic moduli (Graph 1) of two bulk fill and two incremental fill resin composites evaluated in this study showed Filtek Bulk Fill with good hardness and elastic modulus values compared
with other tested materials. This observation was con-tradictory to the outcome of elastic modulus values of the previous study for Filtek Bulk Fill. The present study presented with values of 18.2 GPa as compared with 3.7 GPa in the previous study. This difference may be due to the method of testing; the previous study had used a three-point bending test for testing the elastic modulus of the material.26
The elastic modulus values and nanohardness values for Grandio recorded in our study were very similar to the values obtained in the previous studies. The nano-hardness values for Grandio in our study were 0.55 GPa as compared with 0.72 GPa in the previous studies.26,27 However, Grandio presented with excellent hardness and modulus values in both the previous studies as compared with our study. A study on hardness of composite resins confirmed that Tetric EvoCeram Bulk Fill enabled curing up to 4 mm in one step, which is similar to the results of this study.28
Flexural strength is the material property that indicates the quantity of flaws within the material that may have the ability to cause catastrophic failure due to loading.29,30 The compressive strength plays an important role in the
Figs 1A to D: The representative surface roughness image measured by AFM
at right, center, and left portions of (A) Tetric EvoCeram; (B) Filtek Bulk Fill; (C) Grandio; and (D) Filtek Z350 XT specimen
A
B
C
An in-vitro Evaluation of Mechanical Properties and Surface Roughness of Bulk Fill vs Incremental Fill Resin Composites
IJPCDR
mastication process.31,32 The compressive and flexural strength values of the incremental fill resin used in the study were very similar to the values reported earlier by Rosa et al,27 except for the compressive strength of Filtek Z350 XT, which was comparatively a high value of 245.13 MPa as compared with 184.67 MPa in the previous study.
Another study by Leprince et al,26 evaluated the flexural strengths of Tetric EvoCeram, Filtek Bulk Fill, and Grandio, and the values obtained were 94.5, 88.4, and 125 MPa as compared with 115, 130, and 110 MPa in our study. On the contrary, Ilie et al33 showed that the flexural strength of Tetric EvoCeram and Filtek Bulk Fill was very similar and in agreement with the outcome of the present study.
Among the exhibited properties of the nanocom-posites, surface roughness is of utmost importance as it may predict the outcome of the final restoration. Surface roughness on the composite restoration affects the esthetic appearance and discoloration of restorations, plaque accumulation, secondary caries, gingival irritation, and increases tooth wear of opposing or adjacent teeth.18,34,35 In the present study, Tetric EvoCeram showed least roughness values of 51.66 nm followed by Filtek Bulk Fill. Both of the bulk fill composite resins showed significantly lower surface roughness values as compared with the incremental fill composite resin. The highest roughness value was found in Filtek Z350 XT. The three-dimensional AFM image (Figs 1A to D) showed uniform surface texture on all the measured points for Tetric EvoCeram and Filtek Bulk fill composite resin materials. However, all the tested composites had roughness values below 200 nm. Surface roughness (Ra) values above 200 nm result in increased plaque accumulation and increased risk of secondary caries and periodontal inflammation.34 This is advantageous from the clinical point of view, because there will be no risk of plaque accumulation on the composite surfaces.36
The limitation of this study was that it was performed under ideal or laboratory conditions; the test results could be even less in clinical situations depending on the technique, isolation, and many other variables. Further research should emphasize on testing the degree of con-version and marginal integrity of Bulk Fill and Incremen-tal Fill composite resins.
CONCLUSION
In the present study, the following conclusions are drawn: • Filtek Bulk Fill showed better mechanical properties
than all other materials compared, except for a low compressive strength.
• Filtek Bulk Fill exhibited better mechanical properties than Tetric EvoCeram among the bulk fill materials, and Filtek Z350 XT was better than Grandio.
• Tetric EvoCeram had the least surface roughness compared with other composite materials, but was not statistically significant.
REFERENCES
1. Elhamid MA, Mosallam R. Effect of bleaching versus repol-ishing on colour and surface topography of stained resin composite. Aust Dent J 2010 Dec;55(4):390-398.
2. Ruse ND. What is a “compomer”? J Can Dent Assoc 1999 Oct;65(9):500-504.
3. Curtis AR, Shortall AC, Marquis PM, Palin WM. Water uptake and strength characteristics of a nanofilled resin-based com-posite. J Dent 2008 Mar;36(3):186-193.
4. Marchan S, White D, Smith W, Coldero L, Dhuru V. Compari-son of the mechanical properties of two nano-filled composite materials. Rev Clín Pesq Odontol 2009 Sep-Dec;5(3):241-246. 5. Cramer NB, Stansbury JW, Bowman CN. Recent advances
and developments in composite dental restorative materials. J Dent Res 2011 Apr;90(4):402-416.
6. Da Rosa Rodolpho PA, Donassollo TA, Cenci MS, Loguercio AD, Moraes RR, Bronkhorst EM, Opdam NJ, Demarco FF. 22-Year clinical evaluation of the performance of two posterior com-posites with different filler characteristics. Dent Mater 2011 Oct;27(10):955-963.
7. Sakaguchi RL, Douglas WH, Peters MC. Curing light perfor-mance and polymerization of composite restorative materials. J Dent 1992 Jun;20(3):183-188.
8. Versluis A, Douglas WH, Cross M, Sakaguchi RL. Does an incremental filling technique reduce polymerization shrinkage stresses? J Dent Res 1996 Mar;75(3):871-878.
9. Furness A, Tadros MY, Looney SW, Rueggeberg FA. Effect of bulk/incremental fill on internal gap formation of bulk-fill composites. J Dent 2014 Apr;42(4):439-449.
10. Flury S, Hayoz S, Peutzfeldt A, Husler J, Lussi A. Depth of cure of resin composites: is the ISO 4049 method suitable for bulk fill materials? Dent Mater 2012 May;28(5):521-528. 11. Ilie N, Hickel R. Investigations on mechanical behaviour of
dental composites. Clin Oral Investig 2009 Dec;13(4):427-438. 12. Walter R. Critical appraisal: bulk-fill flowable composite
resins. J Esthet Restor Dent 2013 Feb;25(1):72-76.
13. Abouelleil H, Pradelle N, Villat C, Attik N, Colon P, Grosgo-geat B. Comparison of mechanical properties of a new fiber reinforced composite and bulk filling composites. Restor Dent Endod 2015 Nov;40(4):262-270.
14. Moorthy A, Hogg CH, Dowling AH, Grufferty BF, Benetti AR, Fleming GJ. Cuspal deflection and microleakage in premolar teeth restored with bulk-fill flowable resin-based composite base materials. J Dent 2012 Jun;40(6):500-505.
15. Rodrigues SA Jr, Scherrer SS, Ferracane JL, Della Bona A. Microstructural characterization and fracture behavior of a microhybrid and a nanofill composite. Dent Mater 2008 Sep;24(9):1281-1288.
16. Kleverlaan CJ, Feilzer AJ. Polymerization shrinkage and contraction stress of dental resin composites. Dent Mater 2005 Dec;21(12):1150-1157.
17. Lu H, Lee YK, Oguri M, Powers JM. Properties of a dental resin composite with a spherical inorganic filler. Oper Dent 2006 Nov;31(6):734-740.
indenter. J Mater Res 2007 Apr;22(4):893-899.
20. El-Safty S, Akhtar R, Silikas N, Watts DC. Nanomechani-cal properties of dental resin-composites. Dent Mater 2012 Dec;28(12):1292-1300.
21. Ferracane JL. Correlation between hardness and degree of conversion during the setting reaction of unfilled dental restorative resins. Dent Mater 1985 Feb;1(1):11-14.
22. Soh MS, Yap AU, Siow KS. The effectiveness of cure of LED and halogen curing lights at varying cavity depths. Oper Dent 2003 Nov-Dec;28(6):707-715.
23. Aravamudhan K, Floyd CJ, Rakowski D, Flaim G, Dickens SH, Eichmiller FC, Fan PL. Light-emitting diode curing light irradiance and polymerization of resin-based composite. J Am Dent Assoc 2006 Feb;137(2):213-223.
24. Yap AU, Wang X, Wu X, Chung SM. Comparative hardness and modulus of tooth-colored restoratives: a depth-sensing microindentation study. Biomater 2004 May;25(11):2179-2185. 25. Yasuda G, Inage H, Kawamoto R, Shimamura Y, Takubo C,
Tamura Y, Koga K, Miyazaki M. Changes in elastic modulus of adhesive and adhesive-infiltrated dentin during storage in water. J Oral Sci 2008 Dec;50(4):481-486.
26. Leprince JG, Palin WM, Vanacker J, Sabbagh J, Devaux J, Leloup G. Physico-mechanical characteristics of commercially available bulk-fill composites. J Dent 2014 Aug;42(8):993-1000. 27. Rosa RS, Balbinot CE, Blando E, Mota EG, Oshima HM,
Hirakata L, Pires LA, Hubler R. Evaluation of mechanical properties on three nanofilled composites. Stomatolog 2012 Jan;14(4):126-130.
tion kinetics of bulk-fill resin based composites. J Dent 2013 Aug;41(8):695-702.
29. Fujishima A, Ferracane JL. Comparison of four modes of fracture toughness testing for dental composites. Dent Mater 1996 Jan;12(1):38-43.
30. Rodrigues SA Jr, Ferracane JL, Della Bona A. Flexural strength and Weibull analysis of a microhybrid and a nanofill compos-ite evaluated by 3- and 4-point bending tests. Dent Mater 2008 Aug;24(3):426-431.
31. Gomec Y, Dorter C, Dabanoglu A, Koray F. Effect of resin-based material combination on the compressive and the flexural strength. J Oral Rehabil 2005 Feb;32(2):122-127. 32. Silva CM, Dias KR. Compressive strength of esthetic
restor-ative materials polymerized with quartz-tungsten-halogen light and blue LED. Braz Dent J 2009;20(1):54-57.
33. Ilie N, Bucuta S, Draenert M. Bulk-fill resin-based composites: an in vitro assessment of their mechanical performance. Oper Dent 2013 Nov-Dec;38(6):618-625.
34. Bollen CM, Lambrechts P, Quirynen M. Comparison of surface roughness of oral hard materials to the threshold surface roughness for bacterial plaque retention: a review of the literature. Dent Mater 1997 Jul;13(4):258-269.
35. Ono M, Nikaido T, Ikeda M, Imai S, Hanada N, Tagami J, Matin K. Surface properties of resin composite materials rela-tive to biofilm formation. Dent Mater J 2007 Sep;26(5):613-622. 36. Chung KH. Effects of finishing and polishing procedures