INTRODUCTION
Analysis of eeg signals using wavelets -some findings
In the field of EEG for neuropathology and disorders, there are quite many requirements. Some aim at EEG noise reduction for a better visual observational diagnostics. A fast wavelet transform for EEG, with a view to real time instrument observation, has been reported by Steven J.Schiff et al.,¹ (1994). Multi-resolution decomposition of EEG with a view to analyze local pathological patterns is very useful. A Wavelet-Like Filter Based on Neuron Action Potentials for Analysis was illustrated by Glassman² (2005). Apar t from denoising3, another area has been in (automatic) identification of onset of spikes to aid in continuous patient monitoring.
EEG diagnosis primarily depends on visual observation of a chart or on the screen waveforms
Electro encephalography measurements using
wavelet based signal processing (Part 1)
S. ANANTHI*, V. VIDYADEVI and K. PADMANABHAN
Central Instrumentation Research and Department, University of Madras, A.C Tech Campus, Chennai - 25 (India).
(Received: July 20, 2008; Accepted: August 29, 2008) ABSTRACT
Generally, EEG waveforms are recorded and observed for prolonged periods. The pathological findings are based on measurements of abnormal wave patterns which can appear once in a while. Wavelets is a useful technique of signal analysis which finds application for diagnosing EEG pathology. First, it is explained how Multi-resolution analysis is performed on wavelets to show up with a good match ato the clinical bands of Alpha, beta , delta and theta rhythms in addition to waves and spikes. The appropriate choice of a wavelet is explained and the method indicated. Two method of displaying of wavelet analysis results are illustrated, one of plotting the maximal scale coefficients plot versus time; another of plotting the scale intensities versus scale value at a time point chosen for good EEG activity using the line of maxima in the scalogram figure. Comparative studies of a patient’s records over a long period of observation can be easily made to assess the disease prognosis.
Key words: Stochastic signal, EEG Records, Photic stimulation, Fourier Transform, Wavelet Transform, Choice of wavelets.
characteristic of that pathology could exist with lesser amplitude and time (scale) even in the normal record and prior to the occurrence of the large amplitude pulse. In fact, it is common practice to stimulate the brain by photic or acoustic stimulation to elicit the spikes if such a pathology was lurking in a patient.
In other words, the abnor mal characteristic pathology will reveal itself only by stimulation or after waiting on the record over an extended period of time. While stimulation is good in one sense in this way, it is not good for the patient himself because it disturbs the brain and for some cases of subdued grand or petit mal this may even provoke it. So it is clear that while the records themselves are indicative of the appropriate pathology either lurking or imminent, it is advisable to diagnose it directly as far as possible without stimulation. If we can observe the spikes and waves even from nor mal records, we may avoid stimulation whenever possible. In follow-up diagnostics, where repeated records taken over weekly or monthly periods are compared, stimulation is better avoided.
In this paper, a method using wavelet analysis is first described. While a sine wave based Fourier analysis is useful in analyzing periodic and time invariant phenomena, wavelet analysis is well suited to analysis of transient time var ying signals. When we obser ve the pattern of the wavelet scalogram side by side with the EEG signal record, the correlations between values in the scalogram is very small and that leads to quicker identification of patterns. Voluminous amounts of such analysis have been performed on the full EEG records for many a patient and from these, certain excerpts which are based on multi resolution analysis are illustrated in the figures that follow. Characteristic patterns can be isolated from such lengthy records. Several wavelets are used and the results can be compared. From these, a suitable choice is made.
Current methods for eeg analysis and interpretation
Analyzing EEG records first and interpreting the same is the process of investigation.
Visually analyzing the raw data and quantitatively examining the time series are the two methods that are available today.
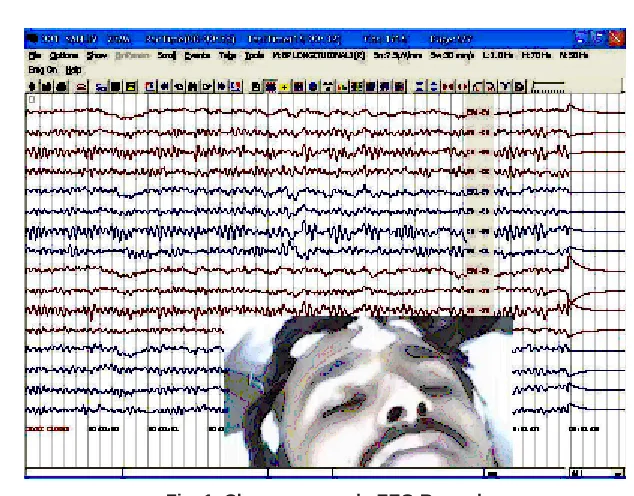
In the first alternative, the complete EEG record, involving 16 to 32 channels of information and 20 to 30 minutes of recording, is examined visually by the clinical neurophysiologist. A short section of EEG record for a patient is illustrated in fig.1. This is a sample of an inter-ictal record with no stimulation. Like this, several records were obtained and analysed in this work. In the second method, analysis based on frequency patterns from time to time is performed. The record is first described for the present EEG periodicities, like the wavefor m itself, the amplitudes of it, the topographical distribution (which lobe of the head) and the changes in the regularity due to opening of the eyes, hyperventilation (deep breathing) and photic stimulation (using flashing bulb against the subject).
Posttraumatic epilepsy and other causes of epilepsy by means of EEG scores is believed by physicians to be unsolvable.
Developing a new technology that could improve on analyzing and interpreting the EEG information definitely has a considerable contributing effect.
Using Wavelets For EEG Signal
Looking at the record (fig. 1) leads to one or more of the following inferences.
1. Mainly all waveforms are apparently random. 2. Spatial correlation is generally good in EEG
signals
3. Temporal correlation is absent over long
periods.
This is one main reason for the data to get massive in size.
Also, the Fourier Spectrum also becomes meaningless for the same reason.
Had the waveform been a pure sine wave, then we will get a single coefficient to represent that. So, when we take the spectrum of an EEG, we do not normally get well defined limited number of peaks, but a noisy spectrum.
Early day EEG analysers had a Spectrum Analysis Channel in-built in the machine, using analog filters.
Fig. 1: Shows a sample EEG Record
But that was useful only for very clearly seeing rhythm-signals, but not for pathological ones.
Herein we introduce the Wavelet based EEG Analysis. As stated above, in its various possibilities, let us examine typical wave records using wavelet analysis and observe the same.
Clinical EEG data from several types of
Multi resolution plots
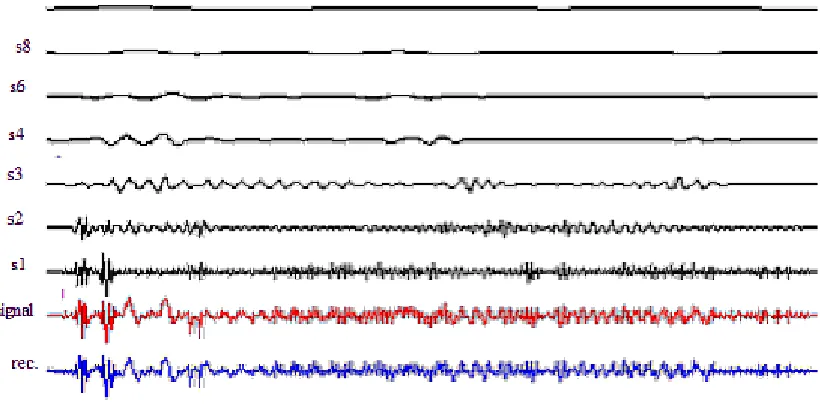
In a multiresolution analysis, the wavelet is decomposed into several scales and a plot each of the scale components is a waveform. (Fig 2). Scale is a term that is the reciprocal of frequency, with a factor that varies with the wavelet type. A low scale wavelet is a higher frequency wave than a higher numbered scale wave. Combining some
scales and plotting the same with a view to eliminate high frequency components is also helpful. “Sig” shows the signal, “rec”, its reconstruction in this way. It is noted that the level ‘s3’ gives a signal which is indicative of the component wave that fluctuates. s1- s6 are scale numbers. The higher scale numbers are still lower frequencies.
Fig. 2: A multi resolution analysis of a signal shows the predominant component at some scale or other
The scale which gives the maximum amplitude at any instant of time, — not maximum in the average sense — is chosen to be significant for this period for this patient signal. A program using Matlab ( Cf. Appendix ) was used to show the details of the maximal signal at the scale at which it is present. Patterns of alpha activity which are not always visible in the main signal show up better in the time course plot at the resolved (maximal) scale.
Example 1
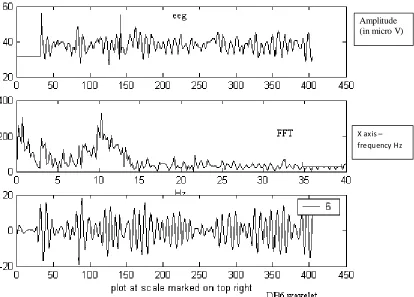
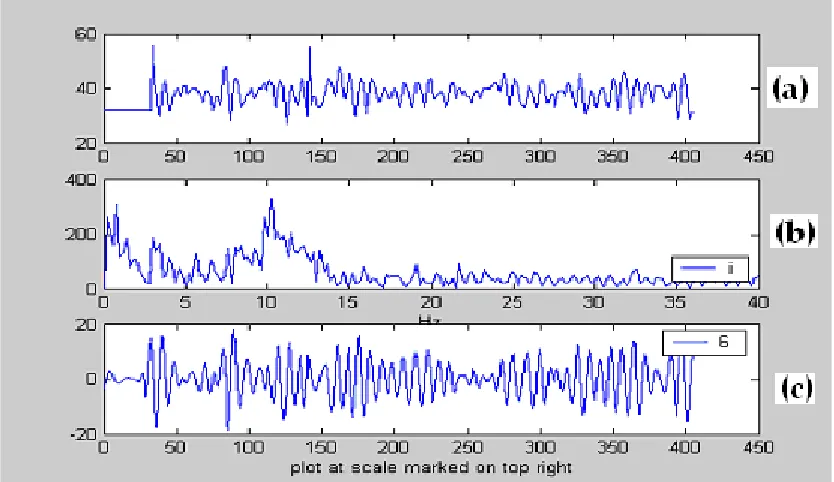
This is taken from a short segment of the patient’s inter-ictal record. The segment was taken from leads F1-F2 and shown in fig. 3(a) below. The actual Fourier Spectrum is in (b), indicating good alpha activity around 12 Hz. To show out this clearly, using DB6 Wavelet (Cf. Section 4.1), the spectrum
is shown in Fig (c) for this scale. The program using Matlab is given in the appendix.
Good localization and frequency selectivity are noted in fig.(c). The variation of alpha activity in a slow pattern is noted which is not that clear in fig.(a), the original signal.
Amplitude (in micro V)
X axis –
frequency Hz
Fig. 3: The EEG, its spectrum and the wavelet (DB6) decomposition at level 6, corresponding to a frequency of 11Hz. The X axis is in time, milliseconds for top and bottom figures
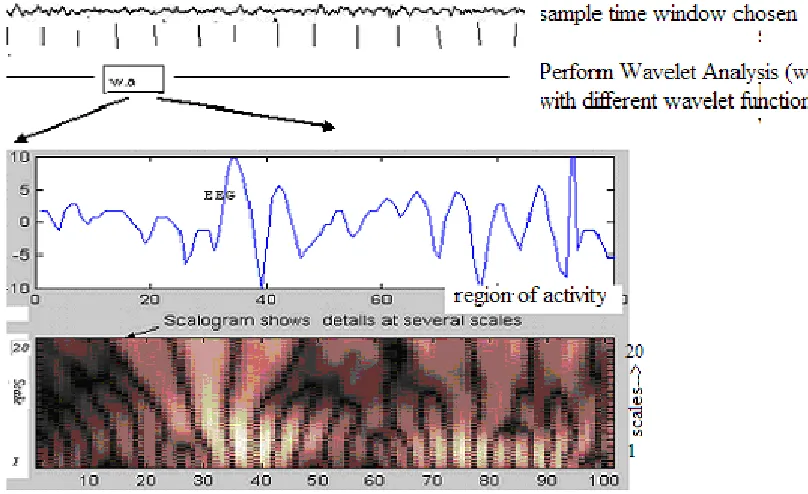
at the delta, alpha, theta regions of EEG frequencies. In this, the entire plot of the Continuous wavelet transform (CWT) in scalogram (fig.3) is observed for local peak regions on the computer. (not shown here). This is useful when a quick instant observation of the large time course of signal is to be taken. We may take about 8000 or much more data samples of the EEG, over a time of 30 seconds, perform a CWT analysis with an optimal wavelet (Sec. 4.2) chosen. The intensity plot shows the region of maximal activity. Fig.4 just shows a very short sample of the same.
From the total scalogram plot, regions are marked for closer observation, like the one in fig.4. The wavelet transform is taken at different scales and the scale at which the peaks are maximal in these regions is selected. Then, the signal at this scale is plotted. This is what is shown in fig.3
bottom). In this illustration, the maximum wave peaks were present at scale 6. The wavelet used here is DB6. This is the method that proved helpful in identifying activity in the long record which is worthy of details observation by the clinician. This method is useful in patients having short and sudden outbursts of alpha or spike and wave activity amidst a long quiet interval.
Fig. 4: Scalogram shows the wavelet coefficients as intensity plot
with typical examples
Choosing the appropriate wavelet for a signal is important if the details are to be clearly and correctly represented. That depends on what kind of signal it is, of what oscillatory components it is made up of and so on.
Choosing among several wavelets The Fourier transform provides an infinite number of frequencies of any signal. We can reconstruct the signal back from the frequencies using the inverse transform. This property of reconstruction is possible if the function possesses or thogonality. The sinusoidal waves are orthogonal. Likewise, certain wavelets have or thogonality. But unlike the sinusoidal function which exists for all time, the wavelet is short and is said to have a compact support. Just as sine functions have harmonics, there are higher frequency components for a wavelet. It is the total combination of such components that we get when perform a wavelet transform of a signal. The concept of scale is introduced in wavelets, which is the reciprocal of the usually employed term frequency in Fourier
analysis. A higher scale means a lower frequency wavelet.
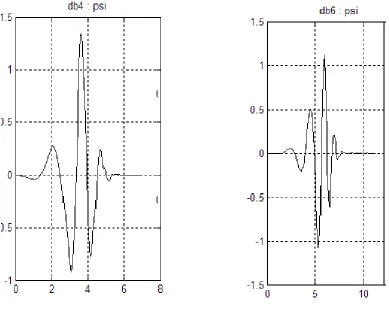
WaveletsFig.4. Scalogram shows the wavelet coefficients as intensity plot which possess orthogonality are the Daubechies series of wavelets named as DB4, DB6 etc., where the numbers 4 and 6 mean the range of support. A DB6 pattern and DB4 are shown below for comparison. The same wavelet function is used for reconstruction in these wavelets. In yet another class of wavelets called bior thogonal wavelets, there are two functions, one for splitting the signal into wavelet coefficients and another for reconstruction. The biorth.3.7 wavelet is having three taps for the forward seven for the reconstruction wavelet.
Fig. 5: Showing the wavelets for Db4 and Db6
The wavelets can be checked for appropriate choice in the case of stochastic signals like that of the EEG through the following principle. 1. Take the Fourier Transform of the Signal; 2. Take the Fourier Transform of the Wavelet
Chosen.
3. Find the Cross correlation (c.c) function of the above.
4. Observe if the function is having one or more peaks. Find the peak factor.
5. Compare and pick the wavelet with the maximum value of this factor.
6 Also, the peak value of this function can be noted down for different wavelets.
The peak factors of c.c. functions is
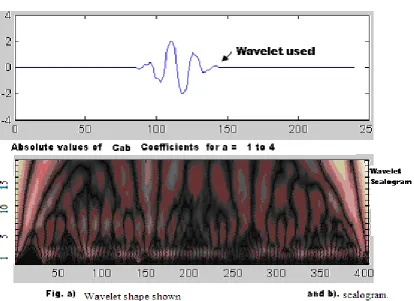
Fig. 6: a Showing the bior.3.7 wavelet used for the previous EEG signal and b) giving maximal details clearly in the scalogram.
indicative of the peakiness of the spectral content of the wavelet spectrum.
The one which gives the max peak factor among these is a suitable wavelet for this signal. For the signal in fig.3, the biroth.3.7 wavelet (fig. 6) gave a c.c. value of 0.64, more than for other wavelets like DB6, and hence it is chosen for displaying the wavelet transform of this signal segment.
The peak factors of c.c. functions is
indicative of the peakiness of the spectral content of the wavelet spectrum.
EEG signal inferences - examples
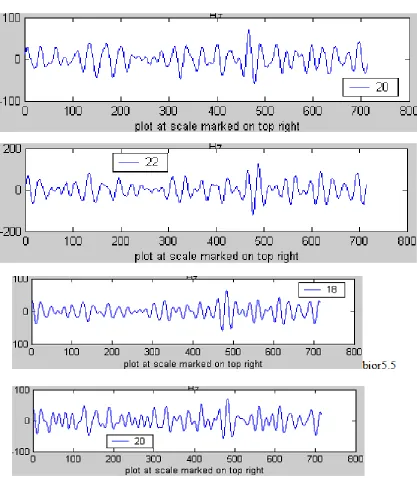
Fig. 8: Figure showing the maximal scale plot with different wavelets for the eeg sample(top)
using a non-linear wavelet (dB6). This plot is picked from the total CWT at the maximum value point chosen form the c-matrix. Comparing the c-values at each of the scales for maximum, it is found that maximum activity is occurring at scale –6 in this figure. Then along that scale, the values of wavelet coefficients is plotted versus time samples, shown in fig.c.
From this figure, it is clear, that the activity is
continuously present with a low frequency modulation throughout the time of 5s. The ringing pattern is seen all through but is not visible from the fig.a. Hence, a better diagnosing is easily made from fig.c.
The same is repeated for DB10 and other wavelets are shown in fig.8 for a different patient’s extract from record.
amplitude for the signal at the scale of 6. The low frequency modulation is clearly seen.
Spectral plot along the line of maxima
Another method for comparison purposes is to draw the plot of the spectral distribution at any short region of the signal using wavelet coefficients. From the scalogram, the region where bright areas are present can be selected and in this region, a line of maxima is drawn as shown in fig.9 in (c)
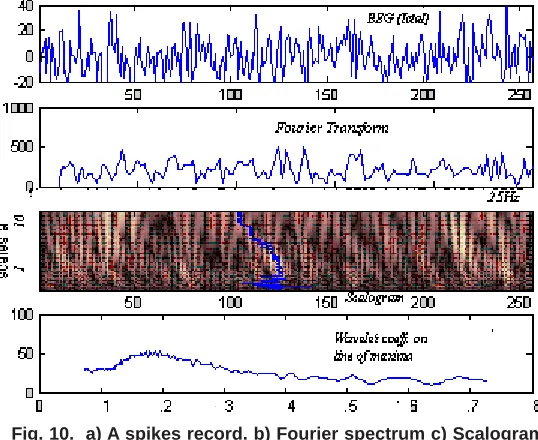
In fig.10 is shown another ictal record example where the signal is that of an epileptic patient. The Fourier spectrum shows random pattern over the entire frequency range and is not useful for comparison between sections of the same record or for follow up. The scalogram is visible with regions of high acitivity and at that point, the line of maxima is found. Along this line, the plot of wavelet coefficients versus scale gives the line of maxima spectrum. As different from fig.9, this is
Fig. 9 a) a short signal of slow activity. b) Fourier Spectrum showing peaks in the low delta region c) Scalogram for 250 samples with scales from 5 to 60. The line of maxima is drawn as the wavy line d) The wavelet scale spectral plot.
able to give a region of 0.2 (x10) at scale 2 This is useful for comparison purposes rather than the Fourier spectral plot.
In Part II, additional illustrative records analysed with Wavelets are given.
Appendix
Sample matlab program for eeg signal Processing
load c:\curve.dat ;% The file ‘curve’ is an extract from EEG record using
% graphic digitiser subplot(3,1,1);plot(curve) curve=curve-mean(curve); %plot(abs(fft(curve))) size(curve)
m=size(curve); m1=m(1); m2=fix(m1/10); m3=m1/2
h=linspace(0,m2,200); b=abs(fft(curve)); c=cwt(curve,1:256,’db6');
s u b p l o t ( 3 , 1 , 2 ) ; p l o t ( h , b ( 1 : 2 0 0 ) ) ; x l a b e l (‘Hz’);legend(‘Fourier’)
m=size(curve)
for j(j)=max(c(j,1:m(1))) end =1:32
c1 %plot(c1) [y,i]=max(c1) num2str(i)
legend(num2str(‘i’),4) legend(num2str(i),4) legend(num2str(‘i’),4) jj=num2str(i)
subplot(3,1,3)
plot(c(i,1:m1));xlabel ‘ plot at scale marked on top right’;legend (jj,0)
1. Steven J. Schiff, Hoshua Heller, Steven L. Weinstein, and John Milton, “Controlled Wavelet Transfor ms for EEG Spike and Seizure Localization”, Jl. Of SPIE on Wavelet Applications, 2242: 761 (1994).
2. Elena L. Glassman, “A Wavelet-Like Filter Based on Neuron Action Potentials for
REFERENCES
Analysis of Human Scalp Electroencephalographs”, IEEE transactions on biomedical Engg, 52(11): 1851-1862 (2005).