Nazmi SARITAŞ (Correspondence)
[email protected]
+90 352 2076666 / 43034; Fax +90 352 4379379This article is published under the terms of the Creative Commons Attribution License 4.0 Author(s) retain the copyright of this article. Publication rights with Alkhaer Publications. Published at: http://www.ijsciences.com/pub/issue/2017-04/
DOI: 10.18483/ijSci.1222; Online ISSN: 2305-3925; Print ISSN: 2410-4477
The Effect of a Mixture of Royal Jelly and Honey
on Hematological Parameters in Maximum Weight
Training Athletes
Nazmi Saritaş
1
, Serdar Büyükipekci
1
, Sibel Silici
2
, Selcuk
Mistik
3
, Timucin Atayoğlu
4
1
Erciyes University, Physical Education and Sports College. Kayseri-Turkey 2
Erciyes University, Faculty of Agriculture, Department of Agricultural Biotechnology. Kayseri-Turkey 3
Erciyes University, Medical Faculty, Department of Family Medicine. Kayseri-Turkey 4
American Hospital, Department of Family Medicine. Istanbul-Turkey
Abstract: To investigate the effect of royal jelly (RJ) + honey (H) mixture as nutritional ergogenic aids, on hematological parameters in maximum weight training athletes, 29 volunteer male students were divided as 15 students in the placebo group (Group 1) and 14 students in the study group (Group 2). Corn starch (50 g/day) was given to Group 1, and 5 g RJ + 45 g H mixture (50 g/day) was given to Group 2, for 8 weeks. The parameters of erythrocyte, leukocyte and thrombocyte were evaluated at the beginning, and at the end of 4 and 8 weeks. The volunteers had maximum weight training (for 2 hours/day, 4 days a week). The groups at each time point revealed a significant difference in Mean Cell Hemoglobin Concentration, Leukocyte, Neutrophile, and Platelet Distribution Width values at the end of the first month. No significant difference was found in other comparisons (p>0.05). It was concluded that the differences in some hematological parameters could be related to exercise, and the RJ + H mixture that was given did not demonstrate an adequate effect in the administered amounts and duration. Future studies are needed with higher doses and for a longer duration.
Keywords: Royal Jelly, Honey, Strength Training, hematology
1. Introduction
Weight training exercises are strong stimuli for the neuromuscular system. Such physiological stresses are seen as exercises that are used to increase muscle strength, force, and endurance (Kraemer and Ratamess, 2000). However, exercise produces stress on the human organism. There are several physiological and metabolic effects of stress; one of these is the change that develops in blood (Hazar and Yılmaz, 2008). It was observed that the effects of regular exercise on blood cell levels are different. It is mentioned that these differences depend on the severity, duration, and frequency of the exercise, and the physical and physiological forms of the experimental subjects that are included in the study (Büyükyazı and Turgay 2000).
During the exercise, in particular, systolic blood pressure increases and fluid filtration increases from the arterial side of the capillaries to the space between the tissues (Kardas et al., 1989). Furthermore, as a result of increased metabolism with the exercise,
http://www.ijSciences.com
Volume 6
– April
2017 (04
)
29
in the space between the tissues as a result of increased metabolism and thus the reflux of the fluid to the space between the tissues (Özdengül et al., 1999; Karacabey et al., 2004).
In athletes that adhere to an intense exercise program, characteristically, hemoglobin and hematocrit values decrease, and this situation is also evaluated as athletic anemia (Londeann, 1978)
Carbohydrates are the main constituents of honey, comprising about 95 % of its dry weight. Apart from carbohydrates, honey contains numerous biologically important compounds such as organic acids, proteins, amino acids, minerals, phenolic compounds, vitamins, minerals and aroma compounds. Fructose and glucose monosaccharides are the main sugars of honey. Moreover, honey contains varying amounts of minerals and trace elements. From a nutritional point of view, chromium, manganese and selenium are also important, especially for children of up to 15 years. The biologically important group of the honey is the polyphenols. Those found in honey are mainly flavonoids (e.g. kaempferol, quercetin, luteolin, apigenin, chrysin, galangin), phenolic acids and phenolic acid derivatives (Bogdanov et al. 2000). Royal jelly (RJ) is a widely used health product with perceived benefits. Royal jelly of the honey bee (Apis mellifera L.) is a cream-like substance secreted by young worker bees. The average moisture content of RJ is 60-70 %; its crude proteins total 12-15 %, sugar 10-16 %, lipids 3-6 %, and low molecular weight compounds (i.e. vitamins, salts, and free amino acids) 2-3 % (Takenaka and Echigo 1983; Karaali et al., 1988).
Royal jelly (RJ) is commonly used to supplement for medical treatment of various diseases. RJ is secreted from the hypopharyngeal gland of young worker bees (nurse bees) to feed young larvae and the adult queen bee. It contains proteins, carbohydrates, fats, free amino acids, vitamins (biotin, folic acid, inositol, niacin, pantothenic acid, pyridoxine, riboflavin, thiamine, vitamin E) and minerals (copper, zinc, iron, calcium, manganese, potassium, sodium). RJ also contains bioactive substances including 10-hydroxy-2-decenoic acid, antibacterial proteins, reproductive system development stimulating factor (350-kDa protein) and monocyte stimulating factor (Nagai, 2004).
In the present investigation, the researchers planned to investigate the effects of a royal jelly + honey mixture, which was given to recreational athletes that perform maximum weight exercises, on hematological parameters.
2. Material and Method 2.1.Subject Selection:
Thirty volunteer male students studying at Erciyes University, School of Physical Education and Sports were included in the study. After obtaining written and oral consent from the students, 30 randomly selected healthy volunteer students were divided into two groups and 50 g/day placebo (corn starch) was given to group 1 and 50 g/day (5 g royal jelly + 45 g honey mixture) was given to group 2. After the study began, one student left the experimental group and the study continued with a total of 29 students, with 14 students in the experimental group and 15 students in the placebo group. This study was conducted in accordance with the ethics committee of Erciyes University, Medical Faculty dated 07/08/2012 and numbered 2012/567.
2.2. Weight Exercise.
Following one week of weight adaptation studies, the maximum weights that each subject could lift was determined. The subjects warmed up with 10 minute-running and straining-stretching motions and then were included in the study. The weight lifting sets were composed of bench press, shoulder press, squat, waist traction, and arm contort motions; the weight exercises that were repeated seven times at 80 % of the determined maximum dumb weights for each subject, 5 times at 85 %, 3 times at 90 %, 2 times at 95 %, and once at 100 %. The weight exercises were continued for 2 months at 4 days a week and 2 hours a day, and the subjects rested for 3-5 minutes between the sets and 3 minutes between the series. As part of this program, a pyramidal exercise program was applied to the subjects beginning at 80 % capacity and reaching 100 % capacity, and again down to 80 % capacity.
2.3. Collection of Blood Samples
At pretest (week 0) and at the end of weeks 4 (midtest) and 8 (posttest), blood samples were collected from the volunteer subjects after an overnight fast in the laboratory of Medical Faculty of Erciyes University at 8:00-9:00 in the morning.
2.4. Blood Analyses
Blood samples were collected in 2 cc EDTA vacutainers and Siemens Advia Centaur XP Immunoassay System was used for the tests in the Central Laboratory of the Medical Faculty of Erciyes University.
2.5. Measurement of Body Weight and Height:
http://www.ijSciences.com
Volume 6
– April
2017 (04
)
30
position. Heights were measured with a measuring tape attached to the wall while the patient was barefoot.
2.6. Body Mass Index:
Body Mass Index (BMI) was defined as the individual's body mass divided by the square of their height – with the value universally being given in units of kg/m2.
2.7. Statistical analyses:
The SPSS 16.0 for Windows software package was used for statistical analyses. Values are reported as median (25th-75th percentile).The Mann-Whitney U test was used to compare differences between the groups, the Friedman test was used to analyse statistical changes over time, The Dunn-Bonferroni test was used as post hoc test, and the Shapiro–Wilk test was used for normality; with the level of significance set at P < 0.05.
3. Results
Table 1. Characteristics of the control and experimental groups
Variables Time Placebo (n=15) Experimental (n=14) P*
Median (% 25-75) Median (% 25-75)
Age (Years) Pretest 23 (21-24) 22 (21-22.25) 0.136
Height (cm) Pretest 174 (169-178) 173.5 (170.75-186) 0.469
Body Weight (kg)
Pretest 66.10 (62.20-74.70) 77.25 (65.43-87.60) 0.071 Midtest 66.30 (63-74.30) 78.45 (65.30-85.55) 0.070 Posttest 66.60 (62.10-74.50) 78.80 (66.73-86.20) 0.046
BMI (kg/m2)
Pretest 21.70 (20.80-23.30) 23.25 (21.70-26.63) 0.148 Midtest 21.60 (20.90-23.50) 22.95 (21.38-26.90) 0.142 Posttest 21.50 (21-23.60) 23.40 (21.73-26.53) 0.095 Median (Percentile, 25%-75%), P*Inter-group comparisons
No significant difference was found in characteristics (age, height, body weight, body mass index values) of the subjects within the time and in comparison of groups at each time point (p>0.05).
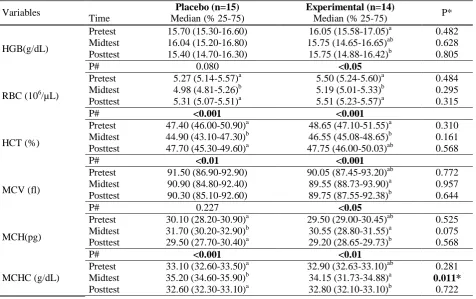
Table 2. Erythrocytic parameters of the placebo and experimental groups
Variables Placebo (n=15) Experimental (n=14) P*
Time Median (% 25-75) Median (% 25-75)
HGB(g/dL)
Pretest 15.70 (15.30-16.60) 16.05 (15.58-17.05)a 0.482
Midtest 16.04 (15.20-16.80) 15.75 (14.65-16.65)ab 0.628
Posttest 15.40 (14.70-16.30) 15.75 (14.88-16.42)b 0.805
P# 0.080 <0.05
RBC (106/µL)
Pretest 5.27 (5.14-5.57)a 5.50 (5.24-5.60)a 0.484
Midtest 4.98 (4.81-5.26)b 5.19 (5.01-5.33)b 0.295
Posttest 5.31 (5.07-5.51)a 5.51 (5.23-5.57)a 0.315
P# <0.001 <0.001
HCT (%)
Pretest 47.40 (46.00-50.90)a 48.65 (47.10-51.55)a 0.310
Midtest 44.90 (43.10-47.30)b 46.55 (45.08-48.65)b 0.161
Posttest 47.70 (45.30-49.60)a 47.75 (46.00-50.03)ab 0.568 P# <0.01 <0.001
MCV (fl)
Pretest 91.50 (86.90-92.90) 90.05 (87.45-93.20)ab 0.772
Midtest 90.90 (84.80-92.40) 89.55 (88.73-93.90)a 0.957
Posttest 90.30 (85.10-92.60) 89.75 (87.55-92.38)b 0.644
P# 0.227 <0.05
MCH(pg)
Pretest 30.10 (28.20-30.90)a 29.50 (29.00-30.45)ab 0.525
Midtest 31.70 (30.20-32.90)b 30.55 (28.80-31.55)a 0.075
Posttest 29.50 (27.70-30.40)a 29.20 (28.65-29.73)b 0.568 P# <0.001 <0.01
MCHC (g/dL)
Pretest 33.10 (32.60-33.50)a 32.90 (32.63-33.10)ab 0.281
Midtest 35.20 (34.60-35.90)b 34.15 (31.73-34.88)a 0.011*
http://www.ijSciences.com
Volume 6
– April
2017 (04
)
31
P# <0.001 <0.05
CHCM(g/dL)
Pretest 34.10 (33.90-35.10)a 34.55 (34.03-35.13)a 0.771
Midtest 34.70 (34.00-35.10)a 34.60 (34.13-34.85)ab 0.889 Posttest 33.90 (33.50-34.90)b 34.40 (33.33-34.75)b 0.940 P# <0.001 <0.05
RDW(%)
Pretest 13.00 (12.70-13.30)a 13.25 (12.98-13.53)a 0.357
Midtest 13.05 (12.90-13.20)a 13.10 (12.90-13.40)a 0.535
Posttest 13.70 (13.40-14.20)b 13.65 (13.30-13.83)b 0.755 P# <0.001 <0.01
HDW(g/dL)
Pretest 2.58 (2.39-2.68) 2.48 (2.41-2.59)a 0.419
Midtest 2.74 (2.55-3.20) 3.00 (2.81-3.17)b 0.221
Posttest 2.65 (2.52-2.73) 2.54 (2.41-2.69)a 0.247
P# 0.076 <0.001
ab: The groups in the same column with different letters are statistically significant (P<0.05). P# Intra-group comparisons, P * Inter-group comparisons, Median (Percentile, 25%-75%),
Red Blood Cells (RBC), Hemoglobin (HGB), Hematocrit (HCT), Mean Red Cell Volume (MCV), Mean Cell Hemoglobin (MCH), Mean Cell Hemoglobin Concentration (MCHC), Red Cell Distribution Width (RDW), Cellular Hemoglobin Concentration Mean (CHCM), Hemoglobin Concentration Distribution Width (HDW).
While a significant decrease in HGB levels (p=0.020) and increase in HDW values (p<0.001) occurred in the experimental group, no significant difference was found within the time and in comparison of groups at each time point (p>0.05). While there was a significant change in RBC, HCT, MCH, CHCM, and RDV values in the placebo and the experimental groups within the time period, no significant difference was found between the groups. While a significant change in the second measurements occurred in MCHC levels in the experimental and placebo groups (p=0.011), no significant difference was found between the groups in the first and third measurements (p>0.05).
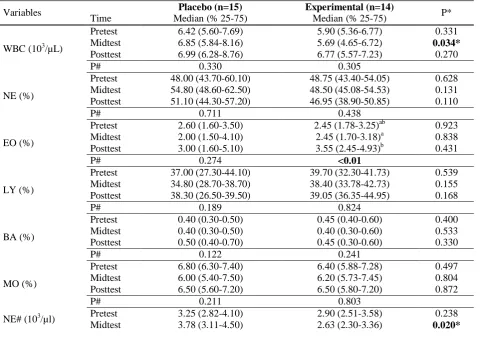
Table 3. Leukocytic parameters of the placebo and experimental groups
Variables Placebo (n=15) Experimental (n=14) P*
Time Median (% 25-75) Median (% 25-75)
WBC (103/µL)
Pretest 6.42 (5.60-7.69) 5.90 (5.36-6.77) 0.331
Midtest 6.85 (5.84-8.16) 5.69 (4.65-6.72) 0.034*
Posttest 6.99 (6.28-8.76) 6.77 (5.57-7.23) 0.270
P# 0.330 0.305
NE (%)
Pretest 48.00 (43.70-60.10) 48.75 (43.40-54.05) 0.628
Midtest 54.80 (48.60-62.50) 48.50 (45.08-54.53) 0.131
Posttest 51.10 (44.30-57.20) 46.95 (38.90-50.85) 0.110
P# 0.711 0.438
EO (%)
Pretest 2.60 (1.60-3.50) 2.45 (1.78-3.25)ab 0.923
Midtest 2.00 (1.50-4.10) 2.45 (1.70-3.18)a 0.838
Posttest 3.00 (1.60-5.10) 3.55 (2.45-4.93)b 0.431
P# 0.274 <0.01
LY (%)
Pretest 37.00 (27.30-44.10) 39.70 (32.30-41.73) 0.539
Midtest 34.80 (28.70-38.70) 38.40 (33.78-42.73) 0.155
Posttest 38.30 (26.50-39.50) 39.05 (36.35-44.95) 0.168
P# 0.189 0.824
BA (%)
Pretest 0.40 (0.30-0.50) 0.45 (0.40-0.60) 0.400
Midtest 0.40 (0.30-0.50) 0.40 (0.30-0.60) 0.533
Posttest 0.50 (0.40-0.70) 0.45 (0.30-0.60) 0.330
P# 0.122 0.241
MO (%)
Pretest 6.80 (6.30-7.40) 6.40 (5.88-7.28) 0.497
Midtest 6.00 (5.40-7.50) 6.20 (5.73-7.45) 0.804
Posttest 6.50 (5.60-7.20) 6.50 (5.80-7.20) 0.872
P# 0.211 0.803
NE# (103/µl) Pretest 3.25 (2.82-4.10) 2.90 (2.51-3.58) 0.238
http://www.ijSciences.com
Volume 6
– April
2017 (04
)
32
Posttest 3.59 (2.78-5.32) 3.21 (2.21-3.57) 0.155
P# 0.106 0.438
LY# (103/µl)
Pretest 2.18 (1.83-2.64) 2.30 (1.97-2.80)ab 0.644
Midtest 2.39 (2.06-2.59) 2.05 (1.77-2.40)a 0.120
Posttest 2.48 (2.19-2.62) 2.44 (2.25-2.85)b 0.628
P# 0.578 <0.01
MO# (103/µl)
Pretest 0.44 (0.39-0.52) 0.42 (0.34-046) 0.246
Midtest 0.46 (0.34-0.51) 0.35 (0.30-0.47) 0.061
Posttest 0.47 (0.33-0.60) 0.42 (0.34-0.50) 0.659
P# 0.711 0.242
EO# (103/µl)
Pretest 0.14 (0.10-0.20) 0.15 (0.10-0.20)ab 0.974
Midtest 0.13 (0.10-0.23) 0.13 (0.09-0.19)a 0.597
Posttest 0.19 (0.14-0.40) 0.24 (0.17-0.29)b 0.788
P# 0.080 <0.01
BA# (103/µl)
Pretest 0.03 (0.02-0.04) 0.030 (0.020-0.033)a 0.790
Midtest 0.03 (0.02-0.04) 0.020 (0.020-0.030)b 0.388
Posttest 0.04 (0.02-0.05) 0.030 (0.028-0.040)a 0.160
P# 0.068 <0.05
ab: The groups in the same column with different letters are statistically significant (P<0.05). P# Intra-group comparisons, P * Inter-group comparisons, Median (Percentile, 25%-75%),
White Blood Cells (WBC), Lymphocyte (LY), Neutrophil (NE), Monocyte (MO), Eosinophil (EO), Basophile (BA).
The comparison of placebo and experimental groups at each time point in terms of leukocytic parameters revealed a significant difference in WBC and neutrophil counts at the second time point (p<0.05); in other comparisons, no significant difference was found (p>0.05). While a significant increase occurred in eosinophil percentage, lymphocyte, and eosinophil and basophil counts, no significant difference was found in other comparisons (p>0.05).
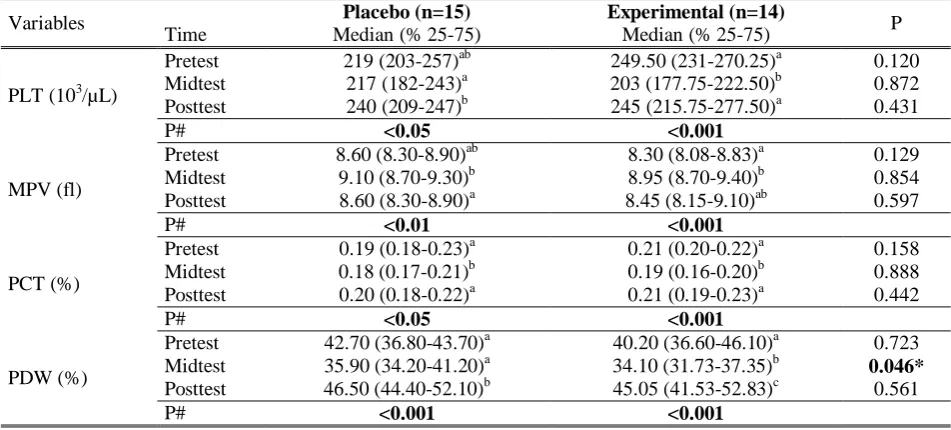
Table 4. Thrombocytic parameters of the placebo and experimental groups.
Variables Placebo (n=15) Experimental (n=14) P
Time Median (% 25-75) Median (% 25-75)
PLT (103/µL)
Pretest 219 (203-257)ab 249.50 (231-270.25)a 0.120
Midtest 217 (182-243)a 203 (177.75-222.50)b 0.872
Posttest 240 (209-247)b 245 (215.75-277.50)a 0.431
P# <0.05 <0.001
MPV (fl)
Pretest 8.60 (8.30-8.90)ab 8.30 (8.08-8.83)a 0.129
Midtest 9.10 (8.70-9.30)b 8.95 (8.70-9.40)b 0.854
Posttest 8.60 (8.30-8.90)a 8.45 (8.15-9.10)ab 0.597
P# <0.01 <0.001
PCT (%)
Pretest 0.19 (0.18-0.23)a 0.21 (0.20-0.22)a 0.158
Midtest 0.18 (0.17-0.21)b 0.19 (0.16-0.20)b 0.888
Posttest 0.20 (0.18-0.22)a 0.21 (0.19-0.23)a 0.442
P# <0.05 <0.001
PDW (%)
Pretest 42.70 (36.80-43.70)a 40.20 (36.60-46.10)a 0.723
Midtest 35.90 (34.20-41.20)a 34.10 (31.73-37.35)b 0.046*
Posttest 46.50 (44.40-52.10)b 45.05 (41.53-52.83)c 0.561
P# <0.001 <0.001
abc: The groups in the same column with different letters are statistically significant (P<0.05). P# Intra-group comparisons, P * Inter-group comparisons, Median (Percentile, 25%-75%),
Platelets (PLT), Mean Platelet Volume (MPV), Plateletcrit (PCT) and Platelet Distribution Width (PDW).
http://www.ijSciences.com
Volume 6
– April
2017 (04
)
33
4. DiscussionIn the present study, a statistically significant increase was observed in RBC values in both placebo and the experimental groups (royal jelly and honey). These increases were within normal reference values. However, no significant difference was observed between the groups (p>0.05). The reason for not observing a difference between groups may arise from the fact that both groups performed the same weight training exercises. According to the results of other similarly conducted studies on the effect of exercise, a significant increase in RBC levels was reported after a step test that was applied to sedentary individuals (Zergeroglu et al., 1999); after a 10 kilometer run (Ercan et al., 1996). In another study, it was reported that acute submaximal exercise significantly increases RBC levels according to the pre-exercise values and this increase is due to plasma loss that is caused by exercise (Londemann, 1978). After a two-week exercise program that was applied to nine sedentary and nine athletes, no significant difference was found in RBC values in either group according to the pre-exercise values (Senturk et al., 2004). The insignificant difference is possibly related to the intensity of the exercises that were performed. As a result of intensive exercise for four weeks, insignificant decreases were observed in RBC parameters (Halson et al., 2003). In the study of Su et al. (2001), as a result of a five-week exercise program that was applied to 16 male and 8 female judoists, they observed a decrease in RBC levels. It is thought that the reason for this decrease might be related to the intensity of loading or the altitude from sea level of the exercise environment (Su et al., 2001). In studies that were performed in Olympic athletes, it was reported that RBC levels are higher in branches in which the endurance feature is dominant and athletes have higher RBC levels according to the sedentary individuals (Spodaryk, 1993). When it is considered that the athletes included in the present study are trained individuals, the researchers can report that the findings of the present study are compatible with the literature.
While a significant decrease occurred in erythrocytic parameters such as HGB levels in the experimental group, there was no difference between the groups. In the study that was performed on long-distance runners as acute exercise, Davidson et al. (1987) found an increase in hemoglobin values after race when compared to the values before the race. Gallagher et al. (2000) investigated the chronic effects of broad interval exercise on male athletes and found a significant increase in hemoglobin levels after eight weeks of chronic exercise (Büyükyazı and Turgay, 2000). Although an increase was observed
following exercises and it was reported that this increase was due to the increase in blood volume (Günay and Cicioğlu, 2001), due to the hypoxic conditions developing during and after exercise, the renal erythropoietin hormone is secreted and hemoglobin production is increased as a result of bone marrow stimulation with erythropoietin to transport oxygen to the tissues. VO2max development in chronic exercises depends on both the increase in hemoglobin amount and the development of oxygen transport ability (Erol et al., 1999). Thus, the significant increase observed in the study of female athletes supports the results as it is parallel to the results from the literature.
There is a characteristic decrease in hematocrit values in athletes who adhere to an intensive exercise program and this situation is evaluated as athletic anemia (Büyükyazı et al., 2002). Similarly, in the present study, while a significant change was found in HCT values in the control and the experimental groups over time, no difference was found between the groups. Similarly there are consistencies and differences with the previous studies. The reason for the difference arises from the fact that it was not mentioned whether these values were within normal reference values or not. The measurements made following six weeks of moderate exercise in sedentary young people (Ersöz et al., 1995), following acute exercise in 32-year-old males, a significant increase was found in HCT levels of the subjects (Wade et al., 1987). A significant increase was found in HCT values following ten days of chronic exercise, which was applied to 10 athletes (Patlar, 2006). On the other hand, there are studies that report that a 20-day camp period that was applied to 25 athletes caused no statistical change in HCT levels (Mashiko et al., 2004), five weeks of exercise that was applied to 16 male and 8 female judoists, a decrease was observed in hematocrit values (Su et al., 2001). Other studies reported that the increase in hematocrit arises from the exercise period and the hematocrit increase caused by exercise could be explained by exercise-induced hemoconcentration, and more importantly, the delivery of blood with high hematocrit levels from the splanchnic circulation to the circulatory system (Günay and Cicioğlu 2001; Günay et al., 2006).
http://www.ijSciences.com
Volume 6
– April
2017 (04
)
34
program were compared, no significant change was observed in MCV, MCH, and MCHC levels (Pouramir et al., 2004). It was indicated that the reason for this is related to the difference in the exercise program. In a study that was performed in 11 (7 male, 4 female) Olympic athletes, blood samples were taken from the subjects before and after the season and no significant change was observed in MCV, MCH, and MCHC parameters (Rietjens et al., 2002). Similarly, 35 male gymnasts were trained in a ten-week exercise program and no significant change could be found in MCV levels of the athletes according to the blood samples taken before and after the program (Pouramir et al., 2004). The determined MCV, MCH, and MCHC values in similar studies are within the normal range of change that is reported in humans (Ganong, 1996; Günay and Cicioğlu 2001; Günay et al., 2006).
In the present study, a statistically significant difference was found in the second measurements of WBC and Neutrophil counts in the control and the experimental groups and this difference was within the normal reference range. In the study group, a significant increase was observed in the eosinophil percentage, lymphocyte, and eosinophil and basophil counts, and again this increase was within the normal reference ranges. In studies investigating the effects of acute exercise on WBC values, they found a significant increase in leukocyte counts during acute exercise (1 minute before the exercise ends) and after exercise in 25-year-old healthy, sedentary individuals (Kappel et al., 1998). In a study that was performed on sedentary individuals, a significant increase was found in leukocyte counts after acute exercise for 60 minutes with a load of 50 pedal/min at 60 % of VO2max (Özdengül et al., 1999).
On the other hand, as a result of acute measurements that were recorded after the marathon, the researchers found significant increases in total leucocyte counts and leukocyte ratios (Suzuki et al., 2003). In another study, as a result of submaximal exercises that were applied to athletes and sedentary men, the increase in leukocyte count in sedentary individuals was found to be significant (Monya et al., 1996). It is reported that leukocytic parameters in girls that play volleyball and participate in athleticism are higher than the children that do not participate in any sport activities (Arslan et al., 1997). It is suggested that short-term exercise until fatigue increases leukocyte counts and this event cannot be explained by the hemoconcentration mechanism, which may be related to the metabolic changes during exercise (Londemann, 1978). On the other hand, in a study investigating the effects of chronic exercise on WBC values that included 14
male and 23 female athletes that performed regular exercise for 12 weeks, no significant change was observed in WBC levels in blood samples before and after 12 weeks (Yeh et al., 2006). In a study that was performed on rugby players, it was reported that leukocyte levels in 19 male rugby players before and after the camp were the same (Banfi et al., 2006).
A significant difference in thrombocytic parameters such as PLT, MPV, PCT, and PDW values was found over time in the control and the experimental groups. Furthermore, in the present study, a significant difference was found between groups for PDW values in the second interval measurement. These differences were found within the normal reference values.
After the chronic exercise was applied to 29 girls that participate in active sports, a significant increase in PLT levels was reported; furthermore, it was found that the girls that participate in sports have higher PLT levels than those that do not participate in any sports (Arslan et al., 1997). After high intensity exercise, many changes occur in metabolism. Moreover, it has been demonstrated by many investigators that there is an increase in thrombocyte count after acute maximum exercise and this increase causes changes in the immunological and hematological parameters (Guyton 1996; Çavuşoğlu 1991; Beydagı et al., 1993).
It is suggested that thrombocyte levels increase and bleeding and coagulation times decrease following submaximal exercise. In studies related to this subject, it has been reported that although the changes in hematological parameters are observed immediately after exercise, these changes return to the resting level within 24 hours following exercise (Beydagi et al., 1993).
Conclusion:
http://www.ijSciences.com
Volume 6
– April
2017 (04
)
35
AcknowledgmentsErciyes University, Research Foundation has supported this research (contract grant number TDK-2012-4162). The authors thank Altiparmak Food.Co. (Istanbul) for their product supports. This study was presented as a poster at KUSS International Conference on Exercise and Movement Sciences 2014 (March 20th-21th 2014) in Bangkok, Thailand.
References
I. Akgün, N. (1996). Egzersiz ve spor fizyolojisi. İzmir: Ege Üniversitesi Basımevi, 1. 5 edition, 69-255 [In Turkish]. II. Arslan, C., Bingölbalı, A., Kutlu, M., & Baltacı, A. K.
(1997). Voleybol ve atletizm sporunun kız çocukların hematolojik ve biyokimyasal parametrelerine etkisi. Bed Eğt Spor Bil Dergisi, 2, 28-34. [In Turkish].
III. Banfi, G., Fabbro, M. D., Mauri, C., Corsi, M. M., & Melegati, G. (2006). Haematological parameters in elite rugby players during a competitive season.Clinical & Laboratory Haematology, 28(3), 183-188.
IV. Beydağı, H., Çoksevim, B., Temoçin, S., & Akar, S. (1993). Akut submaksimal egzersizin spor yapan ve yapmayan kişilerde lökositlere etkisi. Spor Hek Derg,28, 52-62. [In Turkish].
V. Bogdanov, S., Lüllmann, C., Martin, P., von der Ohe, W., Russmann, H., Vorwohl, G., ... & Flamini, C. (1999). Honey quality and international regulatory standards: review by the International Honey Commission. Bee world, 80(2), 61-69. VI. Büyükyazı, G., Kutlu, N., Karadeniz, N., Çabuk, M., Ceylan,
C., Uyanık, B.S., Seven, S.& Özdemir, E. (2002). Kronik aerobik egzersizin orta yaşlı erkeklerde hematolojik parametreler ve lipit profili üzerine etkisi. Spor Hekimligi Dergisi. 37( 4): 51-59 [In Turkish].
VII. Büyükyazı, G. & Turgay, F. (2000). Sürekli ve yaygın interval koşu egzersizlerinin bazı hematolojik parametreler üzerine akut ve kronik etkileri. Spor Hekimliği Dergisi. 35: 103-113 [In Turkish].
VIII. Çavusoglu, H. (1991). Egzersiz ve kan. İstanbul Tıp Fakültesi 11. Kurultayı Bildiri Kitabı. 249 – 252 [In Turkish]. IX. Davidson, R. J. L., Robertson, J. D., Galea, G., & Maughan,
R. J. (1987). Hematological changes associated with marathon running. International journal of sports medicine, 8(01), 19-25.
X. Ercan, M., Bayıroğlu, F., Kale, R., Adak, B., Tuncer, İ., & Tekeoğlu, İ. (1996). Uzun süreli dayanıklılık koşusu kategorisinde gerçekleştirilen bir egzersizin bazı kan parametrelerine etkisi. Spor Hek. Der, 31, 73-80. [In Turkish].
XI. Erol, E., Cicioğlu, İ., & Pulur, A. (1999). 13-14 Yaş Grubu Erkek Basketbolculara Yönelik Dayanıklılık Antrenmanının Vücut Kompozisyonu İle Bazı Fiziksel, Fizyolojik ve Kan Parametreleri Üzerine Etkisi. Gazi Beden Eğitimi Spor Bilimleri Dergisi, 4(4), 12-20. [In Turkish].
XII. Ersöz, G., Köksoy, A., Zergeroğlu, A. M., & Yavuzer, S. (1995). Akut-Kronik Fiziksel Egzersiz ve İmmunglobulinler. Spor bilimleri dergisi, 6(3), 03-12. [In Turkish].
XIII. Gallagher, P.M., Carrithers, J.A., Godard, M.P., Schulze, K.E. & Trappe, S.W. (2000). β-hydroxy-β-methylbutyrate ingestion, Part II: effects on hematology, hepatic and renal function. Medicine & Science In Sports & Exercise. 32: 2116-2119.
XIV. Gannong, W.F. (1996). Tıbbi Fizyoloji. (Çev: Türk Fizyolojik Bilimler Dernegi). Barış Kitabevi. Cilt 1. 17. Baskı. Ankara. [In Turkish].
XV. Günay, M. & Cicioğlu, İ. (2001). Spor Fizyolojisi, Gazi Kitabevi, Baran Ofset, 1.Baskı, Ankara,. [In Turkish].
XVI. Günay, M., Cicioğlu, İ., & Kara, E. (2006). Egzersizde Metabolik ve Isı Adaptasyonu. Gazi Kitap Evi, Ankara.[In Turkish].
XVII. Halson, S. L., Lancaster, G. I., Jeukendrup, A. E., & Gleeson, M. (2003). Immunological responses to overreaching in cyclists. Medicine and science in sports and exercise, 35(5), 854-861.
XVIII. Hazar, S. & Yılmaz, G. (2008). Submaksimal Koşu Bandı Egzersizinin Bağışıklık Sistemine Akut Etkisi. 10th International Sports Science Congress. October, 23-25. Bolu [In Turkish].
XIX. Kappel, M., Poulsen, T. D., Galbo, H., & Pedersen, B. K. (1998). Effects of elevated plasma noradrenaline concentration on the immune system in humans.European journal of applied physiology and occupational physiology, 79(1), 93-98.
XX. Karaali, A., Meydanoǧlu, F., & Eke, D. (1988). Studies on composition, freeze-drying and storage of Turkish royal jelly. Journal of apicultural research, 27(3), 182-185.
XXI. Kardas, Y., Saraymen, R., & Özesmi, Ç. (1989). Egzersizin kan basıncı, nabız ve plazma kalsiyumuna etkileri. Fizyoloji Bülteni 1. s. 235–238 [In Turkish].
XXII. Kraemer, W.J. & Ratamess, N.A. (2000) Physiology of resistance training: current issues. In Orthopaedic Physical Therapy Clinics of North America: Exercise Technologies. Philadelphia: WB Saunders. 467–513
XXIII. Londemann, R. (1978). Low hematocrits during basic training: athlete’s anemia. The New England Journal of Medicine. 299: 1191-1192.
XXIV. Mashiko, T., Umeda, T., Nakaji, S., & Sugawara, K. (2004). Effects of exercise on the physical condition of college rugby players during summer training camp.British journal of sports medicine, 38(2), 186-190.
XXV. Moyna, N. M., Acker, G. R., Weber, K. M., Fulton, J. R., Goss, F. L., Robertson, R. J., & Rabin, B. S. (1996). The effects of incremental submaximal exercise on circulating leukocytes in physically active and sedentary males and females. European journal of applied physiology and occupational physiology,74(3), 211-218.
XXVI. Nagai, T., & Inoue, R. (2004). Preparation and the functional properties of water extract and alkaline extract of royal jelly. Food chemistry, 84(2), 181-186.
XXVII. Özdengül, F., Uysal, H., Gökbel, H., Çelik, İ., & Altındiş, M. (1999). Akut submaksimal egzersizin immun sisteme etkileri. Genel Tıp Dergisi. 9(3): 99-103 [In Turkish]. XXVIII. Patlar, S. (2006). 4 haftalık kronik submaksimal egzersizin
lökosit ve lökosit alt grupları üzerindeki etkisi. 9.Uluslararası Spor Bilimleri Kongresi, Mugla. 226–227 [In Turkish]. XXIX. Pouramir, M., Haghshenas, O., & Sorkhi, H. (2015). Effects
of gymnastic exercise on the body iron status and hematologic profile. Iranian Journal of Medical Sciences, 29(3), 140-141.
XXX. Rietjens, G. J. W. M., Kuipers, H., Hartgens, F., & Keizer, H. A. (2002). Red blood cell profile of elite olympic distance triathletes. A three-year follow-up.International journal of sports medicine, 23(06), 391-396.
XXXI. Senturk, U. K., Yalcin, O., Gunduz, F., Kuru, O., Meiselman, H. J., & Baskurt, O. K. (2005). Effect of antioxidant vitamin treatment on the time course of hematological and hemorheological alterations after an exhausting exercise episode in human subjects. Journal of Applied Physiology, 98(4), 1272-1279.
XXXII. Spodaryk, K. (1993). Haematological and iron-related parameters of male endurance and strength trained athletes. European journal of applied physiology and occupational physiology, 67(1), 66-70.
http://www.ijSciences.com
Volume 6
– April
2017 (04
)
36
XXXIV. Suzuki, K., Nakaji, S., Yamada, M., Liu, Q., Kurakake, S., Okamura, N., ... & Sugawara, K. (2003). Impact of a competitive marathon race on systemic cytokine and neutrophil responses. Medicine and science in sports and exercise, 35(2), 348-355.
XXXV. Takenaka, T., & Echigo, T. (January 01, 1983). Proteins and peptides in royal jelly.Journal of the Agricultural Chemical Society of Japan, 57, 12, 1203-1209.
XXXVI. Wade, C.E., Ramee, S.R., Hunt, M.M., & While, C.J. (1987). Hormonal and renal responses to converting enzyme
inhibition during maximal exercise. Journal of Applied Physiology . 63 (5): 1796-800.
XXXVII. Yeh, S. H., Chuang, H., Lin, L. W., Hsiao, C. Y., & Eng, H. L. (2006). Regular tai chi chuan exercise enhances functional mobility and CD4CD25 regulatory T cells. British journal of sports medicine, 40(3), 239-243.
XXXVIII. Zergeroglu, A.M., Ersöz, G., & Yavuzer, S. (1999). Sedanter erkeklerde supramaksimal ve basamaklı egzersizlerde eritrosit antioksidan enzim aktivitesi. Spor Hekimliği Dergisi.