Marta Wesoła
a–d, artur Lipiński
a, f, Michał Jeleń
e, fMorphometry in the Cytological Diagnosis
of Cervical Smears
department of Pathomorphology and Oncological Cytology, Wroclaw Medical University, Poland
A – research concept and design; B – collection and/or assembly of data; C – data analysis and interpretation;
D – writing the article; E – critical revision of the article; F – final approval of article; G – other
Abstract
Background. Morphometry of cells found in normal and abnormal smears taken from the vagina and the uterine cervix is the assessment of the size and diameter of their nuclei. The values of these quantities provide information on the origin of these cells and the degree of possible anomalies. determining the morphometric traits of different types of cells found in the cervix and the uterus is a very important element in the diagnosis of disorders that often lead to cervical tumors.
Objectives.The aim of this research is to determine the morphometric characteristics of cells found in cervical smears by measuring the cell circumference, the diameter of the nucleus and the cell surface areain order to identify which clinical group the cells belong to, which facilitates diagnosis.
Material and Methods.The study material consisted of cervical smearsthat demonstrated the presence of cells in various phases of the clinical Bethesda classification. for each clinical classification, the values of the cell circumfer-ence, the cell surface area and thediameter of the nucleus were measured for 100 cells.
Results.The largest cells are normal cells in the surface layer. In relation to these cells, the atrophic cells fromthe groups containing atypical squamous cells of undetermined significance (aSC-US), low-grade squamous intraepi-thelial lesions (LSIL), high-grade squamous intraepiintraepi-thelial lesion (HSIL) and tumor cells tend to decrease in size, with small variations. Considering the mean values of the parameters analyzed, the cells of the LSIL group are larger than those from the aSC-US group. according to the mean values, normal cells have the smallest nucleusand the HSIL cells and tumor cells have the largest.
Conclusions.The statistical analysis shows significant differences between the morphometric traits in the different clinical groups, which indicates that morphometry can be used in cytological diagnosis (Adv Clin Exp Med 2014, 23, 2, 289–293).
Key words: morphometry, vaginal smears, cytodiagnosis, cervix uteri.
adv Clin exp Med 2014, 23, 2, 289–293 ISSN 1899–5276
ORIGINaL PaPeRS
© Copyright by Wroclaw Medical University
Morphometry of cells found in normal and abnormal smears taken from the vagina and the uterine cervix is an assessment of the size and di-ameter of their nuclei. The values of these quan-tities provide information on the origin of these cells and the degree of possible anomalies. de-termining the morphometric traits of different types of cells found in the cervix and the uter-us is a very important element in the diagno-sis of disorders that often lead to cervical tumors. However, there are also other important factors in diagnosis, such as the cell system in the smear, the total number of cells, the number of nuclei, the number of nucleoli and chromatin placement in the nucleus. The presence of cells with specific
characteristics indicates the clinical changes in-volved. The Bethesda System is the most common-ly recommended classification system for cytologi-cal smears; it reflects the most current knowledge about irregularities in cervical smearsand is asso-ciated with new technologies for diagnostic testing that have emerged in the last decade [1–3].
Material and Methods
Material
and Oncological Cytology at the Wroclaw Medi-cal Univerisity, Poland. Smears from different clin-ical groups were tested: normal smears, where the superficial cells and glandular cells were evaluated separately; smears showing the presence of atrophic cells; smears with atypical squamous cells of unde-termined significance (aSC-US); smears with low-grade squamous intraepithelial lesions (LSIL) and high-grade squamous intraepithelial lesions (HSIL); and smears showing the presence of cervical tumors. In addition to these cell groups, atrophic cells (atro-phic cells occur in smearsin which there is a lack of superficial cells) were also assessed. In some hor-monal states, where there is a decrease in estrogen production in the body, cells of the intermediate and by-base layers are observed in the smear. The presence of greater or lesser numbers of polymor-phonuclear neutrophil granulocytes is a character-istic feature of these hormonal states as well [4, 5]. The smears were tinted using the He and the Pa-panicolaou methods. The study measured 100 cells for each of the stages in the Bethesda System.
Methods
The assessment of morphometric feature was done using the dotSlide system (Olympus,
Poland). Using this imaging system, the cell cir-cumferences, the cell surface area and diame-ter of the nuclei from each group were measured. The dotSlide system is not only a digital virtu-al microscope, but virtu-also an imaging system used in “virtual microscopy” – the digital equivalent of a conventional optical microscopy [6].
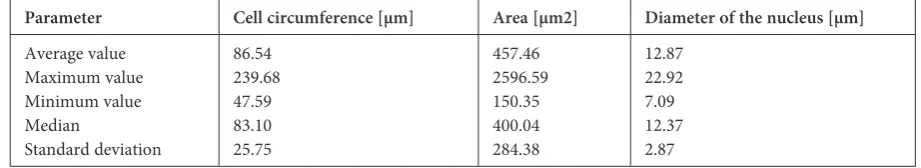
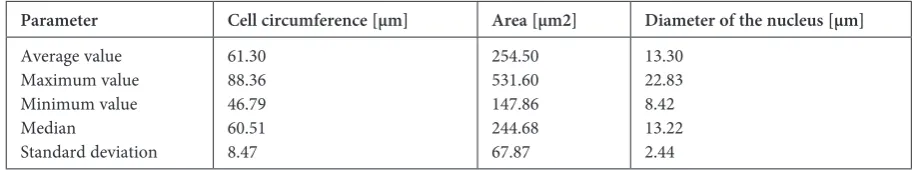
for normal cells, atrophic cells, groups of cells with aSC-US, LSIL and HSIL and tumor cells, the following statistical parameters were calculated for each of the 3 attributes (the cell surface area, cell circumference and the diameter of the nucleus): the average value, the minimum and maximum values, the median and standard deviation. These parameters are presented in Tables 1–6.
Statistical Analysis
of Test Results
STaTISTICa 9 software (StatSoft, Tulsa, USa) was used applied to perform the statistical analy-sis. In order to check whether there are statistical-ly significant differences, it was necessary to check whether the distributions are normal or abnormal. The Shapiro-Wilk test was performed. Next, anon-parametric Kruskal-Wallis aNOVa was carried
Table 1. Test results for normal smear (superficial cells)
Parameter Cell circumference [µm] Area [µm2] Diameter of the nucleus [µm]
average value Maximum value Minimum value Median
Standard deviation
195.27 270.84 124.08 194.66 32.95
2382.16 4648.95 1027.16 2324.37 794.67
8.48 14.11 4.55 8.73 2.00
Table 2. Test results for atrophic cells
Parameter Cell circumference [µm] Area [µm2] Diameter of the nucleus [µm]
average value Maximum value Minimum value Median
Standard deviation
105.68 192.54 52.28 101.46 33.41
768.40 2125.88 151.31 643.58 468.10
8.98 12.82 3.05 9.11 1.91
Table 3. Test results for aSC-US
Parameter Cell circumference [µm] Area [µm2] Diameter of the nucleus [µm]
average value Maximum value Minimum value Median
Standard deviation
86.54 239.68 47.59 83.10 25.75
457.46 2596.59 150.35 400.04 284.38
out to determine the presence or absent of differ-ences among the groups. The level of statistical sig-nificance was α = 0.05.
Results
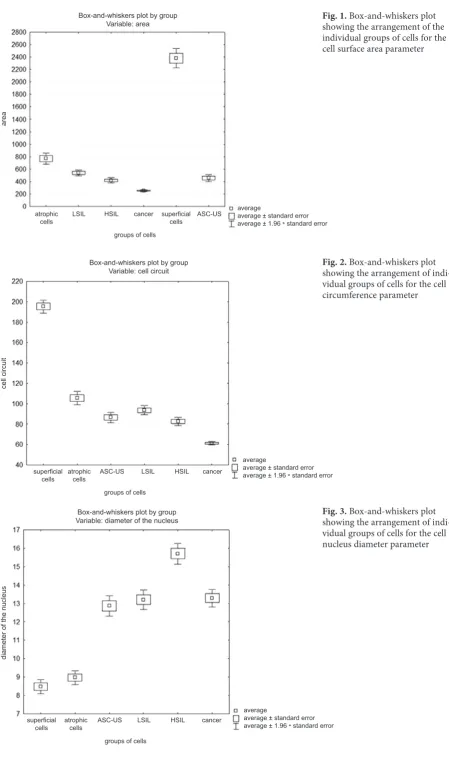
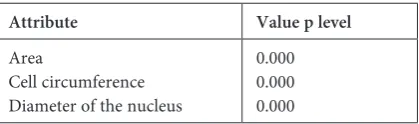
The Shapiro-Wilk test showed that for the cell surface area, each group was characterized by a normal distribution. for the cell circumference, the analysis showed that only the group of superfi-cial cells had normal distribution. for the diameter of the nucleus, only the atrophic and LSIL groups had normal distribution. Based on the values calcu-lated in the non-parametric Kruskal-Wallis aNO-Va (the result for each attribute is p < 0.001 [Ta-ble 7]) and the box-and-whiskers plot (fig. 1–3) it can be concluded that there are statistically signif-icant differences between the groups. On the basis of the measurements and the statistical analysis, it can be seen that the largest measured cells are the superficial cells; the atrophic cells are smaller than the normal ones. The average, maximum, mini-mum and median values show that the diameter of the nuclei of cells derived from the aSC-US group is larger than the nuclei of normal cells. The wide range of cells and of cell nucleus sizes can confirm
the presence of anomaliesin the aSC-US group. Large variations in the values of the area of the cells are also seen in the group of LSIL cells. HSIL cells are characterized by a small size compared to nor-mal cells anda nucleus forming 3/4 of the cell area. Tumor cells are the smallest cells among the cell groups measured.
Discussion
Based on the statistical analysis, it can be con-cluded that all the groups differ from each other enough to permit the use of their morphometric characteristics for diagnostic purposes. Taking in-to account the cell area, superficial cells from the normal group had a much larger area than all the other groups, so they can easily be distinguished. atrophic cells differ significantly from superficial cells, but are similar in area to cells from the aSC- -US group. The other parameters – the cell cir-cumference and the diameter of the nucleus – can also be used. The differences in the values of the cell circumference are not very large, but aSC-US cells have larger nuclei than atrophic cells. a sim-ilar situation can be seen in the case of atrophic cells compared to both LSIL and HSIL cells. The
Table 4. Test results for LSIL
Parameter Cell circumference [µm] Area [µm2] Diameter of the nucleus [µm]
average value Maximum value Minimum value Median
Standard deviation
93.69 156.57 52.78 90.65 22.81
539.55 1292.86 181.10 496.03 245.56
13.21 20.77 7.03 13.21 2.71
Table 5. Test results for HSIL
Parameter Cell circumference [µm] Area [µm2] Diameter of the nucleus [µm]
average value Maximum value Minimum value Median
Standard deviation
82.61 149.02 49.03 79.25 21.59
421.62 1299.28 163.39 362.92 207.78
15.71 26.51 9.84 15.41 2.90
Table 6. Test results for tumor cells
Parameter Cell circumference [µm] Area [µm2] Diameter of the nucleus [µm]
average value Maximum value Minimum value Median
Standard deviation
61.30 88.36 46.79 60.51 8.47
254.50 531.60 147.86 244.68 67.87
atrophic cells
groups of cells LSIL
Box-and-whiskers plot by group Variable: area
HSIL
area
cancer average average ± standard error average ± 1.96 * standard error superficial
cells ASC-US
Fig. 1. Box-and-whiskers plot showing the arrangement of the individual groups of cells for the cell surface area parameter
atrophic cells
groups of cells LSIL
Box-and-whiskers plot by group Variable: cell circuit
HSIL
cell circuit
cancer
average
average ± standard error average ± 1.96 * standard error superficial
cells ASC-US
Fig. 2. Box-and-whiskers plot showing the arrangement of indi-vidual groups of cells for the cell circumference parameter
atrophic cells
groups of cells LSIL
Box-and-whiskers plot by group Variable: diameter of the nucleus
HSIL
diameter of the nucleus
cancer
average
average ± standard error average ± 1.96 * standard error superficial
cells ASC-US
differences between these 2 groups can be seen on-ly in the diameters of the nuclei. The last group to be compared with atrophic cells is the group of tu-mor cells. Based on the values obtained, each of the morphometric features can be used to differ-entiate these 2 groups. Comparingthe aSC-US and LSIL groups, it can be seen that the areas of these groups of cells are too similar to each other to al-low their differentiation on this basis alone. Cells from these groups have similar nucleus diameters and cell circumferences, so the authors believe that their morphological characteristics need to be tak-en into consideration as well. To compare aSC-US cells and HSIL cells, the best parameter to dif-ferentiate them is the nucleus diameter, which is
larger in the HSIL group, where they cover more than 3/4 of the cell area. Tumor cells can be dis-tinguished from aSC-US cells using both the ar-ea and the cell circumference. as expected, the re-sults for the LSIL and HSIL cells groups show that the values of the circumference and area of these groups are very similar; the difference can be seen in the diameter of the nucleus, which is significant-ly larger in the HSIL group. Tumor cells are much smaller in size than LSIL cells, and smaller than HSIL cells; in terms of area, tumor cells are half the size of HSIL cells.The diameter of the nucleus is smaller in tumor cells.
The results of the tests show that there are many differences between the various groups of cells. This is confirmed by the statistical analysis as well. The cells belonging to each group of cyto-logical changes can be identified on the basis of the morphometric characteristics measured, and this can be applied in diagnostic cytology. However, in some cases, these measurements do not give an unambiguous answer to the question which cyto-logical changes are involved. The help of a skilled cytologist is still needed to dispel all doubts.
Table 7. Comparison of the cell groups by attribute: aNOVa rankKruskal-Wallis test results
Attribute Value p level
area
Cell circumference diameter of the nucleus
0.000 0.000 0.000
References
Apgar BS, Zoschnick L, Wright TC, Jr:
[1] The 2001 Bethesda System terminology. am. fam. Physician 2003; 68:
1992–1998.
Solomon D, Davey D, Kurman R, Moriarty A, O’Connor D, Prey M, Raab S, Sherman M, Wilbur D, Wright [2]
T, Jr, Young N: The 2001 Bethesda System: terminology for reporting results of cervical cytology. JaMa 2002; 287: 2114–2119.
Kurman RJ, Solomon D:
[3] The Bethesda system for reporting cervical/vaginal cytologic diagnoses. New York, NY,
Springer-Verlag, 1994.
Malarewicz A, Szymkiewicz J:
[4] Cytological tests of cervical in postmenopausal women. Menopause overview. 2004;
4: 31–34.
http://www.kobiety.lekarka.pl/badanie-cytologiczne/kobiety/; (05.04.2012)
[5]
http://www.microscopy.olympus.eu/microscopes/Life_Science_Microscopes_dotSlide_-_Virtual_Slide_System.
[6]
htm; (5.04.2012)
Address for correspondence
Marta Wesoładepartment of Pathomorphology and Oncological Cytology Wroclaw Medical University
00-000 Wrocław Marcinkowskiego 1 Poland
Tel: +48 797 117 461
e-mail: [email protected]
Conflict of interest: None declared