International Doctorate School in Information and Communication Technologies
DIT - University of Trento
A high performance computational
environment for UHTS studies.
Silvano Paoli
Advisor:
Dr. Cesare Furlanello
Fondazione Bruno Kessler
This work regards the use of high performance computing (HPC) meth-ods for a new bioinformatics challenge: the analysis of Terabyte-size data generated by the newultra high throughput sequencing (UHTS) technology. As in microarray or mass spectrometry cases, public repositories are growing to store data from the next generation studies produced in labo-ratories around the world. These can be used to access to a large number of samples from experiments with different individuals, populations and sequencing platforms. Also experimental data of scientific articles are pub-lished in these stores, enabling to repeat and verify their results (repro-ducibility).
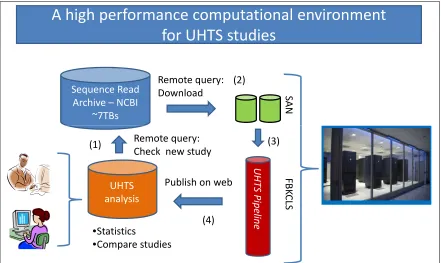
An automatic downloader and analyzer system (D-Daemons architec-ture) is proposed to interface to a public repository of sequence reads, select all the experiments that match some research parameters, defined by a user, download them and apply an analysis pipeline to evidence their similarity or variability. A software pipeline based on this architecture and operating in a HPC environment has been developed to analyze the down-loaded UHTS files in the shortest time possible. A case study of the system on “Colorectal Cancer (CRC) cell line” datasets and an aligner selection in a SNP discovery task on three RNA-Seq datasets (Human Breast tissue and of BT474 & MCF7 cell lines) are presented.
Keywords
Sequence Read Archive – NCBI
~7TBs
S
A
N
Remote query: Download
UHTS analysis
F
B
K
C
LS
•Statistics
•Compare studies
U
H
T
S
P
ip
e
lin
e
Publish on web Remote query: Check new study
The automatic downloader and analyzer system.
1 Introduction 1
1.1 The Context . . . 1
1.2 Next generation sequencing . . . 1
1.3 A novel automated pipeline . . . 7
1.4 Innovative Aspects . . . 9
1.5 Structure of the Thesis . . . 9
2 State of the Art 11 2.1 Transcriptomics . . . 11
2.2 Advanced software tools . . . 13
2.2.1 Erange . . . 13
2.2.2 Bowtie . . . 14
2.2.3 BWA . . . 16
2.2.4 Tophat . . . 16
2.2.5 SAMtools . . . 18
2.2.6 Cufflinks . . . 19
2.2.7 Crossbow . . . 20
2.2.8 Genome Browser . . . 21
2.2.9 Galaxy . . . 21
2.2.10 SRA . . . 22
3.3 The D-Daemons architecture . . . 29
3.4 The HPC pipeline . . . 34
3.5 SRA structure . . . 36
3.6 Integration in Galaxy . . . 39
3.7 Test environment . . . 43
3.8 The CRC case study . . . 43
4 Aligner selection in a NGS pipeline 53 4.1 Aligner comparison . . . 53
4.2 Candidate selection . . . 76
5 Pipelines for reproducibility 79 5.1 A grid-enabled example . . . 79
5.2 A Design Analysis Protocol . . . 82
6 Comparison with existing frameworks 85 6.1 miRMaid . . . 85
6.2 Metagenomic pipeline . . . 87
6.3 mGene.web . . . 88
7 Conclusions 91 7.1 Overview . . . 91
7.2 Innovative features . . . 93
7.3 Improvements . . . 93
7.4 Future work . . . 95
Bibliography 97
A Academic and technical papers by the candidate 103
1.1 Example of read lengths in UHTS platforms. . . 2
4.1 Scalability (in seconds) on Breast sample with merged lanes. 58 4.2 Scalability (in seconds) on Breast sample with separated lanes. 59 4.3 Scalability (in seconds) on BT474 sample with merged lanes. 60 4.4 Scalability (in seconds) on BT474 sample with separated lanes. 61 4.5 Scalability (in seconds) on MCF7 sample with merged lanes. 62 4.6 Scalability (in seconds) on MCF7 sample with separated lanes. 64 4.7 Memory usage (in GB) on BT474 sample with merged lanes. 64 4.8 Memory usage (in GB) on BT474 sample with separated lanes. 65 4.9 Memory usage (in GB) on MCF7 sample with merged lanes. 66 4.10 Memory usage (in GB) on MCF7 sample with separated lanes. 67 4.11 Memory usage (in GB) on Breast sample with merged lanes. 68 4.12 Memory usage (in GB) on Breast sample with separated lanes. 68 4.13 Uniquely mapped reads and allowed mismatches. The total
mapped reads expressed as percentage of the overall number
of raw reads in each dataset. . . 69
6.1 Tools of the “Metagenomic analyses”. . . 88
2.1 Example of alignments in Genome Browser from RNA-Seq Cerebellum (human) Illumina 35bp sample [1] over the HG18
reference genome . . . 21
3.1 System description. . . 29 3.2 D-Daemons architecture. . . 31 3.3 The Galaxy main page and on the left the toolbar with the
D-Daemons menu. . . 41 3.4 A workflow based on elements of the D-Daemons architecture 42 3.5 Main result page for experiment SRX012945. . . 45 3.6 Main result page for experiment SRX012946. . . 46
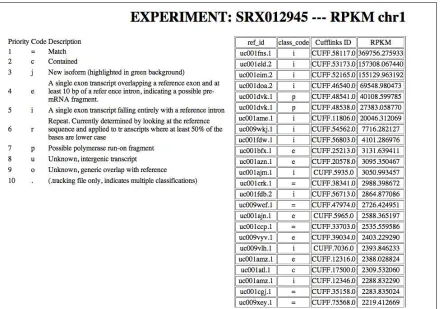
3.7 Chromosome 1 result page for experiment SRX012945. . . 47
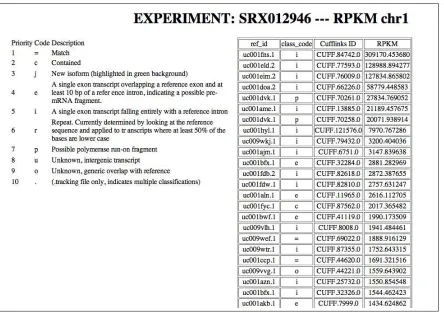
3.8 Chromosome 1 result page for experiment SRX012946. . . 47
3.9 RPKM values for Chromosome 1 experiment SRX012945. . 48
3.10 RPKM values for Chromosome 1 experiment SRX012946. . 49
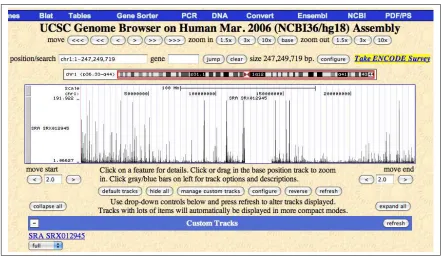
3.11 Alignments on chromosome 1 for experiment SRX012945
visualized in the UCSC Genome Browser. . . 50 3.12 Alignments on chromosome 1 for experiment SRX012946
visualized in the UCSC Genome Browser. . . 51
4.1 Scalability comparison of Bowtie and BWA on merged lanes
of Breast sample. . . 58
4.3 Scalability comparison of Bowtie and BWA on merged lanes
of BT474 sample. . . 60 4.4 Scalability comparison of Bowtie and BWA on separated
lanes of BT474 sample. . . 61 4.5 Scalability comparison of Bowtie and BWA on merged lanes
of MCF7 sample. . . 62 4.6 Scalability comparison of Bowtie and BWA on separated
lanes of MCF7 sample. . . 63 4.7 Memory usage comparison of Bowtie and BWA on merged
lanes of BT474 sample. . . 65 4.8 Memory usage comparison of Bowtie and BWA on merged
lanes of MCF7 sample. . . 66 4.9 Memory usage comparison of Bowtie and BWA on merged
lanes of Breast sample. . . 67 4.10 Comparison of uniquely mapped reads stratified by the
num-ber of allowed mismatches . . . 69 4.11 Distribution of single base mismatches (merged lanes). . . 70 4.12 Distribution of single base mismatches (merged lanes). . . 71 4.13 Distribution of single base mismatches (separated lanes). . 72 4.14 Distribution of single base mismatches (separated lanes). . 73 4.15 Coverage of alignment with Bwa on SPARC, ATOX1 and
G3BP1 genes. . . 74 4.16 Coverage of alignment with Bowtie/Tophat on SPARC, ATOX1
and G3BP1 genes. . . 75
5.1 The architecture of the MSAnalyzer and BioDCV tools. . . 81 5.2 A workflow for proteomic profiling. . . 83
Introduction
1.1
The Context
High-Performance Computing (HPC) is the discipline of using supercom-puters, computer clusters, and special purpose computational systems to solve problems that require high processing capacity, and in particular speed of calculation. HPC methods have been systematically employed for the analysis of huge volumes of data generated in bioinformatics tasks. In particular, the use of HPC has been the heart of the Human Genome Project, i.e. the sequencing of the human genome (1990-2000), whose goal was to determine the sequence of chemical base pairs defining the DNA. HPC facilities based on supercomputers allowed to complete the sequenc-ing and assembly of the about 3 billion bases of the genetic code.
This thesis regards the use of HPC methods for a new bioinformatics challenge: the analysis of Terabyte-size data generated by the new ultra high throughput sequencing (UHTS) technology.
1.2
Next generation sequencing
DNA sequencing methods are the keystones of basic biological research and of most molecular medicine studies. They include all the sequencing
methods for revealing the order of the nucleotide bases (adenine, guanine, cytosine, and thymine) in a molecule of DNA. The chemical sequencing (also known as Maxam-Gilbert sequencing) introduced the first generation of methods in 1977. Very soon the alternative technology of chain termi-nator sequencing or Sanger sequencing was developed by Frederick Sanger, Nobel Prize in 1980, allowing sequence length sequence length of 800-1000 nucleotide bases (or base pair long: bp) through several hours of chemical reactions. Since the Sanger method is relatively simple and cheap, so it is still widely used for small-scale experiments. In recent years, great ef-forts have been spent to improve the efficiency of DNA sequencing. Next generation sequencing (NGS) technologies have upgraded first with large scale methods and more recently with a new group of methods (ultra high throughput sequencing - UHTS) designed to parallelize the process and pro-duce from thousands to billions of short reads at once, ranging from tens to one-two hundred base pairs.
Different sequencing platforms are available. Solexa Illumina, SOLiD and Roche 454 are the major of next generation sequencing technologies used in UHTS studies.
Vendor Platform Read Length
Illumina Genome Analyzer IIx, IIe 35,50,75,100 bp
HiSeq 2000 35,50,100 bp
Roche 454 GS FLX 200-300 bp
454 GS FLX Titanium 400 bp
Applied Biosystem SOLiD 3 System 50 bp
SOLiD 4 System 50-100 bp
Helicos HeliScope 25-55 bp
RNA-Seq analysis
The possibility to produce millions of sequences from a sample provides different methods to better understand the pathways involved in biological processes, e.g. the interactions between genes and proteins. Based on modern sequencing methods, the UHTS transcriptome analysis allows a low level survey of the produced gene activity in a cell. The transcriptome is the set of all RNA (mRNA, rRNA, tRNA, ncRNA) (see Section 2.1) molecules (also called “transcripts”) produced in a cell. While the genome is roughly stable in cells, the transcriptome can vary during life due to a number of factors. Because it includes all transcripted mRNA in the cell, the transcriptome reflects the genes that are actively expressed at a one given time. Transcriptomics examines the expression level of mRNAs in a given cell population. RNA-Seq is an approach to study the transcriptome level on a biological sample using UHTS technologies.
In general a RNA-Seq experiment includes the following steps. First, one sample is sequenced by an UHTS machine. Then, the resulting short reads have to be compared with a reference genome sequence of the sam-ple’s species under investigation. In a reference genome, an organism is described through chains of nucleotide bases which form each chromosome. Each short read is compared to the chains in the reference genome. This search tries to find regions in chromosome sequences where a short read’s nucleotide base sequence matches. The comparison is performed by look-ing at each nucleotide base in the reference genome with the succession of bases in the short reads.
[2]). The positions of genes on chromosomes sequences allow us to check if a short read falls within these regions. If more than one short read falls on the region corresponding to one gene, we can suppose that this gene is expressed in the studied tissue, according to the association between the messenger RNAs (sequenced in short reads) and the gene. The number of short reads aligned over the coordinates of a gene gives a measure of the expression level of this gene. A peak of several short reads over a gene region shows that this gene is heavily expressed. Although the knowledge of the entire human genome is incomplete, the RNA-Seq analysis can then help to fill the gaps of knowledge, because pile of short reads in a position of a chromosome where no known gene occurs can encourage to investigate existence of a new element, while a short read stack over the boundaries of a gene’s region addresses to rethink to the real distribution of this gene in the chromosome at least in terms of individual variability. Furthermore, this detailed knowledge can be used for functional genomics, replicating in the UHTS framework all the signal evaluation until now provided in high throughput by array technologies. This thesis aims to provide new computational tools to automate the RNA-seq analysis in a wide range of problems such as more briefly introduced in this section.
Software tools for UHTS studies
and to perform statistics of where, how and how many reads fall on genes and chromosomes in genome. In a RNA-Seq experiment applied on human tissue, million of reads can be sequenced and have to be aligned to a human reference genome. Each read and the reference genome are considered as strings of characters in the computer’s memory; each string is composed by long combinations of four letters (A,C,G,T), which represent the four nucleotide bases (A=adenine, C=cytosine, G=guanine and T=thymine). While short reads have length of tens or hundreds of characters, a reference genome is described by millions or billions of characters. For example, the human reference genome HG18 ( [2]) has more than 3 billions of bases. The alignment phase of short reads on a reference genome is translated in a computer science task called string matching problem. The first step is to find a place where one or several strings (short reads) are found within a larger string (reference genome). Several string searching algorithms [3] were developed in computer science. The first generation of sequence alignment tools were based on hashing, but the enormous memory require-ments for the hash table was a major drawback. The following generation of alignment programs uses the Burrows Wheeler Transform (BWT) [3] to efficiently align short sequencing reads against a large reference sequence such as the human genome. Programs of the first generation include Eland (a module within the Illumina software suit, provided as free source code for Illumina’s machine buyers), SOAP [4] (freeware) or MAQ [5] (Open Source code). Examples of new generation Open Source programs are Bowtie [3] and BWA [6], while SOAP2 [7] is freeware.
which takes part in the composition of the coding sequence used to build a protein. An intron is a DNA section within a gene that is not translated into a protein. Each gene has a variable number of introns and exons (inside its interval on chromosome). Knowing how many reads fall into exon zones allows one to understand the RNA splicing in a gene. This is a mechanism in the transcription phase to create the final RNA code from the gene’s DNA sequence, which will be used to produce a protein. Here, the gene’s exons are recombined and joined together to produce the RNA code. Another key goal is to find statistically significant peaks of short reads to examine interesting zones on chromosomes. The expression level of a gene can be weighed through the RPKM measure, i.e. reads per (kilo)base per number of mapped reads. A single nucleotide polymorphism (SNP) detection can be performed on mapped short reads. A SNP is a single base pair mutation at a specific location of a gene or a DNA sequence on a chromosome. It allows a measure of the genetic variation between samples, specifically in a set of disease and normal samples from the same tissue. Open Source programs as TopHat [8] and Erange [9] can perform some of the previous analysis, given a set of aligned short reads. A complete RNA-Seq experiment requires both an alignment and a post-processing alignment phase. In almost all cases, more than one software has to be applied to obtain a complete result.
Public repositories of UHTS data
bench-mark software tools. One example of these new repositories is the Sequence Read Archive (SRA) [10]. The National Center for Biotechnology Informa-tion (NCBI) maintains the SRA as a repository for data from sequencing projects that use the new massively parallel sequencing technologies. The Sequence Read Archive will become more and more important as next gen-eration sequencing technologies continue to improve and become even less expensive. The SRA accepts and presents data from all current next gener-ation sequencing platforms including 454, Illumina, SOLiD, HeliScope, and Complete Genomics. Individual read lengths vary from around 25 bases to more than 400 bases depending on the platform. Data can include se-quence, quality scores, color values, and intensity graphs depending on the platform involved.
1.3
A novel automated pipeline
standard workstation.
The proposed solution is to select the state-of-art software in UHTS studies, order them in a workflow and run it in a High Performance Com-puting environment.
High Performance Computing is normally obtained by deploying envi-ronments endowed with large numbers of CPUs, in which a serial software can be split in several instances simultaneously run to reduce the compu-tational time. Heavy compucompu-tational tasks can be efficiently managed on HPC systems, initially implemented through large machines with exotic architectures. Modern HPC facilities are based on the concept of cluster computing, that is a group of linked workstations (also called nodes) which work together. The current multi-core architectures in CPU technology further helps to add computing power within limited space, thus allowing to a huge number of elaboration cores to be setup in the computing en-vironment. In HPC facilities, a further key element is the queue system that coordinates users and allows the distribution of users’ programs on available computational nodes.
1.4
Innovative Aspects
This thesis aims to combine state-of-art Open Source Software used in RNA-Seq studies and to develop a new HPC-based platform that may greatly accelerate the overall performance. Differences and causes of vari-ability in the process have been considered to select the best elements for a pipeline of software tools and to guarantee the following features:
1. This pipeline should reach the maximum productivity in the analysis of up to 100 samples, each one consisting of millions of short reads.
2. The pipeline should be designed to operate on High Performance Fa-cilities (HPC), as cluster computers, to parallelize and speed-up dif-ferent steps. A particular attention has been dedicated at evaluating and modifying software tools compatible with a HPC environment.
3. Standard measures, statistics and formats applied to raw sequences and alignment results are considered.
4. Finally, the possibility to insert the proposed pipeline in an automatic download system from the SRA repository is examined under the ar-chitecture point-of-view.
1.5
Structure of the Thesis
The rest of this thesis is composed the following chapters:
Chapter 2 presents some basic definitions in UHTS and RNA-Seq con-texts, describes analysis steps in a standard study and reports the state-of-art Open Source Software used in an ultra high throughput sequencing investigation;
Chapter 4 gives some experimental results on components of an analysis pipeline;
Chapter 5 presents the issue of reproducibility, providing two examples of analysis through proteomics pipelines;
Chapter 6 provide a review of related work;
Chapter 7 summarizes the problem and solution and discusses possible developments of the presented work.
State of the Art
2.1
Transcriptomics
In life forms the operations in a cell are driven by the proteins. These are essential parts of organisms and participate in virtually every process within cells. How the proteins work is the key to understand the evolu-tion steps in a cell during its life cycle. This comprehension includes the cell’s behaviors when a disease attacks an organism, in particular this in-formation can help to understand serious diseases like cancers and tumors. The proteins are complex objects and the study of their interactions is not a simple task. The central dogma of the molecular biology shows an alternative way to understand these processes in a cell. It states that in synthesizing proteins, DNA is transcribed into mRNA, which is translated into proteins. So, in place of investigating the proteins directly, it is pos-sible to study the mRNA and the genes, where these chains of nucleotide are transcribed, involved in the synthesis process.
The transcriptome is the set of all RNA molecules, including mRNA, rRNA, tRNA 1, and non-coding RNA produced in one or a population of cells. The term can be applied to the total set of transcripts in a given organism, or to the specific subset of transcripts present in a particular
1
Ribonucleic acid (RNA), Messenger ribonucleic acid (mRNA), Transfer ribonucleic acid (tRNA).
cell type. Unlike the genome, which is roughly fixed for a given cell line (excluding mutations), the transcriptome can vary with external environ-mental conditions. Since it includes all mRNA transcripts in the cell, the transcriptome reflects the genes that are being actively expressed at any given time. Expression profiling is referred to studies of transcriptomics where the expression level of mRNAs in a given cell population is exam-ined; expression measures are generally provided through high throughput techniques based on DNA microarray technology. The use of the new Ul-tra High Throughput Sequencing technology allows determining the order of the nucleotide bases (adenine, guanine, cytosine, and thymine) in RNA molecules. The study of the transcriptome at the nucleotide level is known as RNA-Seq.
Thanks to the deep coverage and base level resolution provided by next generation sequencing instruments, RNA-Seq provides researchers with ef-ficient ways to measure transcriptome data experimentally, allowing them to get information such as how different alleles or alternative forms of a gene are expressed, detecting post-transcriptional mutations or identify-ing gene fusions. RNA-Seq is a technique that is quickly becomidentify-ing new reference in the study of diseases like cancer.
counting how many short reads from the RNA molecules of a sample cover-age determinate positions on the chromosomes, we can gather information on the expressed genes for this sample. We will use this oversimplified view of the whole process to describe the bioinformatics tools of interest in this context.
2.2
Advanced software tools
All ultra high throughput platforms save short read sequences as text strings in large files. The letters used in these strings are usually “A,C,G,T”, which represent the four nucleotide bases (A=adenine, C=cytosine, G=gua-nine and T=thymine) or an alternative encoding defining the so-called “color space”. Given this computing science point of view of the ing process, several software tool have been developed to manage sequenc-ing experiments and to perform analyses, like alignment to the reference genome (which is also encoded as a huge text file). After the previous brief introduction on the transcriptomics, what follow is a description of the state of the art software tools used in UHTS (and RNA-Seq) studies.
2.2.1 Erange
possible to:
• Assign reads that uniquely map on the genome to their site of origin.
• Select reads that match equally well to several sites (called multireads) to their most likely site(s) of origin on the reference genome.
• Detect splice-crossing reads and assign them to their gene of origin.
• Organize reads that cluster together, but do not map to an already known exon, into candidate exons or parts of exons.
• Calculate the prevalence of transcripts from each known or newly proposed RNA, based on normalized counts of unique reads, spliced reads and multireads.
Erange is the first software introducing a new normalized measure of tran-scripted short reads on the reference genome: defined by the sensitivity of a RNA-Seq sample/experiment as a function of both molar concentration and transcript length. The Erange’s writers quantify transcript levels in reads per kilobase of exon model per million mapped reads (RPKM). The RPKM [9] measure of read density defines a sort of “molar” concentration of a transcript in the starting sample by normalizing for RNA length and for the total read number in the measurement. This facilitates comparison of transcript levels both within and between samples and experiments.
2.2.2 Bowtie
than 35 times faster than previous aligners. This software is part of the next generation of alignment programs because it is not based on hash-table methods and it avoids their enormous memory requirements. Indeed Bowtie employs a Burrows-Wheeler index, which guarantees a memory footprint of only about 1.3 gigabytes (GB) for the human genome. This smaller footprint allows Bowtie to run on a typical desktop computer with 2 GB of RAM. Moreover Bowtie can run on multiple processor cores si-multaneously to achieve higher alignment speed.
The Burrows-Wheeler transform (BTW) is a reversible permutation of the characters in a text. Although originally developed within the con-text of data compression [3], BWT based indexing allows large con-texts to be searched efficiently in a small memory footprint. It has been applied to bioinformatics applications, including oligomer counting, whole-genome alignment, tiling microarray probe design, and Smith-Waterman alignment onto a human-sized reference [3].
In Bowtie, the BWT based index is built upon on the Ferragina and Manzini [3] exact-matching algorithm. Here, the procedure is not simply adopted as-is, because exact matching does not allow for sequencing errors or genetic variations. The program introduces two novel extensions that make the technique applicable to short read alignment: a quality-aware backtracking algorithm that allows for mismatches and favors high-quality alignments; and “double indexing”, a strategy to avoid excessive backtrack-ing. The Bowtie’s policy allows for a small number of mismatches within the high-quality end of each read, and it places an upper limit on the sum of the quality values at mismatched alignment positions [3].
2.2.3 BWA
The Burrows-Wheeler Alignment tool (BWA) [6] is the next generation version of the software called MAQ [5], based on the hash table-based methods, which is accurate, feature rich and fast enough to align short reads from a single individual. BWA is a new read alignment package that is based on backward search within BWT to efficiently align short sequencing reads against a large reference sequence such as the human genome, allowing mismatches and gaps. BWA supports both base space reads, e.g. from Illumina sequencing machines, and color space reads from AB SOLiD machines. Evaluations on both simulated and real data sug-gest that BWA is approximately 10-20x faster than MAQ, while achieving similar accuracy. In addition, BWA outputs alignment in the new stan-dard SAM (Sequence Alignment/Map) format. Variant calling and other downstream analyses after the alignment can be achieved with the open source SAMtools software package [11].
2.2.4 Tophat
TopHat [8] is a free Open Source Software package which allows to discover splice junction in RNA-Seq samples.
exon boundary, exon → intron, or neither.
TopHat can identify splice sites “ab initio” by large-scale mapping of RNA-Seq reads. It maps reads to splice sites in a mammalian genome at a rate of ∼ 2.2 million reads per CPU hour, which is sufficient to process an entire RNA-Seq experiment in less than a day on a standard desktop com-puter. Rather than filtering out possible splice sites with a scoring scheme, TopHat aligns all sites, relying on an efficient 2-bit-per-base encoding and a data layout that effectively uses the cache on modern processors. This strategy works well in practice because TopHat first maps non-junction reads (those contained within exons) using Bowtie (described in 2.2.2). TopHat, as Bowtie, can run in multithread fashion on multi-core CPU architecture.
In discovering splice junctions, TopHat maps reads to the reference genome in two phases. In the first one, the pipeline maps all reads to the reference genome using Bowtie. All reads that do not map to the genome are set aside as “initially unmapped reads”. Bowtie reports, for each read, one or more alignment containing no more than a few mismatches (two, by default) in the 5′-most s bases of the read. 2
The remaining portion of the read on the 3′ end may have additional mismatches, provided that the Phred-quality-weighted Hamming distance is less than a specified threshold (70 by default). This policy is based on the empirical observation that the 5′ end of a read contains fewer sequenc-ing errors than the 3′ end. (Hillier et al., 2008). TopHat allows Bowtie to report more than one alignment for a read (default = 10), and suppresses all alignments above this number. This policy allows so called “multireads” from genes with multiple copies to be reported, but excludes alignments to low-complexity sequence, to which failed reads often align. Low complexity
2
The 5′and 3′(usually pronounced “five prime end” and “three prime end”) indicate thedirectionality
reads are not included in the set of the “initially unmapped reads” reads: they are simply discarded. TopHat then assembles the mapped reads using the assembly module in MAQ [5]. TopHat extracts the sequences for the resulting islands of contiguous sequence from the sparse consensus, infer-ring them to be putative exons. To generate the island sequences, Tophat uses MAQ which produces a compact consensus file containing called bases and the corresponding reference bases. The reference genome is used to call the base. In order to capture this sequence along with donor and acceptor sites from flanking introns, TopHat includes a small amount of flanking sequence from the reference on both sides of each island (default = 45 bp). To map reads to splice junctions, TopHat first enumerates all canonical donor and acceptor sites within the island sequences (as well as their reverse complements); next, it considers all pairings of these sites that could form canonical (GTAG) introns between neighboring (but not necessarily adjacent) islands. Each possible intron is checked against the “initially unmapped reads” for reads that span the splice junctions, as de-scribed below. By default, only potential introns longer than 70 bp and shorter than 20000 bp are examined.
2.2.5 SAMtools
The SAM (Sequence Alignment/Map) is a generic format for storing large nucleotide sequence alignments. The goals archived by this format are:
a. to save all the alignment information generated by various alignment programs;
b. to be easily created by alignment programs or converted from existing alignment formats;
d. to allow most operations on the alignment without loading the whole alignment into memory;
e. to index file by genomic position to efficiently retrieve all reads aligning to a locus.
SAMtools [11] is a library and software package for parsing and manipu-lating alignments in the SAM format. It also operates with BAM format, which is the binary version of the SAM [13]. This library can convert from other alignment formats, sort and merge alignments, call SNPs and show alignments in a text-based viewer. In an alignment of the 112Gbp Illumina GA data, SAMtools took about 10hours to convert from the MAQ format and 40 minutes to index with less than 30MB memory.
2.2.6 Cufflinks
Cufflinks [14] is a program that assembles aligned RNA-Seq reads into transcripts, estimates their abundances, and tests for differential expres-sion and regulation transcriptome-wide. In RNA-Seq experiments, cDNA fragments are sequenced and mapped back to genes and ideally, individual transcripts. Properly normalized, the RNA-Seq fragment counts can be used as a measure of relative abundance of transcripts, and Cufflinks mea-sures transcript abundances in Fragments Per Kilobase of exon per Million fragments mapped (FPKM), which is analogous to single-read “RPKM”.
The alternative splicing process involves RNA exons produced by tran-scription of a gene, which can be reattached in various ways during the RNA splicing phase. Different mRNAs are generated and all these can be translated into different protein isoforms3. The result of this activity is that a single gene can code for multiple proteins.
3
Cufflinks can estimate a transcript abundances. This task is performed assigning fragments to individual transcripts, but it is not easy because a read may align to numerous isoforms of the same gene. A statistical model [15] is applied on sequencing experiments. This model generate a likelihood to estimate the abundances of a set of transcripts given a set of fragments.
Cufflinks takes as input a file of alignments in SAM format, and reports transfrags in GTF (Gene transfer format [16]) format. Bowtie and TopHat support the SAM design, so their output can be passed to this tool.
2.2.7 Crossbow
Crossbow [17] is Open Source Software for cloud-computing that combines the aligner Bowtie and the single-nucleotide polymorphism (SNP) caller SOAPsnp [18]. Crossbow is distributed with a set of scripts, which allow to run this tool either on a local cluster or on a cluster rented through Amazon’s Elastic Compute Cloud (EC2) [19] utility computing service 4.
SOAPsnp performs a SNP analysis. A single-nucleotide polymorphism is a DNA sequence variation occurring when a single nucleotide, as A, T, C, or G, in the genome (or other sequence), differs between members of a species (or between paired chromosomes in an individual). These variations in DNA sequences can manifest how individuals develop diseases and respond to external agents.
By taking advantage of commodity processors available via cloud com-puting services, Crossbow condenses over 1,000 hours of computation into a few hours without requiring the user to own or operate a computer cluster [17].
4
2.2.8 Genome Browser
The UCSC Genome Browser website [20, 2] contains the reference sequence and working draft assemblies for a large collection of reference genomes for different species. It also provides a portal to the Encyclopedia of DNA El-ements (ENCODE) project [21], which aims to provide a more biologically informative representation of the human genome by using high-throughput methods to identify and catalogue the functional elements encoded.
The Genome Browser section allows users to zoom and scroll over chro-mosomes, showing the work of annotators worldwide. Moreover, the users can upload and display their custom tracks on the available reference genome. Users’ data have to be written as tab-separated files using one of the formats supported like GFF, GTF, PSL, BED, bigBed, WIG, bigWig, BAM, MAF, and microarray (BED15). Erange and TopHat can export their results in Genome Browser compatible file formats.
Figure 2.1: Example of alignments in Genome Browser from RNA-Seq Cerebellum (hu-man) Illumina 35bp sample [1] over the HG18 reference genome
2.2.9 Galaxy
through a simple web browser. The system supports the integration of genomic sequences, their alignments, and functional annotation. Moreover, it allows users to gather and manipulate data from existing resources in a variety of ways. Every action of the user is recorded and stored in a history system. This mechanism allows users to run independent queries on genomic data from different sources and then use Galaxy to combine or refine them, perform calculations, or extract and visualize corresponding sequences or alignments.
The framework is written in Python language [23] and the data storage uses SQLite [24] a self-contained SQL database engine. Galaxy can also be configured to run jobs on a HPC cluster. One of the key features of Galaxy is its ability to obtain data directly from UCSC Table Browser. Any dataset in Galaxy’s history can be displayed within UCSC Genome Browser as long as its chromosome, start, and end columns (so called metadata) are properly set and the corresponding genome assembly exists at the UCSC Browser.
2.2.10 SRA
The National Center for Biotechnology Information (NCBI), the European Bioinformatics Institute (EBI), and the DNA Data Bank of Japan (DDBJ) are involved in the International Nucleotide Sequencing Database Collab-oration [25]. This collabCollab-oration has set up the Sequence Read Archive (SRA) [26, 27] to provide the scientific community with an archive for next generation data sets.
In November 2009, the SRAs collectively hosted about 11 Terabases of biological sequence data. This included 170 full-length human genomes, over 900 bacterial genomes, and 100 expression and epigenomics studies. Over 90 published studies have been linked to SRA deposits. The archive comprises platforms as 454, Illumina, SOLiD, Helicos, and others.
Most of the human genomes were produced by the 1000 Genomes Project [30], which is using sequencing data to perform a deep analysis of ordi-nary human variation in three healthy populations with the expectation of detecting common human genetic variants (defined as frequency 1% or higher). The goal of the 1000 Genomes Project is submitting reads to the SRA in real time as they are produced, allowing investigators not associ-ated with this project to direct access to its output.
An automatic downloader and
analyzer system
3.1
Problem
The chance to use the high accuracy information from the next genera-tion sequencing technologies for a large number of samples is revolugenera-tionary step for molecular biomedicine. It can open to the possibility to investi-gate transcription events and gene dynamics through a numerical point of view. On very large set of experiments statistic measures and mathemat-ical models can be applied to describe biology events. Tasks of interest could include the identification of signatures of disease in different indi-viduals or the validation of models that can describe widespread features between different populations. The relatively small number of studies can be a constraint to this type of investigation. Fortunately, as in microar-ray or mass spectrometry cases, public repositories are growing to store data from the next generation studies produced in laboratories around the world. A repository can be used to access to a large number of samples from experiments with different individuals, populations and sequencing platforms.
The existence of these repositories is an invaluable resource for biologists
and bioinformaticians. But how much are these sites usable in practice? A user has to connect to a repository, find his samples, download and process them. The last two phases are relatively complex operations in the UHTS case. First, as already described, the text files from a UHTS experiment can weigh several gigabytes, so a considerable time is required to move data from the repository to a local workstation. Second, the alignment phase and other post processing analyses can take several days and weeks when the number of short read files gets larger and the computational resource is only a single workstation. A manual download and exploration can be completed for a small amount of data files. Nevertheless, the possibility to retrieve from a large deposit of samples is a crucial step to involve investigations and comparisons between them.
The problem becomes how to manage the possible (few or many) heavy-weight files (several gigabytes) from a public repository and to use them in a comparison study in a reasonable time.
also described in Chapter 2. This archive has been selected because it stores a large number of sequencing trials and it is maintained by three international bioinformatics institutes which guarantee high quality in the recorded sequencing experiments.
3.2
Methods
The main goal is to build an automatic system that can process large numerical sets of ultra high throughput experiments, generating results that can be utilized to compare genomic attributes between samples.
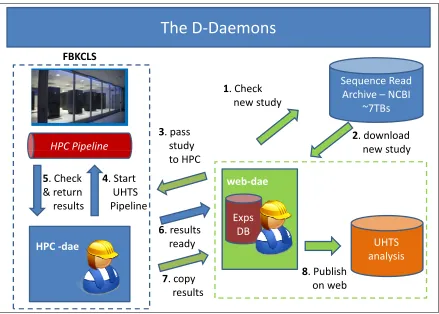
The D-Daemon system is an automatic downloader and analyzer system that interfaces to the NCBI SRA. This public repository actually includes a huge number (11 Terabases) of high quality sequencing experiments. The D-Daemon system allows to select a sample in NCBI SRA on the basis of some user-defined parameters, downloaded and passed to an analysis pipeline.
Once activated, the system can be scheduled to find new data in the repository, corresponding to the user’s parameters. To reduce the waiting time between harvesting of data and availability for biological analysis the solution is designed to operate an analysis pipeline in a HPC environment. The pipeline is composed by elements chosen from the state of the art and Open Source Software tools in the UTHS research community. For each experiment, the RPKM measure is calculated over all chromosomes. The sequences aligned on the reference genome are translated in a Genome Browser compliant file format for visualization. Finally the identification of new gene isoforms is supported.
a glue to links together two or more systems [31]. It allows a rapid and efficient deployment of software infrastructure. Examples of bioinformatics platforms in this language can be found in [32] and [33].
A high performance computational environment
for UHTS studies
Sequence Read Archive – NCBI
~7TBs S A N Remote query: Download (2) UHTS analysis F B K C LS •Statistics
•Compare studies
U H T S P ip e lin e
Publish on web Remote query: Check new study
(1) (3)
(4)
Figure 3.1: System description.
3.3
The D-Daemons architecture
The D-Daemons
Sequence Read Archive – NCBI
~7TBs
1. Check
new study
2. download
new study
3. pass
study
FBKCLS
HPC Pipeline study new study
to HPC
4. Start
UHTS Pipeline
6. results
ready
HPC Pipeline
HPC -dae 5. Check
& return results
UHTS analysis
8. Publish
on web
web-dae
Exps DB
7. copy
results
The Entrez cross-database search and the ESearch utility are common gateway interface (CGI) scripts invoked from a uniform resource locator (URL) of a web server; their task is to analyze the content of the requests from clients (users through their web browsers), to determine an appropri-ate document to send in response, and to return it to the clients. Therefore, the web daemon utilizes Entrez and ESearch to perform a set of queries to their URLs. For example, given a text search strings “T”, a first query is performed to obtain the number of entries which match T. This is the URL for this step:
http://eutils.ncbi.nlm.nih.gov/entrez/eutils/esearch.fcgi ?db=sra&term=T&rettype=count
Parsing the output of the previous query, the number of entries, which will be indicated as “totexps”, is archived. Another web query is submitted to obtain the IDs of the corresponding entries:
http://eutils.ncbi.nlm.nih.gov/entrez/eutils/esearch.fcgi
?db=sra&term=$1&retmax=$totexps
Finally, once captured the IDs list, indicated as “L”, the documentations of each experiment is acquired through a loop that queries the Entrez search engine for each element in the catalog L:
while ID in L: do
http://www.ncbi.nlm.nih.gov/sites/entrez?cmd=retrieve &db=sra&list uids=ID&dopt=full&format=text
done
The second service is called theHPC daemon (HPC-dae) and it runs on the HPC infrastructure, where it can interact with a queue system. The HPC-dae is the software which coordinates how user programs (jobs) are scheduled to be executed on the execution nodes. The service waits for the sequence data from its counterpart, which has downloaded them from the SRA. The HPC service passes the experiments to the HPC pipeline, which processes them, checks when the analysis line is terminated and returns the output to the web daemon. The HPC service can monitor several HPC pipeline instances simultaneously and if this is considered with the fact that each pipeline is executed on several nodes concurrently, these attributes allow processing a huge number of ultra high throughput samples.
3.4
The HPC pipeline
The analysis pipe that processes the short read sequences in a UHTS exper-iment is composed by three tools: Bowtie, Samtools and Cufflinks, already presented in Chapter 2. They represent the state of the art in software tools applied to the next generations sequencing analysis. Bowtie is used to align the short reads on the reference genome. In the next chapter, a comparative analysis between this tool and another aligner is presented; the results motivate why Bowtie was chosen as the alignment engine of this pipeline. SAMtools transforms the Bowtie outputs in bedGraph Track For-mat [35] format files. The bedGraph type is extremely useful for visualizing probability scores and transcriptome data in the UCSC Genome Browser. The bedGraph is a line-oriented format and its four required fields are:
1. chrom: the name of the chromosome (e.g. chr3, chrY, chr5 random) 2. chromStart: the starting position of the feature in the chromosome 3. chromEnd: the ending position of the feature in the chromosome 4. data value: can be integer or real, positive or negative values.
SAMtools is also used to prepare the right input format to last module of the chain automatically. Cufflinks performs RPKM computation of the aligned sequences on genes. The RPKM measure [9] reflects the molar concentration of a transcript in the starting sample by normalizing for RNA length and for the total read number in the measurement. This measure is becoming a standard in next generation experiments, because it represents an objective measure allowing the comparison of the transcript levels in different experiments. The Cufflinks statistical model (described in Chapter 2, based on the methods in [15]) probabilistically assigns reads to individual isoforms: this process can identify new isoforms, which are reported in the result files.
All these software elements are not written to run in a HPC environment natively. Therefore, some adaptations have been applied to make these tools running in a efficient mode. In the Bowtie case, all the short reads that compose an experiment are divided into a number of groups given by the number of allocable execution nodes (it could be a workstation, a CPU or single core in a multi-core processor, depending on the HPC architecture). Each group of reads is assigned to one execution node, where one Bowtie instance performs the alignment on the reference genome: in this way each group of reads is processed in parallel. A different approach is followed to parallelize SAMtools and Cufflinks. The aligned short reads are divided on the basis of the chromosome of the reference genome onto which they where aligned. 1 For each chromosome an instance of the two
tools is executed to generate the bedGraph and bigWig files, the RPKM values and a little utility that publishes outcome to create the HTML pages to publish these outcomes. It is possible to understand because the results
1
are presented separated by chromosome. These new functionalities in the D-Daemons architecture to execute Bowtie, SAMtools and Cufflinks in a HPC environment are added by ad hoc shell scripts called “wrappers”, which set the stage for running the software pipeline on several execution machines simultaneously.
3.5
SRA structure
The system queries the Sequence Read Archive (SRA) to find experiments on the basis of a search key defined by the user. In case of a positive match, the required samples are downloaded to be analyzed. Understand how these steps are performed, a survey on the SRA’s structure has been nec-essary. In the SRA archive the next generation data are classified through a hierarchy. The organization is based on the following categories:
1. studies
2. experiments
3. samples
4. runs.
run contains the short reads from each platform run. Each experiment is composed of one or more sequencing it. In the future, some studies will also have an associated analysis. These “analyses” may include as-semblies of the short reads into genomic or transcript contigs, i.e. long contiguous DNA sequences assembled from short sequencing (short reads), and alignment to existing genomes or alignments onto other SRA data. Records from each class have unique accession identifiers with a specific three-letter prefix that indicates the type:
ERP or SRP for studies (example: SRP000727)
SRS for samples (example: SRS002671)
SRX for experiments (example: SRX003932)
SRR for runs (examples: SRR015321, SRR015322, SRR015323 ).
As mentioned in Chapter 2, the data in the SRA archive can be found through Entrez cross-database search. The Entrez search is available di-rectly from the SRA web portal [10] and it makes possible to select experi-ments that match search strings entered by a user. For each entry returned by a query a lot of information is returned. In general the following details are produced for each experiment in the NCBI repository:
Accession: SRX003932
Title:
Experiment Design:
Submission: GEO
Study accession: SRP000727
Study Title: Alternative Isoform Regulation in Human
Study Abstract:
Study Center: GEO
Study Center Project: Alternative Isoform Regulation in Human
Tissue Transcriptomes (ID=0)
Project name: Alternative Isoform Regulation in Human Tissue
Transcriptomes
Sample Accession: SRS002671
Sample Description: source: Human adipose tissue; description: RNA seq
Sample Common Name: Homo sapiens, (TaxonId=9606)
Sample Attributes: tissue=adipose
Sample Links: GEO web Link= http://www.ncbi.nlm.nih.gov
/geo/query/acc.cgi?acc=GSM325481
Library Name: adipose
Library Strategy: EST
Library Source: NON GENOMIC
Library Selection: cDNA
Library Layout: SINGLE
Platform Name: ILLUMINA
Processing: Base Space,
Quality score: , 0x0.0E0
Spot descriptor: 1) Application Read, Forward
Total: 7 runs, 27.8M spots, 888.1M bases
Run #1: SRR015321, 3851492 spots, 123247744 bases
Run #2: SRR015322, 3879376 spots, 124140032 bases
The experiment’s unique accession identifier is also used to organize files in the SRA’s FTP site. The root directory of this ftp repository is
ftp://ftp.ncbi.nlm.nih.gov/sra/static/
The files of each experiment are stored in directories under this ftp root and these subdirectories have a name which is assembled by the experiment identifier. The subdirectory path is composed by the first six letter of the experiment identifier, the slash symbol and the complete experiment identifier. For example the experiment called SRX003932 has its runs file in the following sub directory:
SRX003/SRX003932
while the full path becomes:
ftp://ftp.ncbi.nlm.nih.gov/sra/static/SRX003/SRX003932/
This relatively simple encoding defines the structure of a huge amount of biological knowledge, as 11 Terabases of sequencing data are included in the Sequence Read Archive repository.
3.6
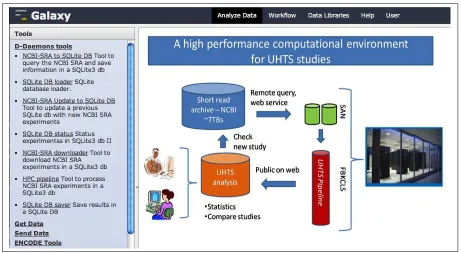
Integration in Galaxy
The Galaxy framework has been introduced in Chapter 2. It is an environ-ment with an easy-to-use web interface where different software for UHTS studies can be integrated and executed individually. Alternatively, the software tools can be concatenated and run Each experiment is composed of one or more sequencing it. together to combine a sequence of analysis steps called “workflow”.
A set of D-Daemons tools has been developed to be included in the tools panel of the Galaxy interface. These new elements are python scripts which call the functions of web-dae component. Under a menu tool called D-Daemons tools (see Figure 3.3) seven new entries are developed:
1. NCBI-SRA to SQLite DB This command queries the SRA reposi-tory by a user defined research key and saves the result in a SQLite database.
2. SQLite DB loader Given an existing database (produced in a previ-ously query) this entry resubmits the user defined research key (saved in the DB) and if new experiments are found they are saved in the database.
3. NCBI-SRA Update to SQLite DB Given an existing database (pro-duced in a previously query) this entry resubmits the user defined re-search key (saved in the DB) and if new experiments are found they are saved in the database.
4. SQLite DB status This command prints the status of experiments saved in a DB. This view presents experiments by their SRA codes, file directories and result links.
5. NCBI-SRA downloader This function downloads files of the exper-iments in the DB..
6. HPC pipeline This function takes as input an user-selected experi-ment from a database and communicates with the HPC daemon to be processed in the HPC pipeline. Moreover, it is possible to analyze all non yet processed experiments in a database.
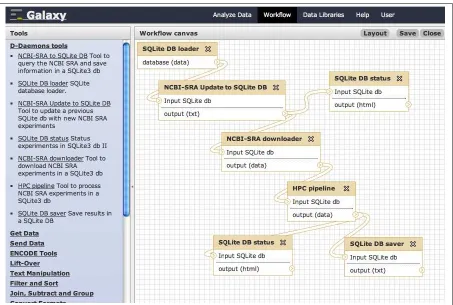
These SRA modules are based on some features of the web daemon and they can be used a separately. A main feature in Galaxy is to build and ex-ecute workflows of different tools. Thus, the presented Galaxy-like modules of the D-Daemons system can be concatenated for new analysis workflows (Figure 3.4).
3.7
Test environment
The HPC pipeline has been developed in a Linux cluster environment com-posed by 416 cores in 52 nodes, with a queue system based on the Sun Grid Engine software [37] and a 10 Terabyte volume in a storage area network to stock the input and output data. Different Linux workstations outside the Linux cluster network have been used to implement the dual services architecture between the cluster front end and a web server.
3.8
The CRC case study
The D-Daemons architecture has been tested on different analysis tasks. Here a typical case study on cancer UHTS data is presented in details. In the context of the EU FP7 project HIPERDART, in collaboration with Istituto Catalao de Oncologia, a FBK [38] researcher needs to recover all Colorectal Cancer Cell (CRC) lines in SRA. Through “Colorectal Cancer cell line” query, all experiments stored in NCBI SRA were downloaded and processed by the system. The Experiment features are shown in the following table.
SRA experiment code SRA sample code Runs Spots Bases SRX012945 SRS007122 2 19M 685.5M SRX012946 SRS007123 2 18.3M 659.4M
What follows is an example of the output generated by the D-Daemons system. The HTML pages where experiment results are published (in Fig-ure 3.5 and FigFig-ure 3.6). The output is divided on the HG18 chromosomes. In Figure 3.7 and Figure 3.8 outputs for each chromosome:
2. bedGraph file
3. bigWig file
4. Transcripts gtf (from Cufflinks)
5. Transcripts tmap (from Cufflinks)
6. UCSC Genome Browser track line (to load bigWig file in UCSC Genome Browser)
7. link to open wigBig in the UCSC Genome Browser.
Figure 3.9 and Figure 3.10 present the RPKM values sorted from high numbers to low numbers. The second column, produced by the Cufflinks software, allows to identify possible “new junctions”.
Figure 3.7: Chromosome 1 result page for experiment SRX012945.
Aligner selection in a NGS pipeline
4.1
Aligner comparison
This section describes the benchmarks, on a SNP discovery from RNA-seq data, obtained with two recent Open Source Software currently popular in next generation sequencing (NGS) experiments: Bowtie [3] and Bwa [6]. This work aims to compare two candidate alignment engines. The winner will be inserted in the proposed HPC pipeline presented in the Chapter 3. Moreover this exercise exemplifies how to control reproducibility in NGS experiments in complex pipelines. The two aligners were tested on three RNA-Seq datasets previously analyzed in the Wang study [1]. Data are available from the NCBI Sequence Read Archive [10, 26] with accession SRA002355.1. The dataset is formed by 32bp short reads produced by the Illumina sequencing process of a Human Breast tissue and two cell lines (BT474 & MCF7). Following are other attributes of the samples:
SRA signature Tissue/Cell Line Reads Lanes
SRX003922 BREAST 16120746 4
SRX003923 MCF7 16059515 4
SRX003935 BT747 18424533 7
The human build HG18 from the UCSC Genome Bioinformatics site [20] was used as reference genome. Our trials are focused to test the behaviors of the two aligners in a parallel environment, where they can be executed on several CPUs simultaneously and the main intention is to reduce the alignment time. Here are compared time, memory usage and alignment accuracy of Bowtie and Bwa executed in parallel mode (i.e. on more than one CPUs).
The accuracy measures are performed taking in account the number of uniquely mapped reads and of allowed mismatches and through a SNP discovery analysis. Bowtie and Bwa do not include functions for this type of analysis, so other two instruments have been used on their outputs to perform the SNP detection: TopHat [8] has been applied on Bowtie output, while SAMTool [11] has been run on the Bwa results.
The FBK [38] computing system has been used to perform these trial estimations. The facility is composed by 416 cores in 52 nodes, each one with 2 Intel Xeon Quadcore processors and RAM Memory ranging from 16 to 72 GB per nodes. The operating system installed on nodes is the Scientific Linux distribution, which is developed by CERN and Fermi Lab. A SGE [37] queue system governs users and their programs (called jobs) on the cluster. The queue system schedules users’ jobs on available free nodes to start their execution. This HPC infrastructure has allowed us to complete tests using a number of processor cores from 1 to 256. Current processors are based on multi-core architecture, where two or more CPUs (called cores) have been condensed in the same die for increased perfor-mance. Given this clarification, in the following the term “CPU” will be used to indicate a “processor core”.
environment as a computer cluster. Modern cluster facilities are based on distributed memory architectures, where each node views only its local Random-access memory (RAM). Multiple threads can be applied in local RAM memory space, so in a cluster environment multithread software can use only one node at time.
Given these boundaries, to execute Bowtie and Bwa on two o more nodes up to 256 cores at the same time, two ad hoc shell scripts (or “wrappers”) were developed to make the aligners more compliant with the cluster’s queue system. These wrappers allow Bowtie and Bwa to interact and run in the cluster facility, implementing two methods to distribute the input files/reads to multiple instances of the two aligners running on different CPUs. How to allocate various occurrences of an aligner, share out the input reads between them and rebuild the final output are the keystones to implement the parallelization of Bowtie and Bwa. Two parallelization strategies are put into action through the two wrappers.
The first method is based on some attributes of the Illumina sequencing process. Here, the short reads are divided in 1−7 files, called lanes. These files reflect the architecture of the Illumina system, where the sequencing process runs over 7 pipelines (+1 for control). So, the tactic is to submit a number of instances of one aligner which is equal to the number of lanes, i.e. each single lane is assigned to one instance of Bowtie or Bwa to be aligned. When computing of all instances is finished, their output is unified in a single output file, which contains the alignment result of all short reads from all lanes. This wrapper will be indicated as the separated lanes method.
general N is not a factor of T). These N groups are processed by N
copies of an aligner. As in the previous methods, when all instances have finished, all the output files are combined in a unique file. This routine will be marked as the merged lanes method.
The behaviors of the two aligners and the parallelization methods have been tested recording the RAM memory usage and the computational time to execute an alignment of the short reads from the BREAST, MCF7 and BT747 samples. All trials involved in profile collation of performance in time and memory RAM usage have been repeated four times; means and standard deviations of these repetitions for each specimen are reported in tables below.
Besides the computing performances quality of the results from the two aligners were also inspected. Uniquely mapped reads and allowed mis-matches have been quantified and SNP discovery has been applied on the alignment files from the BREAST, MCF7 and BT747 samples. Consensus building and downstream analysis was performed by SAMtools [11], a set of utilities for the manipulation of mapped reads. SNPs were called from the consensus sequence and then filtered in order to retain only high-quality SNPs, based on the following inclusion criteria:
• Mapping quality > 25
• Read depth > 3
• SNPs do not fall within 10bp from a gap.
As reported above, the Bowtie output has to be used through Tophat to produce a SNP output, so the mark “Bowtie/T” will denote the use of both for this aim.
with the merged lanes method varying the number of uses CPUs applied to the three samples. Table 4.1, Table 4.3 and Table 4.5 report values of these test conditions.
The graphs in Figure 4.2, Figure 4.4 and Figure 4.6 display times in seconds spent by Bowtie and Bwa with the separated lanes method varying the number of used CPUs applied to the lanes of Breast, BT474 and MCF7 samples. The column lane indicates the number of CPUs in charge of aligning all lanes, for example the 3 value denotes that all lanes are equally distributed and aligned on 3 CPUs. Table 4.2, Table 4.4 and Table 4.6 report precise numbers.
In Figure 4.7, Figure 4.8 and Figure 4.9 the progress of used RAM mem-ory, expressed in Gigabyte (GB), by Bowtie and Bwa is shown changing the involved CPUs number in the merged lanes method. In Table 4.7, Table4.9 and Table 4.11 the corresponding numerical values are shown.
The separated lanes method and its RAM memory consumption is accu-rately reported in Table 4.8, Table 4.10 and Table 4.12. Given the constant values obtained, no graphs have been supplied for this method.
SRX003922−Breast−JL
CPUs
Time (seconds)
0 2000 4000 6000 7000
1 2 4 8 16 32 64 128 256
bwa bowtie
Figure 4.1: Scalability comparison of Bowtie and BWA on merged lanes of Breast sample.
BWA BOWTIE
CPU mean sd mean sd
1 6021.75 251.97 1580.25 57.59
2 3138.38 117.48 847.12 35.63
4 1565.69 72.11 452.75 23.12
8 851.56 32.20 267.91 25.53
16 494.70 24.80 166.53 28.73
32 273.84 21.94 138.16 76.08
64 178.96 49.25 127.11 64.89
128 104.39 24.88 54.79 20.35
256 75.35 31.87 49.58 24.20
SRX003922−Breast−SL
CPUs/LANEs
Time (seconds)
0 2000 4000 6000 7000
1 2 3 4
bwa bowtie
Figure 4.2: Scalability comparison of Bowtie and BWA on separated lanes of Breast sample.
BWA BOWTIE
lane mean sd mean sd
1 6064.75 316.95 1351.00 49.89
2 3161.62 88.46 684.75 18.42
3 2109.75 61.49 467.75 27.49
4 1609.06 71.88 358.62 22.00
SRX003935−BT474−JL
CPUs
Time (seconds)
0 2000 4000 6000 7000
1 2 4 8 16 32 64 128 256
bwa bowtie
Figure 4.3: Scalability comparison of Bowtie and BWA on merged lanes of BT474 sample.
BWA BOWTIE
CPU mean sd mean sd
1 6704.00 183.54 1957.50 47.87 2 3427.50 168.54 1027.88 44.76
4 1806.69 110.85 542.44 20.71
8 929.53 34.60 307.88 6.85
16 518.50 32.06 189.70 14.65
32 283.84 8.86 110.62 4.76
64 169.73 12.62 87.32 18.18
128 94.72 2.95 54.90 4.26
256 62.59 1.11 41.72 5.22
SRX003935−BT474−SL
CPUs/LANEs
Time (seconds)
0 2000 4000 6000 7000
1 2 3 4 5 6 7
bwa bowtie
Figure 4.4: Scalability comparison of Bowtie and BWA on separated lanes of BT474 sample.
BWA BOWTIE
lane mean sd mean sd
1 6895.25 79.73 1819.00 80.91 2 3486.62 125.62 895.12 22.25
3 2349.67 77.84 596.17 5.94
4 1803.88 50.31 456.31 16.88
5 1476.75 58.70 374.25 15.88
6 1219.12 27.12 307.00 16.67
7 1034.61 53.56 263.68 11.06
SRX003923−MCF7−JL
CPUs
Time (seconds)
0 2000 4000 6000 7000
1 2 4 8 16 32 64 128 256
bwa bowtie
Figure 4.5: Scalability comparison of Bowtie and BWA on merged lanes of MCF7 sample.
BWA BOWTIE
CPU mean sd mean sd
1 6020.00 395.58 1561.75 92.88
2 3104.75 113.16 841.38 78.12
4 1583.81 70.62 464.56 69.81
8 863.59 45.14 271.50 47.87
16 476.59 56.13 190.89 48.52
32 270.40 38.32 160.72 45.41
64 163.40 40.38 70.22 20.50
128 87.01 7.80 62.08 21.64
256 59.08 3.12 37.17 2.57
SRX003923−MCF7−SL
CPUs/LANEs
Time (seconds)
0 2000 4000 6000 7000
1 2 3 4
bwa bowtie
BWA BOWTIE
lane mean sd mean sd
1 5812.00 178.94 1338.75 41.70
2 3096.38 76.93 696.00 18.71
3 1993.42 74.81 455.08 15.31
4 1534.75 113.87 353.69 13.33
Table 4.6: Scalability (in seconds) on MCF7 sample with separated lanes.
BWA BOWTIE
CPU mean sd mean sd
1 2.065 0.007 1.917 0.014
2 2.054 0.006 1.875 0.028
4 2.025 0.002 1.808 0.027
8 1.982 0.010 1.688 0.015
16 1.899 0.004 1.478 0.022
32 1.755 0.008 1.203 0.014
64 1.523 0.027 0.891 0.010
128 1.212 0.026 0.601 0.017
256 0.874 0.036 0.387 0.011
SRX003935−BT474JL
CPUs
Ram Memor
y (GB)
0 0.5 1 1.5 2 2.5
1 2 4 8 16 32 64 128 256
bwa bowtie
Figure 4.7: Memory usage comparison of Bowtie and BWA on merged lanes of BT474 sample.
BWA BOWTIE
lane mean sd mean sd
1 2.156 0.011 2.245 0.001
2 2.156 0.010 2.245 0.001
3 2.151 0.004 2.245 0.001
4 2.150 0.003 2.244 0.001
5 2.149 0.005 2.243 0.002
6 2.149 0.003 2.243 0.001
7 2.149 0.002 2.244 0.001
SRX003923−MCF7−JL
CPUs
Ram Memor
y (GB)
0 0.5 1 1.5 2 2.5
1 2 4 8 16 32 64 128 256
bwa bowtie
Figure 4.8: Memory usage comparison of Bowtie and BWA on merged lanes of MCF7 sample.
BWA BOWTIE
CPU mean sd mean sd
1 2.067 0.008 1.879 0.013
2 2.056 0.004 1.839 0.013
4 2.027 0.003 1.762 0.014
8 1.983 0.003 1.622 0.011
16 1.900 0.006 1.417 0.011
32 1.756 0.016 1.133 0.028
64 1.529 0.018 0.826 0.023
128 1.212 0.023 0.555 0.018
256 0.885 0.026 0.361 0.015
BWA BOWTIE
lane mean sd mean sd
1 2.156 0.002 2.242 0.001
2 2.157 0.008 2.241 0.002
3 2.154 0.004 2.242 0.001
4 2.151 0.003 2.243 0.001
Table 4.10: Memory usage (in GB) on MCF7 sample with separated lanes.
SRX003922−Breast−JL
CPUs
Ram Memor
y (GB)
0 0.5 1 1.5 2 2.5
1 2 4 8 16 32 64 128 256
bwa bowtie
BWA BOWTIE
CPU mean sd mean sd
1 2.061 0.007 1.876 0.008
2 2.050 0.008 1.825 0.010
4 2.025 0.004 1.748 0.020
8 1.978 0.006 1.619 0.011
16 1.902 0.006 1.409 0.016
32 1.755 0.015 1.135 0.015
64 1.538 0.011 0.826 0.014
128 1.214 0.016 0.557 0.005
256 0.888 0.025 0.366 0.014
Table 4.11: Memory usage (in GB) on Breast sample with merged lanes.
BWA BOWTIE
lane mean sd mean sd
1 2.154 0.003 2.242 0.001
2 2.153 0.001 2.242 0.000
3 2.154 0.002 2.242 0.001
4 2.152 0.002 2.242 0.001
Breast
BT474
MCF7
6000000 8000000 10000000 12000000 14000000 16000000 18000000
=>3MM 2MM 1MM
0 2000000 4000000 6000000
Bowtie BWA Bowtie BWA Bowtie BWA
0MM
Figure 4.10: Comparison of uniquely mapped reads stratified by the number of allowed mismatches
total mapped mismatches + indels
0 1 2 3+
BREAST Bowtie/T 13528932 (83.92%) 8080879 3262783 2171598 13672 BWA 10730122 (66.56%) 7181244 2528362 1018399 2117 BT474 Bowtie/T 15627171 (84.82%) 9325662 3717151 2532107 52251
BWA 11694386 (63.47%) 7834663 2724955 1132370 2398 MCF7 Bowtie/T 14161929 (88.18%) 8696849 3171379 2282772 10929
BWA 10434523 (64.97%) 7320164 2211479 900663 2217
0,003 0,004 0,005 0,006 0,007 0,008
C
o
u
n
ts
p
e
r
to
ta
l
re
a
d
s
Breast – Bowtie/T
0 0,001 0,002 0,003
A>C A>G A>T C>A C>G C>T G>A G>C G>T T>A T>C T>G
C
o
u
n
ts
p
e
r
to
ta
l
re
a
d
s
0,00