PROPINQUITY BETWEEN COGNITION WITH SNACKING PATTERN OF THE
SELECTED SCHOOL CHILDREN
Anitha M. C.*1 and Anusuya Devi2
Ph. D Research Scholar1, Assistant Professor2,
Department of Nutrition and Dietetics, PSG College of Arts and Science, Coimbatore – 641014, Tamil Nadu, India.
Received date: 26 July 2018 Revised date: 16 August 2018 Accepted date: 06 September 2018
INTRODUCTION
Adequate brain function is a pre-requisite for efficient cognition and the performance of organized behavior. Indeed, the uninterrupted activity of the brain is vitally important to the survival of an organism because it ensures the continuous performance of many essential voluntary and involuntary functions.[1] Balanced nutrition is very important in school-age children, which is a period of vigorous growth, increased activity, and the development of physical and cognitive functions. Food quality and good nutrition are related to brain development and cognitive function, which are important in childhood for health and well-being.[2,3] From the perspective of neuropsychology, adequate nutrition is essential for healthy brain functioning, optimal learning, and academic performance.[4] Numerous studies have been conducted about the beneficial and detrimental effects of specific nutrients and ingredients on cognition and behavior.[5-8] A study by Wolraich et al. finds that
diets high in sucrose have no significant effects on behavior and cognitive performance in children.[9]
Recent years have seen a move away from analyzing the associations between isolated nutrients and brain health to an overall consideration of the effects of dietary behavior or patterns, such as the consumption of junk food.[10-13] The aim of this study is to explore the relationship between snack intake and cognitive function in school going children.
MATERIALS AND METHODS
1. Selection of population
The author contacted 11 Government schools
(Government and Government aided) and 8 non-government schools (Matriculation and CBSE). Government schools are run by government where the fee ranged from Rs.1000-2000/year, whereas the selected non-government school collected a fee of Rs. 30,000-50,000/year. Permission was granted and data collection
Original Article www.wjahr.com
Volume: 2. Issue: 5. Page N. 176-183
Year: 2018
WORLD JOURNAL OF ADVANCE
HEALTHCARE RESEARCH
Corresponding author:Anitha M. C.
Ph. D Research Scholar, Department of Nutrition and Dietetics, PSG College of Arts and Science, Coimbatore – 641014, Tamil Nadu, India.
ABSTRACT
Background: The aim of the study was to explore snack intake and cognitive function in school going children in Coimbatore (10-12 years). Materials: A cross sectional study design with children studying in grades 5th to 7th grade, in different schools of Coimbatore. We visited 25 schools among 5 each government school and government aided and 3 matriculation and 2 CBSE schools permitted for the conduct of the study. Totally 1409 school children from government (n=407), Government aided (n=411), Matriculation (n=388), CBSE (n=203) A structured and validated questionnaire was developed. A cognition test assessment was done to find out the relationship between snack consumption and better cognition level with the help of National Psychological Corporation, Pune. Pramila Ahuja‟s Group Test of Intelligence for children from 9 to 13 years was used. Results: Majority of the school children were in government aided (29.2%). Socio- Economic Background depicts that rural adolescents prefer nearby government aided (55%) and government school going adolescents (53%) whereas urbanities select matriculation (59%) schools. Overweight and obesity was more prevalent among matriculation and CBSE school children. Conclusion: Poor nutritional quality snacking at school and at home was not associated with cognition function but positively associated with meal skipping pattern.
KEYWORDS: Cognitive function; Snack consumption; Snacking pattern; Cognition; Group Test of
was done among 6 government and 5 non-government schools respectively. Consenting male and female students of class 5- 7 were included in the study.
2. Selection of sample
Our sample size was 1409 school children. Gender differences were not considered in our calculation. However, we collected data from all consenting students from within the selected grades and schools. Duration of Study was about 3 months starting from July –September 2016.
3. Data collection
Using validated questionnaire, data like Age and Gender, Socio-Economic Background, anthropometry, frequency and awareness about nutrition labels were collected. Data collection was carried out using interview schedule method as it allows the researcher to build a rapport with the child and gives validation to the data.
India, a country with vast differences among people based on their economy so this is assessed using Revised Kuppuswamy Scale 2012[14] as tabulated below:
Socio-Economic Category Monthly Income (Rs)
Upper ≥ 32,050
Upper Middle 12020-32,049
Middle/Lower Middle
Income 12,019-8,010
Lower/Upper Lower 8,009-4,810
Lower 4,809- 1,600/ and less
*Revised Kuppuswamy scale 2012.
Because of the convenience, we have merged upper middle and Middle/lower Middle income to a category of middle SES, in the same way lower SES comprises of lower/upper lower and lower income.
B. Anthropometry i) Height
A stadiometer was used to measure the height of the children. The children were made to stand erect without shoes on a flat floor by the scale with heels together and toes apart. The head was comfortably held erect and the arms were relaxed and held in a natural manner. The head piece of the stadiometer was lowered slowly and was placed in the sagital plane over the head of the child applying a slight pressure to reduce the thickness of hair and make contact with the top of the head. Using this technique, the height of the children was measured to the nearest 0.1 cm accuracy.[15]
ii) Weight
Body weight is the most widely used and the simplest reproducible anthropometric measurement for the evaluation of nutritional status of young children. Body weight of all the children was measured using a digital weighing balance. The balance was validated using known weight for every 5 readings. The children were
made to stand erect with minimum clothing and barefoot. The weight was noted to the nearest 0.1 kg.[15]
iii) BMI Percentiles
BMI, age and sex, specific percentile values for children both boys and girls were used to find out Underweight, Normal, Overweight, and Obese. In clinical practice, BMI for age growth charts can be used to determine an adolescent‟s BMI for age percentile and to track relative weight status through childhood to adolescence.
Percentile BMI Category*
<5th Percentile Underweight ≥5th
to <85th
Percentile Normal
≥85th
Percentile to <95th Percentile
Overweight/At risk
≥95th
Percentile Obesity
*CDC, 2000 [16]
BMI percentiles were calculated using the online calculator for grouping the selected pre-adolescents according to the BMI category.
4. Cognitive Assessment
A cognition test assessment was done to find out the relationship between snack consumption and better cognition level with the help of (National psychometrics, Psychological Corporation Pune). Pramila Ahuja‟s Group Test of Intelligence (PGTI) (English) for the children from 9 to 13 years for both gender including seven sub tests, scrambled words, analogies, classification, disarranged, sentences, same opposite, series and best answers with the time limit of 35 minutes which is standardized on 10,373 students purchased from National psychometrics, Psychological Corporation Pune.[17] Classification of deviation IQ`s can be classified in each categories. The suggested classification of Revised Stanford-Binet[18] has been followed in the present investigation.
Deviation IQ`s Classification
140 and above Very superior
120-139 Superior
110-119 High average
90-109 Normal/Average
80-89 Low average
70-79 Borderline Defective
Below 70 Mentally Defective
5. Association of cognition and snack consumption
Statistical analysis
All data analyses were performed using Statistical Package for the Social Sciences (SPSS) version 16.0.
Ethical statement
The study was granted approval by the Ethics Review Committee of the PSG Institute of Medical Research, Coimbatore. Consent forms, in both English and Tamil, for all students of grades 5 to 7th were signed by either
of the parents of the children, and data were collected only from them.
RESULTS AND DISCUSSION
1. Age and Gender of the selected children
Age is the length of time during which a being or thing has existed. School children‟s age and gender are tabulated on the basis of school board and illustrated below.
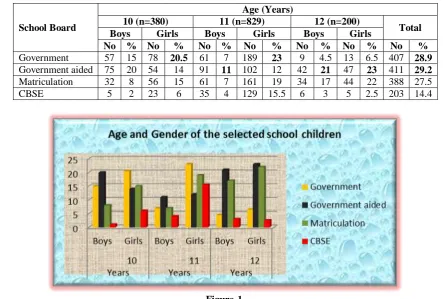
Table-I: Age and Gender of the selected School children (N=1409).
School Board
Age (Years)
10 (n=380) 11 (n=829) 12 (n=200)
Total
Boys Girls Boys Girls Boys Girls
No % No % No % No % No % No % No %
Government 57 15 78 20.5 61 7 189 23 9 4.5 13 6.5 407 28.9
Government aided 75 20 54 14 91 11 102 12 42 21 47 23 411 29.2
Matriculation 32 8 56 15 61 7 161 19 34 17 44 22 388 27.5
CBSE 5 2 23 6 35 4 129 15.5 6 3 5 2.5 203 14.4
Figure-1.
Majority of the school children selected for the study were in government aided (29.2%), followed by government (28.9%) and matriculation (27.5%)schools, we could note a slight low numbers from CBSE schools as the permission was not granted.
2. Socio-economic background of selected school
children
Individual‟s health and nutrition status is greatly influenced by family background, so it is tabulated below.
Table –II: Socio-economic background of selected school children (N=1409).
S. No Socio-Economic Details
School Children Government
(n=407)
Government Aided(n=411)
Matriculation (n=388)
CBSE (n=203)
No % No % No % No %
1. Living Area
- Rural
- Urban
259 148
64
36
277 134
67
33
132 256
34
66
56 147
28
72 χ2
= 159.492, df = 3, Sig. = S**
2. Religion
- Hindu
- Christian
- Muslim
- Others
208 124 75
-
51
30.4 18.4 -
112 182 116 -
27
44
28 -
153 122 110 3
39
31 28 0.7
150 28 21 4
74
χ2
= 149.152, df = 9, Sig. = S**
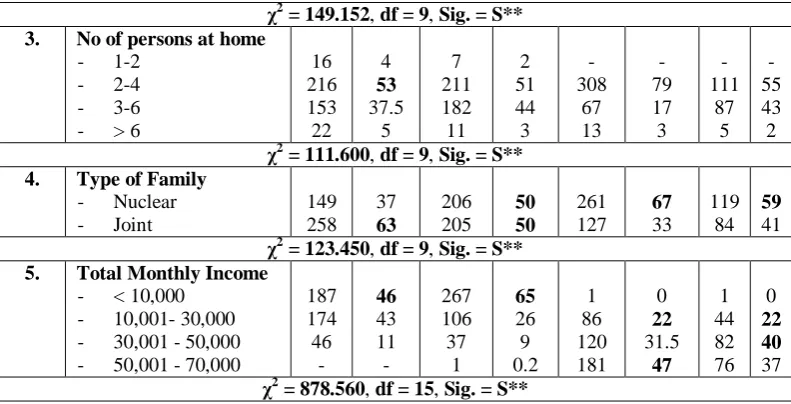
3. No of persons at home
- 1-2
- 2-4
- 3-6
- > 6
16 216 153 22
4
53
37.5 5
7 211 182 11
2 51 44 3
- 308
67 13
- 79 17 3
- 111
87 5
- 55 43 2
χ2
= 111.600, df = 9, Sig. = S**
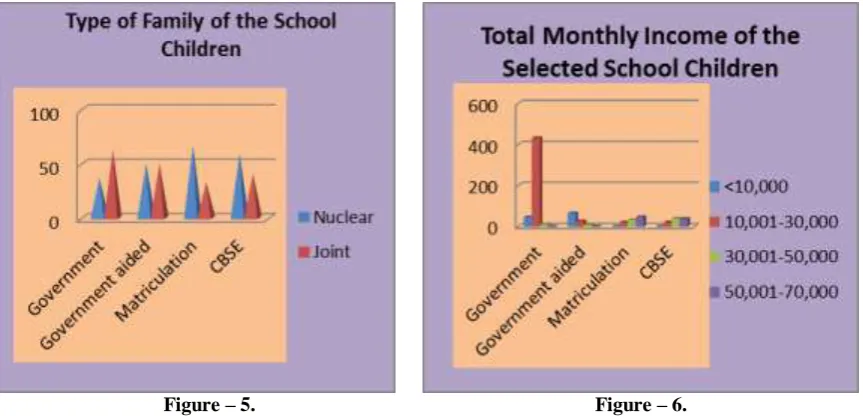
4. Type of Family
- Nuclear
- Joint
149 258
37
63
206 205
50 50
261 127
67
33 119
84
59
41
χ2
= 123.450, df = 9, Sig. = S**
5. Total Monthly Income
- < 10,000
- 10,001- 30,000
- 30,001 - 50,000 - 50,001 - 70,000
187 174 46
-
46
43 11 -
267 106 37
1
65
26 9 0.2
1 86 120 181
0
22
31.5
47
1 44 82 76
0
22 40
37
χ2
= 878.560, df = 15, Sig. = S**
S**- Significance at 1% level, S*- Significance at 5% level, NS – Not Significant
Figure – 2.
Figure – 5. Figure – 6.
The above table clearly depicts that rural adolescents prefer nearby government aided (55%) and government school going adolescents (53%) whereas urbanities select matriculation (59%) schools. Hindu religion is highly prevalent among south India, which is again confirmed from our study. The selected school going adolescent‟s family dwell as nuclear family as we could note that majority of the family comprises only 2-4 members. Family income of Rs.≤10,000/- is noted among government and government aided school adolescents
whereas matriculation adolescent‟s family income was between Rs. 30,000/-70,000 per month.
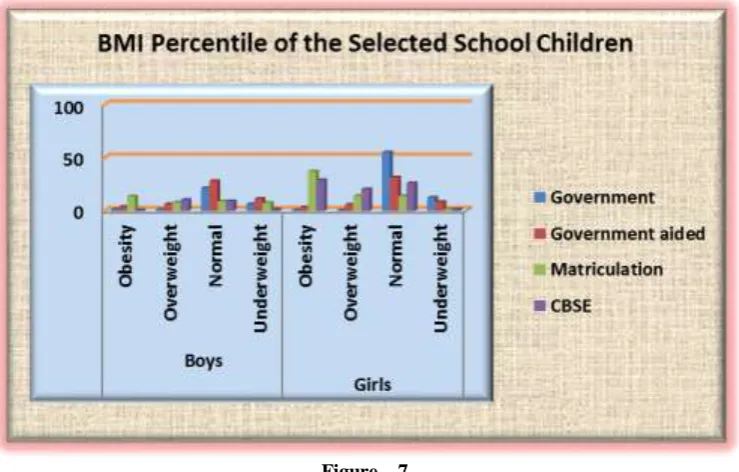
3. Distribution of BMI Percentiles of the Selected
School Children
The best indicator of adolescents‟ well-being is growth which acts as a single measurement that best defines the nutritional and health status of children and helps to estimate the quality of life of population at large in the community. BMI percentiles of the adolescents and groups are given in table
Table III: Distribution of BMI Percentiles of Selected School Children (N=1409).
BMI Percentile
Age Years
School Children Government
(n=407)
Government aided (n=411)
Matriculation (n=388)
CBSE (n=203)
Boys Girls Boys Girls Boys Girls Boys Girls
No % No % No % No % No % No % No % No %
> 95th
Percentile (Obesity)
10 2 0.4 1 0.2 3 0.7 2 0.4 14 3.6 29 7 - - 11 5
11 5 1 1 0.2 12 3 9 2 32 8 98 25 1 0.4 46 23
12 - - 1 0.2 1 0.2 4 1 8 2 18 5 1 0.4 2 1
85-95th percentile (Overweight)
10 5 1 1 0.2 14 3.4 8 2 7 2 13 3 2 1 4 2
11 2 0.4 1 0.2 8 2 10 2.4 12 3 26 7 19 9 37 18
12 - - - - 5 1 6 1.4 11 3 14 4 1 0.4 1 0.4
5th - 85th Percentile (Normal)
10 39 9.5 62 15 39 9 36 9 9 2 12 3 2 1 8 4
11 42 10 156 38 56 13 66 16 17 4 32 8 12 6 43 21
12 7 2 10 2 26 6 27 6.5 12 3 11 3 4 2 2 1
<5th Percentile (Underweight)
10 11 3 15 4 19 5 8 2 2 0.5 2 0.5 1 0.4 - -
11 12 3 31 8 15 4 17 4 - - 5 1 3 1 3 1.4
12 2 0.4 2 0.4 10 2.4 10 2.4 3 0.7 1 0.2 - - - -
Figure – 7.
The results show that the overweight and obesity was more prevalent among matriculation and CBSE school children. We could see majority of the government and government aided children fall under the normal category.
4. Interconnection between cognition and various
factors relating to food consumption and life style pattern
Cognitive assessment of the selected school children is given in the table below:
Table IV: Cognitive assessment of the selected school children (N=1409).
Variables Deviation IQ`s
Superior (120-140)
High Average (110-119)
Normal (90-109)
Low Average
(80-89)
Borderline Defective
(70-79)
Mentally Defective (<70)
No % No % No % No % No % No %
1 School
Government (n=407) 29 7 73 18 158 39 64 16 53 13 30 7
Government aided(n=411) 44 11 92 22 167 41 62 15 41 10 5 1
Matriculation(n=388) 50 13 87 22 163 42 63 16 22 6 3 0.8
CBSE(n=203) 21 10 39 19 88 43 31 15 16 8 8 4
X2=56, Df = 15, S**
2 Age (Years)
10 (n=380) 41 11 77 20 158 42 60 16 32 8 12 3
11 (n=829) 85 10 168 20 346 42 117 14 82 10 31 4
12 (n=200) 18 9 46 23 72 36 43 21.5 18 9 3 1.5
X2=11, Df = 10, NS
3 Gender
Boys (n=508) 50 10 105 21 200 39 89 17.5 48 9 16 3
Girls (n=901) 94 10 186 21 376 42 131 84 9 30 30 3
X2=2.4, Df = 5, NS
4 Type of Diet
Vegetarian (n=311) 38 12 53 17 128 41 51 16 34 11 7 2
Non-Vegetarian (n=771) 83 11 160 21 310 40 119 15 68 9 31 4
Ova-Vegetarian(n=327) 23 7 78 24 138 42 50 15 30 9 8 2
X2=13 Df = 10, NS
5 BMI category
Underweight (n=174) 10 6 41 24 67 38.5 25 14 25 14 6 3
Normal (n=676) 70 10 139 21 269 40 109 16 64 9.5 25 4
Obesity (n=392) 42 11 84 21 171 44 58 15 25 6 12 3
X2 =19 Df = 15, NS
6 Physical activities
i. Bicycle
< 30min (n=925) 23 2 166 18 296 32 401 43 27 3 12 1
30-60minutes (n=204) 11 5 19 9 101 49.5 40 20 22 11 11 5
X2 =21, Df = 5, NS ii. Yoga
< 30min (n=869) 32 4 152 17 264 30 392 45 19 2 10 1
30-60minutes(n=450) 20 4 91 20 114 25 129 29 67 15 29 6
X2 =11, Df = 15, NS iii. Sports
30-60minute(n=796) 69 9 44 5.5 159 20 346 43 142 18 36 4.5
<30 minutes (n=440) 21 5 35 8 110 25 201 46 54 12 19 4
X2 =8.3, Df = 10, NS
7 Snacking Frequency
Daily (n=1217) 124 10 258 21 490 40 191 16 112 9 42 3
4-5 times/day(n=161) 19 12 29 18 70 43.5 22 14 17 11 4 1
2-3 times/day (n=27) 1 1 4 15 12 4 7 26 2 7 1 4
Once/week (n=5) - - - - 4 8 - - 1 20 - -
X2 =11, Df = 15, NS
8 Number of meals& snacks/day
3 meals+2 snacks(n=507) 160 31.5 108 21 91 18 78 15 51 10 19 4.5
3 meals+1 snacks(n=175) 39 22 37 21 26 15 25 14.5 23 13 25 14.5
2meals+2,3snacks(n=727) 115 16.5 138 19 171 23.5 127 17 116 16 60 8
X2 =19, Df = 20, NS
9 Meal skipping
Breakfast (n=206) 56 27 43 21 36 17.5 30 14.5 21 10 20 10
X2 =42, Df = 20, S**
Lunch (n=116) 31 27 22 19 18 15 16 14 17 15 12 10
X2 =41, Df = 10, S**
Dinner (n=67) 18 27 13 19 12 18 10 15 8 12 6 9
X2 =14, Df = 15, NS 10 Screen Time/day
Don` t watch + < 1hour (n=751) 136 18 155 21 142 19 154 20 111 15 53 7
1-2 hours (n=587) 132 22 115 19.5 127 22 89 15 27 4.5 97 17
3-4 hours +more(n=71) 15 21 18 25 14 20 12 17 7 10 5 7
X2 =15, Df = 20, NS 11 Playing videos games/day
Don`t play (n=439) 132 30 101 23 78 18.5 59 13 50 11 19 4.5
<1 hour (n=890) 114 13 173 19 264 30 121 13.5 120 13.5 98 11
1- 2 hours/more (n=80) 21 26 10 12.5 18 22.5 14 17.5 12 15 5 6.5
X2 =34, Df = 15, S**
NS- Not significant, S**-Significant at 1% level, S*- Significant at 5% level
From the above table we could note 1% level significant difference in cognition among the schools, meal skipping pattern especially breakfast, lunch and number of hours of playing videos.
Skipping breakfast during pre adolescence (10-12 years) leads to transient decrease in late morning cognitive performance.[19]
CONCLUSION
Poor nutritional quality snacking at school and at home was not associated with cognition function but postively associated with meal skipping pattern. These results may
have important implications for the promotion of healthy lifestyles by educational agencies and schools also associating healthy snacking with educational outcomes can perhaps enhance the value of having responsible health behaviors and boost motivation for a healthy way of life.
ACKNOWLEDGEMENTS
Funding Sources: None.
Author Disclosure
The author declares no conflict of interest.
Ethical Clearance
The study was granted approval by the Ethics Review Committee of the PSG Institute of Medical Research, Coimbatore. Consent forms, in both English and Tamil, for all students and the data were collected only from them.
REFERENCES
1. Bellisle F. Effects of diet on behavior and cognition in children. Br J Nutr, 2004; 92: S227-32.
2. WHO (2000). Nutrition for health and development. World Health Organization; Geneva, 2000.
3. Taras, H. Nutrition and student performance at school. J Sch Health, 2005; 75: 199-213.
4. Gutierrez J, Benna N, Fernandez K, Shanahan A, Cruz D, A correlational investigation of the relationships among nutrition-related attitudes and behavior, body mass, and learning and verbal memory performance in college students. New School Psychol Bull, 2013; 10: 37-43.
5. Bryan J, Osendarp S, Hughes D, Calvaresi E, Baghurst K, van Klinken JW, Nutrients for cognitive development in school-aged children. Nutr Rev, 2004; 62: 295-306.
6. Stahl LA, Begg DP, Weisinger RS, Sinclair AJ, The role of omega-3 fatty acids in mood disorders. Curr Opin Investig Drugs, 2008; 9: 57-64.
7. Itua I, Naderali EK. Review: omega-3 and memory function: to eat or not to eat. Am J Alzheimers Dis Other Demen, 2010; 25: 479-82.
8. Spencer JP. The impact of fruit flavonoids on memory and cognition. Br J Nutr, 2010; 104: S40-7. 9. Wolraich M, Milich R, Stumbo P, Schultz F, Effects
of sucrose ingestion on the behavior of hyperactive boys. J Pediatr, 1985; 106: 675-82.
10. Hu FB, Dietary pattern analysis: a new direction in nutritional epidemiology. Curr Opin Lipidol, 2002; 13: 3-9.
11. Sofi F, Cesari F, Abbate R, Gensini GF, Casini A, Adherence to Mediterranean diet and health status: meta-analysis. Br Med J, 2008; 337: a1344.
12. Akbaraly TN, Brunner EJ, Ferrie JE, Marmot MG, Kivimaki M, Singh-Manoux A, Dietary pattern and depressive symptoms in middle age. Br J Psychiatry, 2009; 195: 408-13.
13. Wiles NJ, Northstone K, Emmett P, Lewis G. „Junk food‟ diet and childhood behavioural problems: results from the ALSPAC cohort. Eur J Clin Nutr, 2009; 63: 491-8.
14. Mishra D, Singh HP, Kuppuswamy‟s socioeconomic status scale - A revision. Indian J Pediatr, 2003; 70: 273–4.
15. Brahmam, G.N.V, Laxmaiah, A. Mallikharjuna and Reddy G., Methodology of Assessment of Diet and Nutritional Status of Community. Manual of
National Institute of Nutrition, Hyderabad, 2005; 7-9, 13, 16.
16. CDC growth charts: United States Advance Data from Vital and Health Statistics. no. 314 National Center for Health Statistics, Atlanta, 2000.
17. Ahuja, Pramila, A study of Practice effect on A Group of Intelligence”, Journal of Educational Research and Extension, January, 1971; 7(3): 179-183.
18. Terman, L.M, and Merrill, M.A, Stanford-Binet Intelligence Scale: Manual for the Third Revision: FormL-M, Houghton Mifflin Company Boston, 1960; 18.