An
in vitro
trial to study the effect of inclusion of different levels of coconut oil on
sheep rumen methanogenesis and fermentation processes
Tisa Mukharji, Aakash Srivastava, Meera Srivastava*
Post Graduate Department of Zoology, Govt. Dungar College, Bikaner-334001, (Rajasthan) India
Article Information Received 12 October 2014
Received in revised form 30 Dec 2014 Accepted 30 Dec 2014
Abstract
An in vitro trial was conducted in fermentation vessels under anaerobic conditions using composite feed-1 and composite feed-2 with inclusion of different levels of Coconut Oil (CO) along with buffered rumen liquor of sheep to observe the effects of oil on rumen methanogenesis and fermentation. The Composite Feed-1(CF-1) consisted of 40% of concentrate and Composite Feed-2 (CF-2) had 25 % of concentrate. The different levels of CO used were 0.5,1 and 2 µl/ml. Among the gas production and methane concentration parameters the inclusion of CO showed a significant decrease of 38.67%. A non significant effect on gas production was noted with the inclusion of CO in CF-2. Further, a decrease in total gas production and methane concentration was observed which was highly pronounced in CF-1 as compared to CF-2. The rumen digestibility by inclusion of CO in CF-1 and CF-2 decreased significantly (P < 0.01) from control. The inclusion of CO in CF-2 did not affect Ammonia Nitrogen (NH3 –N) concentration, while in
CF-1 the CO inclusion increased the NH3 –N concentration. The inclusion of CO decreased the
Total volatile fatty acid(TVFA) concentration significantly (P < 0.01). In both the diets namely CF-1 and CF-2 the A:P ratio was unaffected by CO inclusion. The inclusion of CO in CF-CF-1 had a non significant effect in pH. However, the inclusion of CO in CF-1 and CF-2 decreased the protozoa number significantly (P < 0.01). Inclusion of oil tended to decrease Gas production (GP), Metabolizable energy (ME), Short Chain Fatty Acid (SCFA), True Degradability of Dry Matter (TDDM) and Microbial Biomass Production (MBP). The effect was more pronounced when CO level was 1.0µl/ml or higher. From the above gas production and fermentation parameters noticed in two diets CF-1 and CF-2 with inclusion of different levels of CO, it can be envisaged that increasing the proportion of concentrate in diets and using CO as a feed additive increases the rumen efficiency by reducing the methane concentration and gas production.
Keywords:
Sheep, Rumen, In vitro, Coconut oil, Methanogenesis, Fermentation
*
Corresponding Author: E-mail: [email protected] Tel.: +919414324806
1 Introduction
Greenhouse gases such as carbon dioxide, methane, nitrous oxide and ozone contribute to climate change and global warming through their absorption of infrared radiation in the atmosphere1. One of the trace gases is Methane and the total global concentration of this gas is estimated to be 1774 ± 1.8 parts per billion (ppb), and since 1998 it has increased by 11 ppb. Because of its global warming effect it is termed as a greenhouse gas, has a atmospheric lifetime of 12-years. Carbon dioxide ranks first among the anthropogenic green house gases, which accounts for 16% of all the greenhouse gas emissions and methane is classified as the second largest2 . Also, methane
can increase ozone in the troposphere region of the atmosphere where the greenhouse effect occurs, and increases stratospheric water vapor, both of which can add to the radioactive force of the gas by approximately 70%1. Globally, 50-60% of methane emissions are from the agricultural sector, specifically from livestock production operations; the principal source of methane is from ruminant animals3,4. Domesticated ruminants, such as cattle, sheep, and goats
produce as much as 86 million metric tonnes (Tg) of methane per annum5.. Nearly half of it comes from five countries namely, India (10.27 Tg), Brazil (7.46 Tg), USA (6.99 Tg), China (4.37 Tg) and Russia (4.02 Tg) while most of the remainder comes from over
UK Journal of Pharmaceutical and Biosciences
Available at www.ukjpb.com
UK J Pharm & Biosci, 2014: 2(6); 50 hundred countries6. Three high methane emitter states of India are
Uttar Pradesh (14.9%), Rajasthan (9.1%) and Madhya Pradesh (8.5%)7. Methane is produced in the rumen as a product of normal
fermentation of feedstuffs. Due to exhalation of methane into the atmosphere,depending upon the diet, a loss of ingested feed-derived energy of approximately 2-12% is suffered by the ruminant8. The
methane produced from the rumen is primarily emitted from the animal by eructation. Sheep is one of the important ruminant livestock for global agricultural economy and contributes to sustainable agriculture. Like another ruminant, it has rumen, reticule and abomasums and the fermentation process take place in sheep rumen leading to generation of Methane. Methane is produced in the rumen and hindgut of sheep by a group of Archaea known collectively as methanogens, which belong to the phylum Euryarcheota.
Modification of ruminal fermentation using feed additives has proven to be a useful strategy to improve production efficiency in dairy cattle. The potential use of natural antimicrobials such as herbs and plant extracts are being explored and evaluated by workers. Workers9 have suggested that reduction in methane emission by up
to 80% in vitro and about 25% in vivo might be possible with an addition of oils to the diets. . Scientists10,11 have explored Coconut oil for methane abatement experiments and the oil has been found to induce significant reductions in methanogenesis and has gained popularity among scientific community, although depending on the inclusion level, the extent of the reduction in methane emission varies from 13–73%, depending on diet, and also experimental ruminant species . Coconut oil has been noted to directly inhibit rumen methanogens, probably by changing their metabolic activity and composition9. Further, it is expected that this oil would provide
significant reduction in methanogenesis in vivo since it has a ratio lauric to myristic acid of 2.6:1.0, similar to the effective ratios for methane abatement of 4:1, 3:2, and 2.5:1.0, found in vitro 12
Therefore, the present study on evaluation of anti-methanogenic activities in rumen of sheep (in vitro) induced by coconut oil was undertaken to investigate the effect of eucalyptus oil for reducing enteric methane emission.
2 Materials and method
2.1 Animals
The present study was carried out in the laboratory of Central sheep and Wool Research Institute, Arid Region Campus, Beechwal, Bikaner where the experimental animal sheep, Ovis aries were being maintained. They were kept here in different sectors, sent for grazing in the fields and water was provided ad lib. Five experimental animals were chosen for the study from which the rumen liquor was collected for investigations.
2.2 Preparation of composite feed-1 (CF-1) and composite feed-2 (CF-2)
The mature grass of Sewan (L. sindicus) was harvested from the experimental farm of Arid Region Campus, Central Sheep and Wool Research Institute, Bikaner. A sewan based two types of composite feed mixtures viz., CF-1 and CF-2 were prepared that had roughage to concentrate ratio of 60:40 and 75:25 respectively. The concentrate mixture was composed of maize, groundnut cake (GNC), barley, mineral mixture and common salt. Besides these, CF-2 also consisted of wheat bran as given in Table 1. Further, they were used as the substrate for in vitro experiments. The feed ingredients were oven dried at 70 ºC and ground to pass through 1.5 mm sieve to prepare complete feed subjected to in vitro studies. In this prepared composite feed mixture, coconut oil was added at three level of inclusion (0.5, 1 and 2%).
2.3 Chemical analysis of composite feeds
The parameters determined included organic matter13; Neutral detergent fibre (NDF), Acid Detergent Fibre (ADF) and Hemicellulose, cellulose and lignin14 , while, cellulose was calculated as a loss during 72% acid treatment; Hemicellulose was determined by the difference between neutral detergent fibre and acid detergent fibre. The other parameters ascertained were Crude protein13 Condensed Tannin (CT)15 and Total phenol16 .
2.4 In vitrogas production
The incubation media17 was prepared to adjudge in vitro gas production. .
2.5 Preparation of inoculums
Rumen liquor was collected using a stomach tube under low vacuum from five mature sheep managed on L. sindicus (sewan), dominated pastured and each receiving 300g/d concentrate supplement. The collected rumen liquor was immediately transferred into pre-warmed thermo flask and was taken to laboratory. The rumen liquor was filtered through two layers of muslin cloth, before mixing with buffer under carbon dioxide flux. All the solutions were poured in Woulff flask, mixed with magnetic stirrer, warmed to 39ºC in water bath with a thermometer and were refluxed with carbon dioxide as shown in after solution became clear, rumen liquor was added to it (Table 2).
2.6 In vitrogas production test
The gas production was determined17, in vitro dry matter degradability was determined18, OMD%, ME and SCFA were
UK J Pharm & Biosci, 2014: 2(6); 51
Table 1 Physical and chemical composition of composite feed-1 & 2 (g/Kg DM)
Attributes Quantity in feed-1 Quantity in feed-2
Physical composition
Sewan 600 750
Maize 150 10
Groundnut cake (GNC)
140 30
Barley 90 10
Mineral mixture
10 10
Salt 10 10
Wheat bran - 180
Chemical composition
OM 890 878
CP 136 103
NDF 601 642
ADF 333 455
Cellulose 127 303
Hemicellulose 167 187
Lignin 186 41
Condensed tannins
0.24 0.3
Total phenols 7.14 8.93
Organic matter (OM), Crude protein (CP), Neutral detergent fibre (NDF), Acid detergent fibre (ADF).
Table 2 Preparation of inoculums
Solution Quantity (ml)
Distilled water 365
Micro mineal solution 0.1
Buffer solution 183
Macro mineral solution 183
Reduction solution 38.8
Rumen liquor 330
Total volume 1099.9
After complete rumen liquor buffer was prepared its pH was determined using digital pH meter
2.7 Estimation of methane on gas liquid chromatography 2.7.1 Standard
The standard gas for methane estimation consisted of 50% methane and 50% carbon dioxide of this mixture 10l was injected with help of 100 l Hamilton gas tight syringe in the column.
2.7.2 Sample
The gas produced in fermentation was directly used for methane estimation by injecting 10 l of sample gas in methane column as shown in Plate 5.
Condition for methane estimation
A. (i) The detector used was flame ionizing detector (FID)
(ii) Stainless steel column was used
B Flow rate
(i) Nitrogen 5 kg/cm2
(ii) Hydrogen 2 kg/cm2
(iii) Air 2 kg/cm2
The rate of gas flow was regulated by pressure valves provided in cylinder and after opening the valves of cylinder, the nitrogen cylinder was opened and was made to flow alone till FID and column oven reached to temperature of 60 ºC after that hydrogen and air valves were opened and flame was lighted with flame lighter, then sample was injected in column at injecting port.
2.7.3 Temperature Injector oven 50ºC
Column oven 60ºC
Detector over 60ºC
Sample size 100ml
2.7.4 Calculation
After completing the estimation of methane gas the hydrogen and air cylinder were closed then cooling program was switched on, when oven reached to temperature below 50ºC, oven gates were opened and nitrogen supply was closed down and power supply was switched off.
2.7.5 Protozoan count
The Protozoa number was also determined or counted20 .
2.7.6 Chemical analysis of rumen liquor
Estimation of volatile fatty acid was done employing gas liquid chromatography; Total-N13 and Ammonia-nitrogen content21 were other rumen parameters estimated.
UK J Pharm & Biosci, 2014: 2(6); 52 The analysis of data was done using SPSS version 10.0 and was
subjected to one way ANOVA and significant differences were separated by using Duncan's Multiple Range test.
3 Results
An in vitro trial was conducted in fermentation vessels using composite feed-1 and composite feed 2 and adding different levels of coconut oil along with buffered rumen liquor of sheep to observe the effect of oil on rumen methanogenesis and fermentation. The chemical composition of CF-1 and CF-2 are presented in Table 1.
The effect of adding various levels of coconut oil (CO) on CF-1 and CF-2 related to gas production and digestibility are presented in Tables 3 and 4. The effect of adding various levels of coconut oil (CO) on total gas productions at different hours is depicted in Figs.1 and 2. The total gas production (ml/g DM) in respect to various levels of CO viz., 0, 0.5,1 and 2 (µl/ml) was observed to be 147.60, 118.10, 106.60 and 102.10 respectively. While comparing the effect of three different levels of CO (0.5, 1 and 2 µl/ ml) on total gas production with control, it was found to decrease significantly (p < 0.01). But when the three treatments were compared among themselves then after 1 µl/ml the decrease was found to be non significant. Methane gas concentration was recorded to be 22.23, 19.50, 18.44, and 16.24 at 0, 0.5,1 and 2 µl/ml level of CO respectively. On comparing with control it was observed at 1 and 2 µl/ml levels of CO the methane gas concentration significantly decreased, while at 0.5 µl/ml level of CO the decrease in methane gas concentration as found to be non significant. While comparing the methane production resulting as an addition of CO at three levels it was found that 0.5 µl/ ml and 1 µl/ml and 1 µl/ml and 2 µl/ ml differed non-significantly with each other while a significant difference was observed between 0.5 µl/ml and 2 µl/ml treatments. The metabolisable energy (ME) and short chain fatty acid (SCFA) in respect to various levels of CO viz.,0,0.5,1 and 2 (µl/ml) in CF-1 was observed to be 6.97, 5.75, 5.86 and 5.58 (MJ/Kg DM) ; while SCFA was noted to be 0.5619,0.3621,0.3798 and 0.3343(µmol) respectively. It was found that three levels of CO showed a significant (p < 0.05) decrease in ME and SCFA compared to control, while the decrease in ME and SCFA was not significant between three levels of CO. The MBP was observed to be 551.02, 474.60, 438.32, and 432.20(g/kg) at 0, 0.5, 1 and 2 (µl/ml) level of CO respectively. While comparing with control the three levels of CO showed a significant (p<0.05) decrease in MBP, but when three treatments were compared among themselves the decrease in MBP was found to be non significant after 1 µl/ml level of CO. The TDDM in respect to various levels of CO viz., 0, 0.5, 1 and 2 (µl/ml) in CF-1 was recorded to be 630.25, 540.60, 507.80 and 501.30 (g/kg DM); the TDOM to be 607.12, 510.92, 476.35 and 465.72(g/kg DM); and TDNDF to be 384.8, 235.60, 181.02 and 170.22(g/kg DM) respectively. A significant decrease in TDDM, TDOM and TDNDF at
all three levels of CO with respect to control was observed. After 1 µl/ml level of CO, a non significant decrease was observed while comparing amongst the three treatments of CO. The effect of adding various levels of CO on CF-1 related to fermentation are given in Tables 5 and of CF-2 in Table 6. The effect of adding various levels of CO in CF-1 on concentration of NH3- N and total N are shown Fig
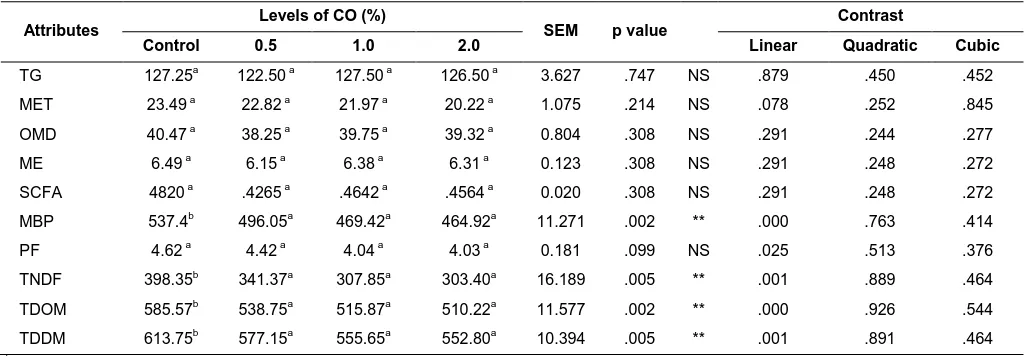
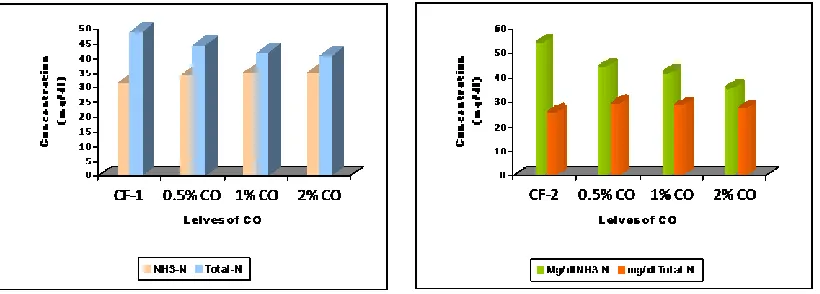
3 and of CF-2 in Fig 5. The concentration of NH3- N was found to be
31.62, 34.25, 35.10 and 35.05 (mg/dl); and total N was 49, 44.62, 42 and 41.12 (mg/dl) at 0, 0.5, 1 and 2 (µl/ml) levels of CO respectively. A significant decrease (p < 0.01) was found in concentration of NH3-
N at three levels of CO compared to control, where as a non significant decrease was found amongst the three treatments. The three treatments of CO showed a non significant decrease in concentration of total N with respect to control and between each other. The effect of adding various levels of coconut oil (CO) in CF-1 on TVFA and pH are shown in Fig 7 and of CF-2 in Fig 8. The concentration of TVFA, Acetate, Propionate, Butyrate, and A:P ratio was observed to be 3.79, 3.88, 3.80 and 3.21(m mol/g) ; of acetate to be 2.64, 2.67, 2.62 and 2.23 (mm/dl); of propionate to be 0.8985, 0.9457, 0.9105 and 0.7481(mm/dl); of butyrate to be 0.2283, 0.2532, 0.2468 and 0.2189 (mm/dl); of A:P ratio to be 2.96, 2.82, 2.88 and 2.98 at 0, 0.5, 1 and 2 (µl/ml) levels of CO respectively. Only 2 µl/ml levels of CO showed a significant decrease ( p < 0.01) in concentration of TVFA, acetate and propionate compared to control, where as the other two levels (0.5 and 1 µl/ml) showed a non significant effect with control. While comparing the three treatments of CO among themselves the decrease in TVFA, acetate, propionate was noted to be significant between 1 and 2 µl/ml and between 0.5 and 2 µl/ml of CO where as non significant decrease was observed between 0.5 and 1 µl/ml. The three treatments of CO showed a non significant decrease in concentration of butyrate and A:P ratio with control and between each other. The pH in respect to various levels of CO viz., 0, 0 5, 1 and 2 (µl/ ml) in CF-1 was observed to be 6.82, 6.93, 6.82 and 6.81 respectively. When compared the three treatments of CO showed a non significant effect (p < 0.05) on pH with respect to control and among them. The effect of adding various levels of coconut oil (CO) in CF-1 and CF-2 on Protozoa number have been given in Figs. 4 and 5, respectively. The protozoa count in respect to various levels of CO namely 0, 0.5,1 and 2 (µl/ml) were found to be 26.94, 19.16, 13.05 and 10(N*105/dl) respectively. When
compared the three treatments of CO (0, 0.5, 1 and 2 µl/ml) showed a significant decrease in protozoa number with control and also amongst them.
4 Discussions
4.1 Gas Production and Methane Production (GP & CH4)
UK J Pharm & Biosci, 2014: 2(6); 53 total gas production upto 38.67%. Similarly methane gas
concentration also showed decrease in linear manner with CO supplementation upto 4.17% in 1 while the inclusion of CO in CF-2 did not effect the total gas production and methane gas concentration. The results indicates that inclusion of increasing level of CO in CF-1 significantly decreased the total gas production which is similar to the earlier documented22,23,24,25 . Moreover, it has been observed decrease in methane gas production by addition of unsaturated fatty acid essential oil, serve as electron acceptor during
biohydrogenation in rumen. A decrease in total gas production and methane production was highly pronounced in CF-1 which had 40% of concentrate as compared to CF-2 which had 25% of concentrate is in conformation to earlier report26 -who also observed the increase in proportion of concentrate in the diet reduced methane and gas production more efficiently by 7 to 40%. Other outcomes27 also
support the present finding that a reduction in methane production by 33% was observed by addition of 4% canola oil in diet containing 85% concentrates, .
Table 3 The effect of adding various levels of Cocos nucifera (coconut) oil on different attributes of composite feed-1 related to gas production and digestibility when treated with rumen liquor buffer (in vitro)
Attributes Levels of CO (%) SEM p value Contrast
Control 0.5 1.0 2.0 Linear Quadratic Cubic
TG 147.60c 118.10b 106.60a 102.10a 2.557 .000 ** 0 .999 .282
MET 22.23c 19.50bc 18.44ab 16.24a 0.941 .006 ** .171 .276 .298 OMD 43.67b 35.65a 36.35a 34.55a 1.474 .004 * .000 .390 .434 ME 6.97b 5.75a 5.86a 5.58a 0.225 .004 * .000 .394 .429 SCFA 0.5619b 0.3621a 0.3798a 0.3343a 0.036 .004 * .000 .394 .429 MBP 551.02c 474.60b 438.32a 432.20a 8.226 .000 ** .000 .940 .160 PF 4.11a 4.32ab 4.48ab 4.57b 0.119 .088 NS .016 .588 .781
TNDF 384.8c 235.60b 181.02a 170.22a 10.418 .000 ** .000 ,400 .131
TDOM 607.12c 510.92b 476.35a 465.72a 6.660 .000 ** .000 .577 .185
TDDM 630.25c 540.60b 507.80a 501.30a 6.261 .000 ** .000 .401 .131
Table 4 The effect of adding various levels of Cocos nucifera (coconut) oil on different attributes of composite feed-2 related to gas production and digestibility when treated with rumen liquor buffer (in vitro)
Attributes
Levels of CO (%)
SEM p value
Contrast
Control 0.5 1.0 2.0 Linear Quadratic Cubic
TG 127.25a 122.50 a 127.50 a 126.50 a 3.627 .747 NS .879 .450 .452 MET 23.49 a 22.82 a 21.97 a 20.22 a 1.075 .214 NS .078 .252 .845 OMD 40.47 a 38.25 a 39.75 a 39.32 a 0.804 .308 NS .291 .244 .277
ME 6.49 a 6.15 a 6.38 a 6.31 a 0.123 .308 NS .291 .248 .272
SCFA 4820 a .4265 a .4642 a .4564 a 0.020 .308 NS .291 .248 .272 MBP 537.4b 496.05a 469.42a 464.92a 11.271 .002 ** .000 .763 .414 PF 4.62 a 4.42 a 4.04 a 4.03 a 0.181 .099 NS .025 .513 .376 TNDF 398.35b 341.37a 307.85a 303.40a 16.189 .005 ** .001 .889 .464 TDOM 585.57b 538.75a 515.87a 510.22a 11.577 .002 ** .000 .926 .544 TDDM 613.75b 577.15a 555.65a 552.80a 10.394 .005 ** .001 .891 .464 abc
Means with different superscripts in a row differ significantly (p<0.01); **P<0.01(highly significant), *P<0.05(significant),NS=non significant
UK J Pharm & Biosci, 2014: 2(6); 54
Table 5 The effect of adding various levels of Cocos nucifera (coconut) oil on different attributes of composite feed-1 related to fermentation when treated with rumen liquor buffer (in vitro)
Attributes Levels of CO (%) SEM p
value
Contrast
Control 0.5 1.0 2.0 Linear Quadratic Cubic
NH3-N 31.62b 34.25b 35.10b 35.05a 0.663 .009 * .001 .598 .632
Total-N 49b 44.62ab 42a 41.12a 2.113 .085 NS .014 .805 .716
NH3-N % of Total-N 65.23 b
77.51ab 84.01b 85.40a 4.076 .017 * .002 .915 .606 TVFAs 3.79b 3.88b 3.80b 3.21a 0.094 .001 ** .012 .001 .125 Acetate 2.64b 2.67b 2.62b 2.23a 0.062 .001 ** .005 .001 .103 Propionate .8985b .9457b .9105b .7481a 0.035 .009 * .74 .003 .324 Butyrate .2283 .2532 .2468 .2189. 0.011 .177 NS .880 .036 .644 A:P Ratio 2.96a 2.82a 2.88a 2.98a 0.494 .327 NS .822 .076 .990
Protozoa 26.94d 19.16c 13.05b 10.00a 0.646 .000 ** .000 .002 .031
pH 6.82a 6.93a 6.82a 6.81a 0.075 0.663 NS 0.990 0.299 0.518
Table 6 The effect of adding various levels of Cocos nucifera (coconut) oil on different attributes of composite feed-2 related to fermentation when treated with rumen liquor buffer (in vitro)
Attributes
Levels of CO (%)
SEM p value
Contrast
Control 0.5 1.0 2.0 Linear Quadratic Cubic
NH3-N 25.5 28.07 27.47 26.85 1.323 .573 NS .328 .330 .907
Total-N 54.4c 44.62b 42.00b 35.87a 1.773 .000 ** .000 .203 .532 NH3-N % of Total-N 47.33a 63.28b 65.41b 74.94b 3.669 .002 ** .000 .480 474
TVFAs 4.92 4.36 4.27 3.83 0.358 .249 NS .059 .653 .736 Acetate 3.37 3.06 2.98 2.66 0.076 .245 NS .062 .535 .747 Propionate 1.11 .9160 .8987 .8023 0.103 .229 NS .048 .898 .780 Butyrate .3868 .3515 .3640 .3593 0.024 .535 NS .201 .896 .517 A:P Ratio 3.11 3.34 3.32 3.32 0.100 .377 NS .116 .778 .849 Protozoa 86.11d 73.88c 55.27b 35.83a 0.632 .000 ** .000 .000 .015 pH 6.56a 6.54a 6.57a 6.61a 0.031 .530 NS .434 .220 .977 abc
Means with different superscripts in a row differ significantly (p<0.01); **P<0.01(highly significant), *P<0.05(significant),NS=non significant
Fermentation parameters of ammonia-N (NH3-N=mg/dl), Total nitrogen (Total-N = mg/dl), Total volatile fatty acids (TVFAs= mmol/g), ammonia-n % of Total-N and
population of ciliate protozoa (N*105
/dl) acetate (mm/dl), Propionate (mm/dl) and butyrate (mm/dl) of the experimental diets
0 10 20 30 40 50 60 70 80 90
2hr 4hr 8hr 18hr 24hr 48hr
Hours
To
ta
l g
as
p
ro
d
u
ct
io
n
(m
l/
0.
5g
)
CF-1 CF-1+ 0.5% CO CF-1+1% CO CF-1+2% CO
0 10 20 30 40 50 60 70
2hr 4hr 8hr 18hr 24hr 48hr
Hours
To
ta
l ga
s
p
ro
d
u
ct
io
n
(ml
/0
.5
g)
CF-2 CF-2+ 0.5% CO CF-2+1% CO CF-2+2% CO
UK J Pharm & Biosci, 2014: 2(6); 55
Fig. 3 & 4. Effect of various levels of coconut oil in composite feed-1and feed-2 on concentration of NH3-N and total- N respectively
0 10 20 30 40 50 60 70 80 90
P
ro
zo
to
a
N
u
m
b
er
CF-2 0.5% CO 1% CO 2% CO
Lelves of CO
Protozoa
Fig.5 & 6 Effect of various level of coconut oil in composite feed -1 and feed- 2 on protozoa number respectively
0 1 2 3 4 5 6 7 8
CF-1 0.5% CO 1% CO 2% CO
Lelves of CO
TVF
A
&
p
H
pH TVFA (mmol/g)
0 1 2 3 4 5 6 7
CF-2 0.5% CO 1% CO 2% CO
Lelves of CO
TV
FA
&
p
H
pH TVFA (mmol/g)
Fig. 7 & 8 Effect of various levels of coconut oil in composite feed-1 and feed- 2 on TVFA (mmol/g) and pH respectively
The inclusion of CO in CF-1 decreased the total gas production when its concentration was 1 µl/ml but further there was no significant decrease while the inclusion of CO in CF-2 did not effect the total gas production. This indicates that the total gas production was less effected with inclusion of CO in the diet. A decrease of 73% in methane production by inclusion of 7% CO in diet containing concentrate as compared to forage diet has also been reported earlier11. Dietary supplementation containing higher prortion of concentrate with myristic acid rich in coconut oil reduced methane production has been reported by earlier worker28. Ti has been
suggested that the CO containing medium chain fatty acid has potential to reduce methanogenesis9,29. All these support the present outcomes.
UK J Pharm & Biosci, 2014: 2(6); 56 and is regarded as indicator of carbohydrate degradation as well as
the gas volume is considered to be a good parameter to predict digestibility, fermentation end product and microbial protein synthesis of substrate by rumen microbes in the in vitro system. It has been suggested that the fermentation of carbohydrate to acetate, propionate and butyrate results in gas production and total gas produced reflects to substantial changes in carbohydrate fractions. Gas production is basically the result of fermentation of carbohydrate to acetate, propionate and butyrate30 and substantial changes in carbohydrate fractions were reflected by total gas produced31
suggesting that probably a shift in the proportion of ME and SCFA will be reflected by changes in gas production. The incorporation of CO in both the diets CF-1 and CF-2 decreased MBP significantly (p < 0.01) but reduction was very pronounced in CF-1 containing 40% concentrate which is similar to earlier reports26. The rumen MBP decreased more in diet containing the higher amount of concentrate was also ascertained.
4.3 True digestibilty of neutral detergent fibre (NDF), dry matter (DM) and organic matter (OM)
The inclusion of CO drastically decreased TDDM, TDOM and TDNDF but did not decrease significantly at higher levels. The addition of fats in the diet decreases the fiber digestibility32. The reduction in the digestibility might be due to anti-bacterial effect of essential oil or vegetable oil on rumen micro flora33. This might be truthful for the present study also. The inclusion of CO in CF-1 significantly (p < 0.01) decreased TDNDF, TDOM and TDDM up to 1 µl/ml, while in CF-2 the decrease was significant up to 0.5 µl/ml of CO and further increase in concentration resulted in no significant decrease. These results also reveal indicate that increase in proportion of concentrate in diet causes more reduction in digestibility of feed, which get support from the earlier findings26.. Coconut oil inclusion could depress rumen fibre digestion9. Linear decrease in digestibility with increasing level of CO has also been noted by earlier workers34. Reports35 on the linear decrease in degradability of dry matter and NDF with increasing doses for essential oil are also available.
4.4 Total volatile fatty acid (TVFA) concentration and acetate: propionate (A:P) ratio
By the inclusion of CO in CF-1 the TVFA concentration remained similar upto 1 µl/ml level and reduced significantly at 2 µl/ml level did not effect the A:P ratio, while in CF-2 the inclusion of CO did not effect the TVFA as well as A:P ratio. This is similar to the earlier findings10,36 who, noted that inclusion of CO did not effect TVFA
concentration. No effect in TVFA concentration when sheep were fed with diet 60:40 (silage: concentrate) with 100 mg of essential oil has also been earlier documented37 . The end product of microbial
fermentation is VFA and the main supply of metabolizable energy for ruminants is represented by it has been suggested by some workers38. Therefore, a reduction in these productions would be
nutritionally unfavorable for the animal39. The decrease in TVFA concentration and increase in A: P ratio by inclusion of oils in the diet has also been observed earlier40,41.
The increasing level of peppermint oil reduced the TVFA concentration and increased A: P ratio has earlier been suggested42.Higher A: P ratio accompanied by reduction in vitro methane emission by inclusion of essential oil of clove in diet has been reported43) Adecrease in TVFA by incorporation of higher levels of essential oil in diet which is consistent with their antimicrobial activity has been observed44 and has been suggested
that decrease in TVFA is due to reduction in feed digestibility45. , The effect of essential oils on TVFA and A:P ratio is pH and diet dependent46,47. The author46further suggestedthat at pH 6-7 the total
VFA concentration decreased and A: P ratio increased. A similar reduction in acetate proportion,A:P ratio and increased TVFA at lower pH (5-5.5) has been noted by earelier workers48. Decrease in TVFA with inclusion of essential oil without any change in pH has been found49. Reports on the increase in TVFA production and decrease in A: P ratio in a diet containing more proportion of concentrate compared to forage are also available50. Therefore it
may be suggested that difference in VFA pattern due to essential oil might be due to difference in diet used in different experiments during the present study.
4.5 pH of ruminal fliud
The inclusion of CO in CF-1 and CF-2 did not affect rumen pH during the present investigation. Similar observations were also made earlier32,49 and authors found no change in rumen pH by inclusion of
essential oil in the diet. As pH decreases acid tends to become un-dissociated and more hydrophobic thereby interacting more easily with cell membrane and exerting their antimicrobial effect. Further more bacteria seen to be more susceptible to the effects of essential oils at low pH51. In this study, the pH of in vitro, rumen fluid varied from 6.45 to 7.0 which were within the normal range of rumen pH (6.45 to 7.00). The result indicated that feeding oil had no adverse effect on rumen pH in sheep.
4.6 Ammonia nitrogen concentration (NH3-N)
The inclusion of CO in CF-2 showed no effect on runimal NH3-N
concentration, which is in conformation to the earlier report42 wherein no effect was found on NH3-N concentration by inclusion of
peppermint oil, while, no effect in the rumen NH3-N concentration by
UK J Pharm & Biosci, 2014: 2(6); 57 The inclusion of CO in CF-1 increased the NH3-N concentration
significantly (p < 0.05) during the present study indicating that de-amination activity is not inhibited. This gets support from the earlier findings52 where an increase in NH3-N concentration was
documented in rumen of cattle fed with diet having high proportion of concentrate with supplementation of eugenol and also it was also noticed that deaminase activity was not inhibited.
4.7 Total – N concentration
The inclusion of CO in CF-1 reduced the total –N concentration significantly (p < 0.05) as compared to control, but inclusion of CO in CF-1 did not show any significant decrease. Similar results with respect to be total – N was also observed by addition of CO in CF-2 during the present study. Earlier, a significant decrease (p < 0.01) with increasing levels of oils, but no change in total-N was observed with inclusion of peppermint oil in the diet53. The difference in total – N pattern in different experiments might be due to difference in type and dose of essential oils used.
4.8 Protozoa number
The addition of CO in both diets CF-1 and CF-2 depressed protozoa count significantly (p<0.01). A decrease in protozoa number by 12.78% was documented with the addition of Coconut oil in Composite feed-1, while, the inclusion of this oil in Composite feed -2 caused the decrease by 31.12% . The findings corroborate the earlier work employing eucalyptus oil41 Kumar et al. (2009. Supplementation of unsaturated fatty acid reduced the protozoan population in sheep rumen has also been suggested earlier54.It has been found that inclusion of CO in the diet caused reduction in protozoan number55. Decrease in methane production is also accompanied by reduction in the number of protozoa resulting from increased oil concentration. Close association of methanogenic bacteria with protozoa population might have adversely affected methanogenic archea which caused methane inhibition.
5 Conclusions
Inclusion of oils tended to decrease GP, ME, SCFA, TDDM and MBP. The effect was more pronounced when CO level was 1.0 µl/ml or higher. From the above gas production and fermentation parameters noticed in two diets CF-1 and CF-2 with inclusion of different levels of CO, it can be envisaged and concluded that increasing the proportion of concentrate in diets and using CO as a feed additive increases the rumen efficiency by reducing the methane concentration and gas production.
6 Acknowledgement
The authors are highly grateful and thank Dr. R.C. Jakhmola, Director, Central Sheep and Wool Research Institute, Bikaner for
permitting us to carry out the work and avail the facilities in the Institute.
7 Competing interests
None
8 Author’s contributions
TM carried out the laboratory work, AS helped in compilation and MS supervised the work.
9 References
1. Lashof DA, Ahuja DR. Relative contributions of greenhouse gas emissions to global warming. Nature. 1990; 344(6266): 529–531.
2. Scheehle EA, Kruger D. 2006. Global anthropogenic methane and nitrous oxide emissions. Energy J special issue 3, Multi- Greenhouse Gas Mitigation and Climate Policy.
3. Ellis JL, Kebreab E, Odongo NE, McBride BW, Okine EK, France J. Prediction of methane production from dairy and beef cattle. Journal of Dairy Science. 2007; 90(7): 3456– 3467.
4. National Research Council, The Scientific Basis for Estimating Air Emissions from Animal Feeding Operations, National Academy Press,Washington, DC, USA, 2002.
5. Mc Michael AJ, Powles JW, Butler CD, Uauy R. Food, livestock production, energy, climate change, and health. Lancet. 2007; 370:1253–1263.
6. Lerner J, Matthews E, Fung I. Methane emission from animals: a global high resolution database. Global Biogeochemical Cycles. 1988; 2: 139-156.
7. Chhabra A, Manjunath KR, Panigrahy S, Parihar JS. Spatial pattern of methane emissions from Indian livestock. Current Science. 2009; 96: 683-689.
8. Johnson, Ward GM. Estimates of animal methane emissions. Environmental Monitoring and Assessment, 1996; 42(1-2): 133–141.
9. Machmüller A, Soliva CR, Kreuzer M. Effect of coconut oil and defermentation treatment on methanogenesis in sheep. Repord. Nutr Dev. 2003; 43: 41–55.
UK J Pharm & Biosci, 2014: 2(6); 58 11. Machmuller A, Kreuzer M. Methane suppression by coconut
oil and associated effects on nutrient and energy balance in sheep. Canadian Journal of Animal Science. 1999; 79: 65– 72.
12. Soliva, C.R., Meile, L., Cieslak, A., Kreuzer, M., Machmuller, A. Rumensimulation technique study on the interactions of dietary lauric andmyristic acid supplementation in suppressing ruminal methanogenesis. Br. J.Nutr. 2004;92, 689–700.
13. AOAC. Official Method of Analysis, 16th ed. Association of Official Analytical Chemists,1995, Washington, DC.
14. Van Soest PJ, Robertson JB, Lewis BA. Methods of dietary fiber, neutral detergent fiber and non-starch carbohydrates in relation to animal nutrition. J Dairy Sci. 1991; 74: 3583–3597. 15. Porter LJ, Hrsrich LN, Chan BG. The conversion of procyanidins and prodelphinidins to cyaniding and delphinidin. Phytochemistry. 1986; 1: 223-230.
16. Makkar HPS, Blummel M, Becker K. Formation of complexes between polyvinyl pyrrolidones or polyethylene glycols and tannins, and their implication in gas production and true digestibility in in vitro techniques. Br. J. Nutr. 1995; 73: 897-913.
17. Menke KH, Steingass H. Estimation of the energetic feed value obtained by chemical analysis and in vitro gas production using rumen fluid. Animal Research and Development. 1988; 28: 7-55.
18. Tilley JMA, Terry RA. A two stage technique for thein vitro digestion of forage crops. J Br Grassl Soc. 1963; 18: 104– 111.
19. Getachew G, Blummel M, Makkar HPS, Becker K. In vitro gas measuring techniques for assessment of nutritional quality of feeds: a review.Anim Feed Sci Technol. 1999; 72: 261-281.
20. Kamra DN, Sawal RK, Pathak NN, Kewalramani N, Agarwal N. Diurnal variations in ciliate protozoa in the rumen of blackbuck (Antilope cervicapra) fed green forages. Lett. Appl. Microbiol. 1991;13:165-167.
21. Chaney AL, Marbach EP. Modified reagents for determinationf urea and ammonia. Clin Chem. 1962; 8: 130– 132.
22. McAllister TA, Okine EK, Mathison GW, Cheng KJ. Dietary, environmental and microbiological aspects of methane
production in ruminants. Canadian Journal of Animal Science 1996; 76: 231–243.
23. Boadi D, Benchaar C, Chiquette J, Massé D. Mitigation strategies to reduce enteric methane emissions from dairy cows: Update review. Canadian Journal of Animal Science 2004; 84: 319–335.
24. Johnson KA, Johnson DE. Methane emissions from cattle. Journal of Animal Science. 1995; 73: 2483- 2492.
25. Hegarty RS. Reducing rumen methane emissions throughelimination of rumen protozoa. Aust J Agric Res. 1999; 50: 1321–1327.
26. Benchaar C, Pomar C, Chiquette J. Evaluation of dietary strategies to reduce methane production in ruminants: A modeling approach. Canadian Journal of Animal Science. 2001; 81: 563–574.
27. Mathison GW. Effect of canola oil on methane productionin steers. Can. J. Anim. Sci. 1997; 77: 545–546.
28. Odongo NE, Or-Rashid MM, Kebreab E. Effect of supplementing myristic acid in dairy cow rations on ruminal methanogenesis and fatty acid profile in milk. J. Dairy Sci. 2007; 90: 1851–1858.
29. Machmuller A, Ossowski DA, Kreuzer M. Comparative evaluation of the effects of coconut oil, oilseeds and crystalline fat on methane release, digestion and energy balance in lambs. Animal Feed Science and Technology. 2000; 85: 41–60.
30. Steingass H, Menke KH. Schätzung des energetischen Futterwertes aus der in vitro mit Pansensaft bestimmten Gasbildung und der chemischen Analyse. I: Untersuchungen zur Methode. Übers. Tierern. 1986; 14: 251–270.
31. Coelho M, Hembry FG, Barton FE, Saxton AM. A comparison of microbial, enzymatic, chemical and near-infrared reflectance spectroscopy method in forage evaluation. Anim Feed Sci. Technol. 1988; 20: 219-231.
32. Mc Guinn SM, Beauchemin KA, Coates T. Methane emissions from beef cattle: effects of monensin, sunflower oil, enzymes, yeast and fumaric acid. Journal of Animal Science. 2004; 82: 3346–3356.
UK J Pharm & Biosci, 2014: 2(6); 59 34. Dong Y, Bae HD, McAllister TA, Mathison GW, Cheng KJ.
Lipid induced depression of methane production and digestibility in theartificial rumen system (RUSITEC). Can J. Anim Sci. 1997; 77, 269–278.
35. Yang WZ, Ametaj BN, Benchaar C, Beauchemin KA. Does response to cinnamaldehyde supplementation in growing beef heifers: Ruminal and intestinal digestion J Anim Sci. 2010b; 88: 680-688.
36. Pilajun R, Wanapat M, Wachirapakorn C, Navanukroaw C. Effect of coconut oil and sunflower oil ratio on ruminal fermentation, rumen microorganisms, N-balance and digestibility in cattle. J Anim Vet Adv. 2010; 9:1868–1874.
37. Wallace RJ, Mc Ewan NR, McIntosh FM, Teferedegne B, Newbold CJ. Natural products as manipulators of rumen fermentation. Asian-australias. J. Anim. Sci. 2002; 10: 1458– 1468.
38. Van Soest PJ. 1982. Nutritional ecology of the ruminant. Cornell University Press, 1982; Ithaca, NY, USA.
39. Busquet M, Calsamiglia S, Ferret A, Kamel C. Plant extracts affect in vitro rumen microbial fermentation. Journal of Dairy Science, 2006; 89: 761–771.
40. Maoheboeuf D, Morgavi DP, Papon Y, Mousset JL. Arturo-Schaan. Dose response effects of essential oils on in vitro fermentation activity of the rumen microbial population. Anim Feed Sci Technol. 2008; 145: 335-350.
41. Kumar R, Kamra KN, Agrawal N, Chaudhary LC. Effect of eucalyptus (Eucalyptus globules) oil on in vitro methanogenesis and fermentation of feed with buffalo rumen liquor. Anim NutrFeed technol. 2009; 9: 237-243.
42. Aggarwal N, Shekhar C, Kumar R, Chaudhary LC, Kamra DN. Effect of peppermint (Mentha piperita) oil on fermentation of feed and methanogenesis in in vitro gas production test.Animal Feed Science and Technology. 2009; 148: 321-327.
43. Patra AK, Kamra DN, Agarwal N. Effect of spices on rumen fermentation, methanogenesis and protozoa counts in in vitro gas production test. International Congress Series. 2006;1293: 176-179.
44. Davidson PM, Naidu AS. In Phyto-phenols Natural Food Antimicrobial Systems. Naidu AS, ed. CRCPress, Boca Raton, FL. 2000; 265–293.
45. Oldick BS, Firkins JL. Effects of degree of fat saturation on fiberdigestion and microbial protein synthesis when diets are fed twelvetimes daily. J Anim Sci. 2000; 78, 2412–2420.
46. Cardozo PW, Calsamiglia S, Ferret A, Kamel C. Screening for the effects at two pH levels on in vitro rumen microbialfermentation of a high-concentrate beef cattle diet. J Anim Sci. 2005; 83: 2572–2579.
47. Castillejos L, Calsamiglia S, Ferret A. Effect of essential oils active compounds on rumen microbial fermentation and nutrientflow in in vitro systems. J Dairy Sci. 2006;89:2649– 2658.
48. Spanghero M, Zanfi C, Fabbro E, Scicutella N, Camellim C. Effects of a blend of essential oil on some and products of in vitro rumen fermentation. Anim Feed Sci Technol. 2008; 145: 364-374.
49. Wanapat M, Pilajun R, Kongmun P. Ruminal ecology of swamp buffalo as influenced by dietary sources. Anim Feed Sci Technol. 2010; 151, 205–214.
50. Calsamiglia S, Busquet M, Cardozo PW. Castillejos L, Ferret A. Invited review. Essential oils as modifiers of rumen microbial fermentation. J. Dairy Sci. 2007; 90: 2580-2595.
51. Skandamis NP, Nychas GJE. Development and evaluation of a model predicting the survival of Escherichia coli O157:H7 NCTC 12900 in homemade eggplant salad at various temperatures, pHs, and oregano essential oil concentrations. Applied and Environmental Microbiology. 2000; 66: 1646±1653.
52. Devendra C, Sevilla CC. Availability and use of feed resources in crop-animal systems in Asia. Agricultural Systems. 2002; 71: 59-73.
53. Ando S, Nishida T, Ishida M, Hosoda K, Bayaru E. Effect of peppermint feeding on the digestibility,ruminal fermentation and protozoa. Livest Prod Sci. 2003; 82: 245–248.
54. Baah J, Ivanb M, Hristov AN, Koenig KM, Roded LM, McAllister TA. Effects of potential dietary antiprotozoal supplements on rumen fermentation and digestibility in heifers. Anim Feed Sci Technol. 2007; 137: 126–137.