FTIR Spectral Analysis of some Oil Seeds
1 Shaik Jainul Pasha and 2 Mohd. Khalid Mubashir Uz Zafar
1 Ph. D. Research Scholar, Dravidian University, Kuppam, India 2 Professor, Maulana Azad National Urdu University, Hyderabad, India
E. mail: [email protected]
1. INTRODUCTION:
Seeds are the important for the continuation of human life processes, without which one can simply not exist. The food supply to mankind depends on seeds. Seeds are basically very small embryonic plants that are enclosed and sealed by a covering that is referred to as the seed coat. A typical seed includes three basic components, an embryo, a supply of nutrients from the embryo and the seed coat Seeds come in all sizes and shapes and need particular conditions for their development into plants, in terms of the size of seeds, they vary from the size of a pinhead to a coconut, plants can contain a few seeds or thousands of seeds.
As is known, infrared spectroscopy is a potential tool to provide valuable information in the study of biomaterials with respect to structure of macromolecular components and their conformations within the tissue. It can also supplement other physical and chemical methods of analysis for the qualitative and quantitative determinations of different components present in the biomaterials.
In specific cases infrared spectroscopy is helpful for the identification of inorganic and organic constituents of biomaterials. In general, spectral analysis of tissues of biological system depends upon the material present and the analyte being sought. The tissue itself is dominated by the spectrum of the macromolecular components, which are present in the large quantity. If living tissue is being examined, it is dominated by the water spectrum.
It is well known that the visible region of electromagnetic radiation extends from 390 to 700 nm. The infrared radiation extends from the end of the visible region at 700 nm to the microwave region with wave length of 1mm. In general IR spectrum is divided in to three regions.
The region between visible and mid infrared (700 nm – 1400 nm) is called Near Infra red. This region of IR is being used for many applications, especially quantitative analysis. The region used by the material scientists is the mid infra red region extending from 1400 nm to 3000 nm. The region beyond 3000 nm to 1 mm is called the far Infra red region. This region is concerned with low frequency vibrations and molecular rotations.
2. LITERATURE REVIEW
Vijaya Ushasree and Adeel Ahmad [1] used FTIR spectroscopy and presented IR spectroscopic data on human blood of groups A, B, AB and O. IR analysis was made on 90% packed erythrocytes. The characteristic spectral bands pertaining to antigens were discussed. They explored the possibility of identification of blood antigens spectroscopically.
Vijaya Ushasree et al. [2] reported IR spectroscopic data on human blood and its constituents. IR analysis was made on whole blood, plasma and serum. The characteristic spectral bands pertaining to fibrinogen, hemoglobin, erythrocyte membrane lipids and other plasma proteins were identified. They suggested the possibility of disease analysis by IR spectroscopy
Vijaya Ushasree Adeel Ahmad [3] measured concentration of glucose in human blood using FTIR Spectroscopy. The FT-IR spectra of human blood serum samples were recorded using liquid cell in Mid IR region 4000-400 cm. The normal blood serum was treated with glucose at different concentrations viz 2, 4, 6, 8 and 10 gm/dL and the FT-IR spectra were recorded, which confirmed the specific peak for glucose. A graph between
Abstract: The paper presents FTIR spectral data on seeds. The seeds selected for the study are: Prunus dulcis
(Almond), Helianthus annuus (sunflower), Glycine max (soya bean), Sesamum indicum (seasame), Carthamus tinctori (safflower), Olea earopaea (olive), Brassica (mustard), Nigella sativa (kalonji), Archis hypogaea (ground nut) and Ricnus communis (Castor bean). The seeds are cleaned and powdered to fine grade. The FTIR spectra are recorded at the wavelength ranging from 400 cm-1 to 4000 cm-1. It is interesting to note that the principal bands at about 1649 cm-1 and 2926 cm-1, common in all seeds with different Absorbance (%), are related to proteins and fats respectively. The band at 1020 cm-1 related to carbohydrates is not found. The seeds of the present study show relatively high absorbance for the band at 2926 cm-1, compared to other band, revealing the fact that the seeds are fat rich.They contain proteins also in small quantity.
Available online on - WWW.IJRCS.ORG Page 2 concentration of glucose and intensity of absorption revealed a linear relation. There was an increase in the intensity of absorption.
Vlachos et al [4] showed the applications of Fourier transform-infrared spectroscopy to edible oils. It was reported that FT-IR spectroscopy could be used as an effective analytical tool in order: (a) to monitor the oxidation process of corn oil samples undergone during heating or/and exposure to ultraviolet radiation and (b) to determine extra virgin olive oil adulteration with lower priced vegetable oils (sunflower oil, soyabean oil, sesame oil, corn oil). It was noted that band shift at 3009 cm−1 assigned to the C-H stretching vibration of the cis-double bond, allowed the determination of extra virgin olive oil adulteration. Changes in the 3050–2800 and 1745 cm−1 spectral region appeared after heating at elevated temperatures and aid the oxidation process monitoring.
Safwan et al. [5] used Fourier transform infrared (FTIR) spectroscopy to classify different edible oils including the virgin olive oil. They identified adulteration of virgin olive oil with different volume ratios (2 5, 50 and
75%) of both corn and sunflower oils quantitatively. The total spectral data in region of (4000 - 400) cm-1 for all oil samples was recorded and then analyzed using different chemometric tools such as principal component analysis (PCA) and partial least square discriminant analysis (PLSDA).
Arunrat Anchalee [6] determined the trans fatty acid in food using Fourier transformed infrared spectroscopy. The range of transmittance for trans fatty acid showed in the region of 1000 – 990 cm-1 and cis configuration of fatty acid was within the range of 780 – 680 cm-1.The study examined the feasibility and compatibility of two different instruments FTIR and GCMS. Both instruments gave the quantity and quality of trans fatty acid compound of magarine product. GCMS technique took more time and gave better result when compared to FTIR. Because of time factor FTIR is a better alternative method for analysing trans fatty acid in Margarine products.
Marina Atena Poiana et. al. [7] made an attempt to evaluate the use of FT-IR spectroscopy as an effective analytical tool in order to assess the olive oil (OO) adulteration with cheaper vegetable oil (sunflower oil). Their data demonstrated that FT-IR spectroscopy proved to be a valuable tool to identify the differences recorded in oil samples. Shaik Jainul Pasha and Zafar [8] The presented a comparative study on FTIR spectroscopy of carbohydrate rich seeds. The seeds selected for the study were: Hordeum vulgare (Barley), Sorghum controversum (white jawar),
Triticum aestivum (Common wheat), Vigna radiate (Mung bean). The seeds were cleaned and powdered to fine grade. The FTIR spectra were recorded at the wavelength in the range of 400 cm-1 to 4000 cm-1. It is interesting to note that the principal bands at about 1020 cm-1, 1649 cm-1 and 2926 cm-1, common in all seeds with different intensities, were related to carbohydrates, proteins and fats respectively. The seeds showed relatively high absorbance for the band at 1020 cm-1, compared to other two bands pertaining to protein and fat, revealing the fact that the seeds were carbohydrate rich.
Search of literature reveals that FTIR studies on seeds are scanty. Hence, an attempt has been made to study fat rich seeds using the technique of IR spectroscopy
3. MATERIALS AND METHODS:
The seeds selected for the study were Prunus dulcis (Almond), Helianthus annuus (sunflower), Glycine max
(soya bean), Sesamum indicum (seasame), Carthamus tinctori (safflower), Olea earopaea (olive), Brassica (mustard),
Nigella sativa (kalonji), Archis hypogaea (ground nut) and Ricnus communis (Castor bean). The seeds were cleaned and powdered to fine grade. FTIR spectra were recorded in FTIR spectrophotometer (Shimadzu FTIR - 8400S) in the range of 4000 cm-1 to 400 cm-1.
For the study, a small quantity of seed powder was mixed with potassium bromide (KBr) in the ratio of 1:4 and pressed in a stainless steel die to produce thin KBr wafer, containing a relatively high concentration of seed sample in IR transparent KBr matrix.
4. RESULTS AND DISCUSSION:
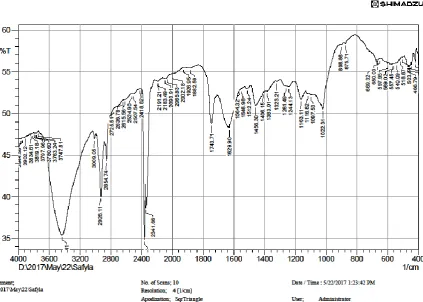
Fig. 1. Presents FTIR spectra of the seeds Prunus dulcis (Almond), Helianthus annuus (sunflower), Glycine max (soya bean), Sesamum indicum (seasame), Carthamus tinctori (safflower), Olea earopaea (olive), Brassica
(mustard), Nigella sativa (kalonji), Archis hypogaea (ground nut) and (Castor bean). Spectra reveal a series of bands along with % transmittance related to the functional groups of lipids, proteins, carbohydrates and also inorganic material presents in the seed powder.
axis. The graph is linear (Fig. 2), showing the increase in the absorbance with the increase in fat content. This relation is very much helpful in estimating fat in seeds without going for tedious, expensive and time consuming chemical tests.
Fig. 1.1. FTIR spectrum of Almond
Available online on - WWW.IJRCS.ORG Page 4 Fig. 1.3. FTIR spectrum of Soyabean seed
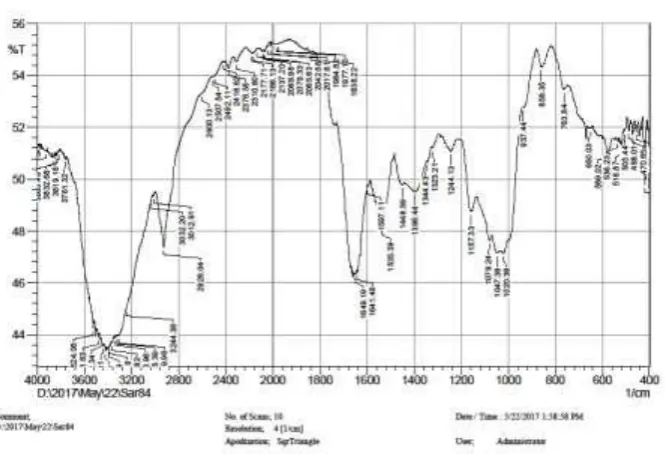
Fig. 1.5. FTIR spectrum of Safflower seed
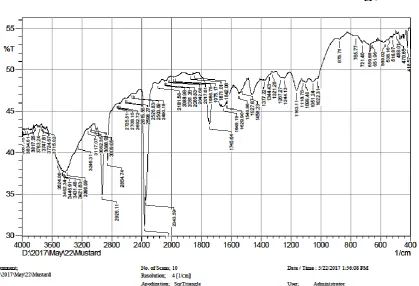
Available online on - WWW.IJRCS.ORG Page 6 Fig. 1.7. FTIR spectrum of Mustard seed
Fig. 1.9. FTIR spectrum of Ground nut
Fig. 1.10. FTIR spectrum of Castor seed
Table 1 – FTIR spectral data on oil seeds
Oil Seed Wave Number (cm
-1)
Absorbance (%) within the brackets
Almond 3961 3421 2926 2351 2090 1649 1242 1090 875 651 570 (0.44) (0.52) (0.65) (0.53) (0.33) (0.42) (0.37) (0.37) (0.28) (0.31) (0.3)
Sun flower 3961 3421 2926 2351 2090 1650 1242 1090 875 651 570 (0.39) (0.48) (0.49) (0.51) (0.32) (0.37) (0.33) (0.36) (0.28) (0.29) (0.28)
Soya bean 3961 3419 2926 2351 2090 1649 1242 1090 875 651 570 (0.43) (0.59) (0.50) (0.5) (0.36) (0.52) (0.42) (0.48) (0.36) (0.39) (0.4)
Seasame 3961 3421 2926 2351 2090 1653 1242 1090 875 651 570 (0.39) (0.46) (0.53) (0.5) (0.3) (0.37) (0.31) (0.3) - (0.26) (0.26)
Safflower 3961 3421 2926 2351 2090 1650 1242 1090 875 651 570 (0.32) (0.45) (0.39) (0.41) (0.26) (0.31) (0.27) (0.28) (0.23) (0.24) (0.25)
Olive 3961 3421 2926 2351 2090 1649 1242 1090 875 651 570 (0.33) (0.36) (0.35) (0.31) (0.3) (0.32) (0.3) (0.3) (0.28) (0.28) (0.28)
Mustard 3961 3421 2926 2351 2090 1649 1242 1090 875 651 570 (0.36) (0.42) (0.45) (0.5) (0.31) (0.34) (0.31) (0.31) (0.27) (0.27) (0.27)
Kalonji 3961 3421 2926 2351 2090 1649 1242 1090 875 651 570 (0.36) (0.44) (0.43) (0.49) (0.3) - (0.29) - (0.26) (0.27) (0.27)
Ground nut 3975 3421 2926 2351 2090 1649 1242 1090 860 651 570 (0.37) (0.43) (0.44) (0.5) (0.31) (0.37) (0.33) (0.33) (0.28) (0.3) (0.3)
Castor 3975 3421 2926 2351 2090 1649 1242 1090 875 651 570 (0.29) (0.36) (0.32) (0.26) (0.26) (0.33) (0.29) - - (0.28) (0.28)
Table 2 – Data on carbohydrate, protein and lipid content in oil seeds of the present study Scientific Name
Common Name Carbohydrates (%)
Proteins (%)
Lipid rich (%)
Prunus dulcis Almond 21.55 21.15 80
Helianthus annuus Sunflower 20.00 21.00 51
Glycine max Soyabean 30.00 36.00 45
Sesamum indicum Seasame 23.45 17.73 50
Carthamus tinctorius Safflower 0 0 40
Olea earopaeu Olive 11.00 30.00 35
Available online on - WWW.IJRCS.ORG Page 8
Nigella sativa Kalonji 52.00 16.00 30
Archies hypogaea Ground nut 16.13 25.80 45
Ricnus communis Castor bean 0 0 20
Fig. 2. A plot between Absorbance and Fat content in seeds
REFERENCES
1. [1] U. Vijaya Ushasree and Adeel Ahmad, FTIR spectroscopic analysis on human blood groups, Int. J. Sci. Env.Tech., Vol. 6, No 3, 2017, 1685 -1689.
2. U. Vijaya Ushasree, Kaleem Ahmed Jaleeli and Adeel Ahmad, A study on infrared spectroscopy of human blood, Int. J. Sci.Env. Tech., Vol. 5, No 3, 2016, 1189 – 1192.
3. U. Vijaya Ushasree Adeel Ahmad, A FTIR Spectroscopic Study on Quantitation of Glucose in Human Blood Serum , Int. J. Innov. Res. Sci. Engg. Tech., Vol. 6, No. 4, 2017, 6884 – 6890.
4. Vlachos N., Skopelitis Y., Psaroudaki M., Konstantinidou.V. Chatzilazarou. A., and Tegou. E., Applications of Fourier transform-infrared spectroscopy to edible oils, Analytica Chimica Acta, Vol. 573, 2006, 459-465. 5. Safwan. M, Beidat, O Mai, S. Khanfar, S and Wasfy M., Australian J. Basic and Appl. Sci., Vol. 3, No.
3,2009, 2048 - 2053.
6. Arunrat Anchalee, Qualitative and Quantitative determination of trans fatty acids in food using Fourier transformed infrared spectroscopy, Ph. D. diss., Silpakorn University, 2009.
7. Mariana-Atena Poiana, George Mousdis, Ersilia Alexa, Diana Moigradean, Monica Negrea, C. Mateescu, J. Agroalimentary Processes and Technologies, Vol. 18, No. 4, 2012, 277 – 282.