Effect of Competitive Strategies on Company Performance with Supply
Chain Management as a Moderating Variable in Food and Beverage
Companies Listed on the Indonesia Stock Exchange 2013-2017
1 Arif Amborroh Putra, 2 Dr. Yulia Hendri Yeni, SE, MT, Ak
1. Master Student, 2.Head (Dr). Yulia Hendri Yeni SE, MT, Ak
Magister Management of Andalas University, Padang, Indonesia Email – 1[email protected], 2 [email protected]
1. INTRODUCTION:
The rapid development of companies has led to increasingly high competition, so companies need a strategy to maintain their existence for a long period of time. Management of strategic management is an important process for business entities. A company that is categorized as successful if it can win the competition. Thus managers are required to choose and establish strategies to support company performance both in terms of technology, customer needs and product cycles that can be used to face competition.
The growth of the food and beverage industry helps economic equality. Because the majority of perpetrators are in the SME sector. This shows that industry has a big role in Indonesia's economic growth. In fact, the contribution of employment in the manufacturing sector is dominated by the food and beverage industry as many as 3.3 million people or by 21.34 percent. Meanwhile, in the January-September 2017 period, the investment value of the food and beverage industry reached Rp27.9 trillion for domestic investment (PMDN), while the investment value for foreign investment (PMA) was USD 1.4 billion. General Chair of the Indonesian Food and Beverage Entrepreneurs Association (GAPMMI) Adhi Lukman is optimistic the food and beverage industry can grow higher by 10 percent or up from the previous year. "2018 is a year of politics, where generally money supply will increase and it is expected that it can also boost consumption of food and beverages." (Source: www.kemenperin.go.id)
Based on the above description, managers must be able to know or predict competitive strategies that right to improve performance which can be seen with the profits generated by each company in the future as a reference to expand the company's operations and to increase investor confidence to invest in the consumer goods industry sector. The consumer goods industry sector is one of the sectors found on the Indonesia Stock Exchange (IDX) in which there are several sub-sectors. The first is the food and beverage sub-sector, the two cigarette sub-sectors, the three pharmaceutical sectors, the four cosmetics and household needs sectors, and the five household appliances sub-sectors. Of the various types of sub-sectors that exist in the consumer goods industry, what is of interest is the food and beverage sub-sector because it has the largest number of companies and decreases and increases the net profit margin each year. Here's a summary of the data related to the number of companies that have experienced a decline in performance (net profit margin) consumer goods industry sector:
Figure 1. The number and proportion of firms that declined NPM Consumer Goods Industry Sector in 2013-2017 in percent (%)
Sub sector Total Total Companies that Declined NPM Average
2013 % 2014 % 2015 % 2016 % 2017 % %
Food and
Bevarages 12 9 75% 8 67% 5 42% 6 50% 7 58% 49%
Pharmaceuticals 7 4 57% 6 86% 4 57% 4 57% 4 57% 52%
Abstract : This study aims to see how competitive strategies are measured by price premium capability and asset utilization efficiency of companyperformance measured by net profit margin with supply chain management as a moderating variable. The results showed that the competitive strategy had a positive effect on the performance of food and beverage companies, supply chain management had no effect on company performance but had a positive effect in strengthening the relationship of competitive strategies to the performance of food and beverage companies listed on the Indonesia Stock.
Cosmetic and
Household 4 4 100% 4 100% 2 50% 3 75% 1 25% 58%
House ware 3 1 33% 2 67% 1 33% 2 67% 1 33% 39%
Tobacco
Manufacturers 4 1 25% 3 75% 2 50% 2 50% 3 75% 46%
Source: Data processed from financial statements (www.idx.co.id)
Based on the above data acquisition there are 2 sub the company sector experienced an increase and decrease in the proportion of net profit margin in the industrial sector of consumer goods in 2013-2017, namely the first, the food and beverage sub-sector with the number 12 haan with the proportion of decline in 2013 was 75%, in 2014 amounted to 67%, in 2015 amounted to 42%, in 2016 amounted to 50% and in 2017 at 58%. Second, the cigarette sub-sector with a total of 4 companies, the proportion of the decline in 2013 was 25%, 2014 was 75%, 2015 was 50%, 2016 was 50% and in 2017 was 75%. Here researchers are more interested in testing competing strategies in the food and beverage sub-sector because there are more companies (complex) of 12 companies compared to the cosmetics sub-sector of 4 companies, and 3 household appliances and cigarettes of 4 companies.
The formulation of the problem in this study are: 1. How does the competitive strategy influence the costs measured by price premium capability on the performance of Food and Beverage companies listed on the Indonesia Stock Exchange in 2013-2017? 2. How does the competitive strategy influence differentiation measured by asset utilization efficiency on the performance of Food and Beverage companies listed on the Indonesia Stock Exchange in 2013-2017? 3. How is the influence of supply chain management on the performance of food and beverage companies listed on the Indonesia Stock Exchange in 2013-2017? 4. How does the competitive strategy in cost affect performance with supply chain management as a moderating variable in food and beverage companies listed on the Indonesia Stock Exchange in 2013-2017? 5. How does the competitive strategy influence the differentiation of performance with supply chain management as a moderating variable in the Food and Beverage companies listed on the Indonesia Stock Exchange in 2013-2017?
The objectives of this study are: 1. To know and analyze the influence of competitive strategies in costs measured by Price Premium Capability on the performance of Food and Beverage companies listed on the Indonesia Stock Exchange in 2013-2017. 2. To know and analyze the influence of competitive strategies in differentiation measured by the Asset Utilization Efficiency on the performance of Food and Beverage companies listed on the Indonesia Stock Exchange in 2013-2017. 3. To find out and analyze the influence of supply chain management on the performance of Food and Beverage companies listed on the Indonesia Stock Exchange in 2013-2017 4. To know and analyze the effect of competitive strategies in costs on performance with Supply Chain Management as a moderating variable in Food companies and Beverages listed on the Indonesia Stock Exchange in 2013-2017. 5. To find out and analyze the influence of competitive strategies in differentiation on performance with Supply Chain Management as a moderating variable in Food and Beverage companies listed on the Indonesia Stock Exchange in 2013-2017.
2. LITERATURE REVIEW : Strategy
According to Hunger and Thomas Wheleen (2004) strategy is a series of decisions and managerial activities that can determine the success of a company in achieving long-term. In the strategy requires consideration of both internal and external factors to maximize competitive advantage and to minimize threats from competitors or competitors.
Benefits of Strategy
Tripomo and Udan (2005) argue that a good strategy design will be very impactful and useful in an effort to improve the condition of the company, both in its efforts to overcome internal problems as a result of improper company development, corporate resource management and the power to win very competitive competition so that it is able to solve problems and achieve the goals of the company.
Competitive Strategy
According to Kotler and Gary Armstrong (2003) is a competitive advantage edge on competitors gained by offering a relatively low value or value-added, due to higher prices.
According to Heizer and Render (2009) companies achieve their vision and mission through three competing strategies, namely: (1) competing in differentiation, (2) competing in costs, and (3) rapid response. This means that operations managers are asked to create goods and services that are better, innovative and different from others, and cheaper and faster responsive. Heizer and Render (2009) explain the competing strategies as follows:
a. Competing in differentiation (Price Premium Capability)
Differentiation is related to presenting something unique and different. Opportunities for a company to create uniqueness can be done on all company activities. Competing strategies in differentiation in this study can be measured using the Price Premium Capability indicator.
b. Competing in costs (Asset Utilization Efficiency)
Low cost strategies do not mean that the value or quality of goods is low. Competitive strategies in costs in this study can be measured using theindicator Asset Utilization Efficiency.
c. Competing in response
Competing in response is the overall value associated with developing and delivering goods on time, reliable scheduling, and flexible performance.
Company Performance
According to Fahmi (2012), financial performance is an analysis used in the company regarding the achievement of various activities of the company's performance that have been running and see its implementation in accordance with applicable financial rules and regulations (Financial Accounting Standards). Furthermore, the Indonesian Accountants Association (2009) argues that financial performance is the ability of a company to manage and generate profits in each of its operating activities as reflected in the company's income statement. Profit is often used as a benchmark for the bad performance of a company as a calculation of the rate of return on investment or earnings per share. In general, profit is equated with profit, in other words the ratio that is considered capable of measuring company performance is the profitability ratio.
In this study, the measurement tool for measuring company performance is Net Profit Margin. Brigham and Houston (2013) stated that Net Profit Margin is a measure of the acquisition of the amount of net income compared to sales. This ratio is important for companies in setting selling prices and for controlling business expenses so that companies are able to implement a good planning strategy to be implemented in the company. The ratio of net profit margin shows a comparison between the amount of net profit and net sales generated by the company. The greater this ratio shows the greater the profit the company gets from net sales which is important for the survival of the company. For stakeholders or shareholders in the capital market by knowing the level of the company's ability to generate profits, it will greatly influence the decisions in investment that are more feasible.
Supply Chain Management (SCM)
According to Heizer and Render (2010), supply chain management is all activities of procurement of materials and services, the conversion of semi-finished goods into final products, and the delivery process to customers. All of these activities include purchasing activities, (outsourcing outsourcing), plus other functions that are important for the relationship between suppliers and distributors. Outsourcing (outsourcing) is an effort to obtain a product or service that is usually or is part of an organization from an outside supplier. Supply chain management offers a mechanism that regulates business processes, increases productivity and reduces the company's operating costs. The aim of all supply chain activities is to build a supplier chain that focuses on maximizing value for customers
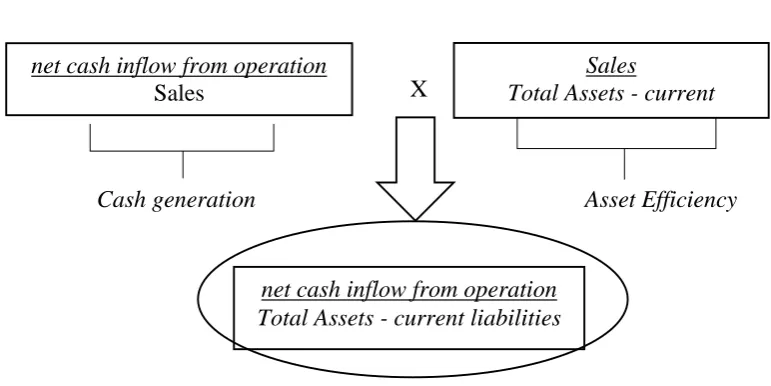
Proxy Supply Chain Management
Figure 2.1
Proxy Supply Chain Management
X
X
Cash generation
Asset Efficiency
3. PREVIOUS RESEARCHES REVIEW:
Some of the studies that form the basis of this study are: Spencer et al. (2009). Demonstrate that there is a positive relationship between differentiation strategies and company performance through the mediating role of non-financial and non-financial performance. Tewal (2010) Shows that, first; competitive strategies have a significant positive effect on company performance, and second; innovation has a significant positive effect on company performance.
Rahmasari (2011) Shows that, first; there is a significant positive effect of supply chain management on company performance, both practices supply chain management have a significant influence on competitive advantage, and third, competitive advantage has a significant influence on company performance. Suhartati and Rosietta (2012) Finding first: there is a positive and significant relationship between supply chain management and company performance, second: proven competitive strategies have an effect on strengthening the relationship between supply chain management and company performance, third: there is a significant positive relationship between low cost competitive strategies (cost efficiency) with supply chain management, and there is a significant negative relationship between competitive strategies of innovation and supply chain management.
Suharto and Devie (2013) Show that first: there is a significant and positive influence between supply chain management on competitive advantage. second: there is a significant and positive influence between supply chain management and company performance and third: there is a significant and positive influence between competitive advantage and company performance.
Ulfa (2015) shows first, the competing strategy with the indicator Asset Utilization Efficiency (Low cost strategy) and Price Premium Capability (differentiation strategy) has a significant positive effect on the performance of the second company, that supply chain management has a significant positive effect on the company's performance with the SC ratio indicator, third, that supply chain management can have a significant positive effect in strengthening the relationship between competitive strategies and company performance.
Anggini, N. (2018) Shows that 1. there is a significant influence of supply chain management and competitive advantage on company performance, 2. supply chain management variables have an effect on the company's performance is not significant, 3. variable competitive advantage influences the company's performance is not significant.
Hypothesis Development
Based on previous research, the submission of hypotheses in this study are:
The effect of competitive strategies in differentiation on company performance
H-1 competitive strategies in differentiation have a significant positive effect on company performance
Effect of competitive strategies in costs on company performance
H-2 competitive strategies in cost have a positive significant effect on company performance
The effect of supply chain management on the performance of company H-3 supply chain management has a significant positive effect on performance.
The effect of competitive strategies in differentiation on company performance with supply chain managementas themoderating variable
net cash inflow from operation
Sales
Sales
Total Assets - current
liabilities
H-4 Supply chain management has a significant positive effect in strengthening the relationship between competing strategies in differentiating the company's performance.
The effect of competitive strategies in costs on the performance of companies with supply chain managementas a moderating variable of
H-5 Supply chain management has a significant positive effect in strengthening the relationship between competitive strategies against company performance.
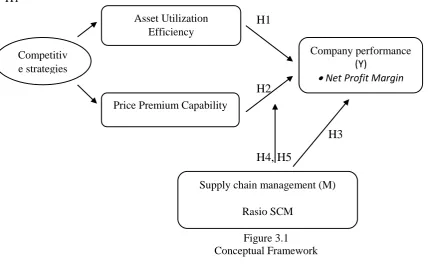
Conceptual Framework
Based on the problem formulation, proposed research objectives and literature review, a customized conceptual framework can be created to support the following research:
H1
H1
H2
H3
H4, H5
Figure 3.1 Conceptual Framework
4. METHOD :
Based on the formulation and limitations of the problem and the research objectives that have been stated, the type of research is descriptive causative. Causative descriptive is a form of research describing the influence of competitive strategy variables on firm performance with Supply Chain Management work as a moderating variable. Causal design shows the analysis of a variable with other variables and how much the variable influences the other variables.
Population and sample
Sekaran (2006) population is the whole subject or object that works together to achieve a particular goal. From this definition, the population of this study are: a) Food and beverage sub-sector companies listed on the Indonesia Stock Exchange during the research period, 2013-2017. b) Publish annual financial statements consistently for the period ending December 31 during the study period, 2013-2017. c) The company has complete data related to the research variables during the study period, then there are 12 companies. (Source from: www.idx.co.id)
Then Sekaran (2006) defines a sample as part of a population that can represent it. For sampling in the study using saturated sampling (census). Saturated sampling (census) is a sampling technique where the total number of populations is sampled or in other words generalizes with the smallest error rate.
Types and Data Collection Methods
This study uses secondary data types, to fulfill the research requirements pooling data (time series and cross section) is used. Ajija (2011), to obtain data as much as 60 data. The method of data collection uses the documentation method, which is the data obtained from the audited company's financial statement documents in the period 2013-2017 and a summary of company performance, sourced from www.idx.com
Competitiv e strategies
Asset Utilization Efficiency
Price Premium Capability
Company performance (Y)
Net Profit Margin
Supply chain management (M)
Variable Operational Definition. Dependent Variable
Corporate Performance (NPM).
Measurement of company performance uses the ratio of Net Profit Margin (NPM) which shows the comparison between net income and sales. The greater this ratio shows the greater the profit the company gets from net sales which is important for the survival of the company.
The formulation used to calculate the amount of Net Profit Margin according to Harmono (2014):
Independent Variabel Competitive Strategy
1. Competitive Competing in differentiation (Price Premium Capability)
Differentiation relates to the presentation of something unique and different. Opportunities for a company to create uniqueness can be done on all company activities
2. Competing in costs (Asset Utilization Efficiency).
Competing in costs means achieving the maximum value customers want. This requires testing and decisions from operations management with a hard effort to reduce costs and still meet the expected value of the customer. The low cost strategy does not mean that the value or quality of goods is low.
Moderation Variable
Supply Chain Management (SCM)
Affects financial performance in three areas, namely profitability, liquidity, and productivity (Titi and Hilda, 2012). Where the proxy of the Ratio is Supply Chain constructed from two financial ratios, namely the size of cash generation and asset efficiency. The ratio is cash generation calculated by dividing the net cash inflow from operation with sales. While the ratio is asset efficiency measured by dividing sales by total assets minus debt. It can be formulated as follows
Data Analysis Methods and Data Analysis Techniques Data Analysis Methods
In verifying the truth of the hypothesis various kinds of statistical tests were conducted. This study also aims to see the moderating variable influencing the direct relationship between the independent variable and the dependent variable. This influence can strengthen or weaken the direct relationship between the independent variable and the dependent variable. For that research data is processed using assistance from the program Eviews 8.
Data Analysis Techniques
Methods of data analysis using descriptive statistics, classic assumption tests, and hypothesis testing.
Descriptive Analysis Descriptive
analysis is a form of research data analysis to test generalization of research results based on one sample
Quantitative Analysis
Formation of OLS Regression Model (Ordinary Least Square)
According to Winarno (2012) the formation of a regression model using the OLS model aims to determine the direction of the influence of independent variables on the dependent variable. In general the regression model used is shown below:
Y = α + b1.X1 + b2.X2 + b3.Z + b4.{X1.Z} + b5 {X2.Z} + e
Net Profit Margin
=
Net income after tax𝑺𝒂𝒍𝒆𝒔
Price Premium Capability
=
𝑮𝒓𝒐𝒔𝒔𝒎𝒂𝒓𝒈𝒊𝒏𝑻𝒐𝒕𝒂𝒍𝒔𝒂𝒍𝒆𝒔𝒓𝒆𝒗𝒆𝒏𝒖𝒆
Asset Utilization Efficiency
=
𝑻𝒐𝒕𝒂𝒍𝒔𝒂𝒍𝒆𝒔𝒓𝒆𝒗𝒆𝒏𝒖𝒆𝑻𝒐𝒕𝒂𝒍𝒂𝒔𝒔𝒆𝒕
Supply Chain Management
=
𝑵𝒆𝒕𝒄𝒂𝒔𝒉𝒇𝒍𝒐𝒘𝒇𝒓𝒐𝒎𝒐𝒑𝒆𝒓𝒂𝒕𝒊𝒐𝒏Where:
Y = coorporate performance
α = constanta
b1, b2, b3, b4,b5 = coefisien Regresion
X1 = Price Premium Capability
X¬2 = Asset Utilization Effeciency
Z = Supply Chain Management
e = Error
Classical Assumption Test
Before testing hypotheses first testing classical assumptions is useful for viewing accuracy and reliability of item items that support research variables. In general, the classic assumption test used includes: Normality Test, Multicollinearity Test, Autocorrelation Test, Heterocedasticity Test, Determinant Coefficient (R2)
Hypothesis Testing
According to Winarno (2009) t-statistic testing is done to find out some influence of an independent variable on the dependent variable by testing the coefficient the independent variables are by the formula:
t =
n S
n
Requested:
βn = Regression coefficient of each variable
Sβn = Standard error of each variable
Testing Criteria
a.If prob ≤ alpha then the decision is Ho rejected and Ha accepted so that it can be concluded that independent variables
individually have a significant effect on the dependent variable.
b. If prob> alpha then the decision is Ho rejected and Ha accepted so that it can be concluded that the independent variables individually have a significant effect on the dependent variable.
5. RESEARCH RESULTS AND DISCUSSION :
Descriptive Analysis Results Descriptive
analysis is useful to determine the character of the sample to be used in the study. To find out the description of the sample characteristics used in detail can be seen in table 4.2, from this descriptive analysis can be seen observation, mean, standard deviation, maximum, and minimum independent variable competitive strategy (AUE & PPC), moderating variable Supply Chain Management ( SCM) and dependent variable company performance (KP) in this study. The stages of data processing are done using Eviews 8.0. Based on data processing that has been done obtained descriptive analysis of research variables as shown in Table 4.1 below:
Table 4.1
Descriptive Analysis Results Descriptive
Research
Variabels N Minimum Maximum Mean
Std Deviasi
AUE 60 0.250 236.2 5.143 30.348
PPC 60 0.060 0.840 0.320 0.203
SCM 60 -8.130 255.8 6.425 34.110
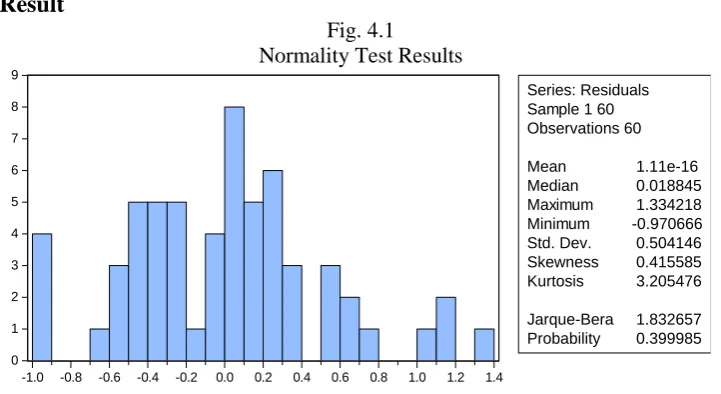
Normality Test Result
Fig. 4.1
Normality Test Results
0 1 2 3 4 5 6 7 8 9
-1.0 -0.8 -0.6 -0.4 -0.2 0.0 0.2 0.4 0.6 0.8 1.0 1.2 1.4
Series: Residuals Sample 1 60 Observations 60
Mean 1.11e-16 Median 0.018845 Maximum 1.334218 Minimum -0.970666 Std. Dev. 0.504146 Skewness 0.415585 Kurtosis 3.205476
Jarque-Bera 1.832657 Probability 0.399985
Source: Processed data
From figure 4.1, it can be concluded that all research variables have normal distribution because they have avalue probability above 0.05 so that they can be included for further data processing.
Multicollinearity Test Results
Table 4.2
Multicollinearity Test Results
Variabel Koefisien
korelasi Alpha Keterangan Price Premium Capability -0.378 0,80 Free Multicollinearity Asset Utilization Efficiency -0.291 0,80 Free Multicollinearity Supply Chain Management -0.316 0,80 Free Multicollinearity
Source: Processed data
This aim to test whether the regression model found a correlation between independent variables. A good
regression model should not have a correlation between the independent variables. Symptoms of multicollinearity will be detected if the correlation coefficient produced is above 0.80 or hypothesis testing can be immediately implemented after the independent variable is free from the symptoms of multicollinearity (Nachrowi, 2006).Heteroscedasticity Test Results
Table 4.3
Heteroscedasticity Test Results
Obs*R-square Probability Alpha Keterangan
15.689 0.073 0,05 Free heteroscedasticity
Source: Processed data
Symptoms of heterocedasticity will not occur if the observation value of R-square is above alpha 0.05. (Nachrowi, 2006). After testing, the R-square Observation value was obtained at 15,689. Based on the previous provisions, the value probability of 0.073 is above 0.05, which means there are no symptoms of heterocedasticity.
Autocorrelation Test Results
Table 4.3
Autocorrelation Test Results
Breusch-Godfrey Serial Correlation LM Test:
F-statistic
2.281057 Prob. F(4,52)
0.0730
Obs*R-squared
8.956412 Prob. Chi-Square(4)
0.0622
Based on the results of the autocoleration test using the LM test, theprobability value is chi-square 0.0622 at (α = 5%), which means that the chi-square value is greater than α, it is concluded that there is no autocoleration problem.
Establishment of Regression Model
Table 4.4
Regression Model Results
Variabel Koeficien
Regresion t-statistic Probability
(Constanta) 7.892 1.752 0.0854
AUEperformance -5.650 -2.383 0.0207
PPC performance 27.555 3.222 0.0022
SCM performance -6.672 -1.516 0.1354
AUE*SCM performance 10.544 4.199 0.0001
PPC*SCM Kinerja 0.340 0.027 0.0387
Source: Processed data
Based on table 4.4 it is known the coefficient value of the regression equation, so that it can be made into a regression model as follows:
Y = 7.892 – 5.650.X1 + 27.555.X2 – 6.672.Z + {10.544.-6.672} + {27.555.-6.672} + e
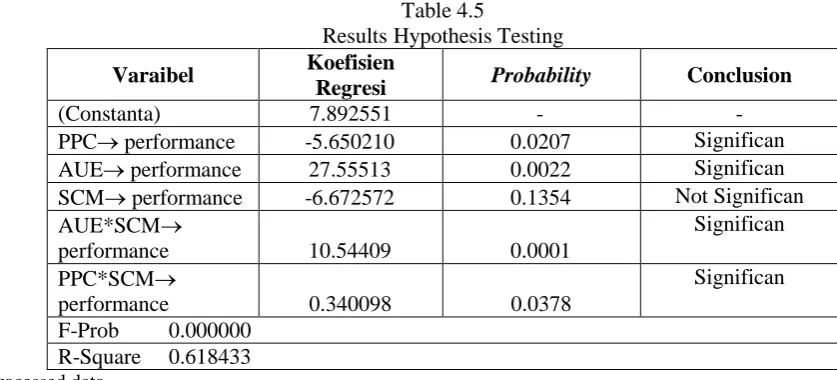
Hypothesis Testing Results
Table 4.5
Results Hypothesis Testing
Varaibel Koefisien
Regresi Probability Conclusion
(Constanta) 7.892551 - -
PPC performance -5.650210 0.0207 Significan
AUE performance 27.55513 0.0022 Significan
SCM performance -6.672572 0.1354 Not Significan AUE*SCM
performance 10.54409 0.0001
Significan
PPC*SCM
performance 0.340098 0.0378
Significan
F-Prob 0.000000 R-Square 0.618433 Source: Processed data
Effect of Competitive Strategies in Differentiating on Company Performance
Based on the reg model established receipts, competitive strategy variables measured by Price Premium Capability as an indicator to measure competitive strategies in differentiation, it was found that the competitive strategy indicator variable Price Premium Capability (PPC) had a significant effect on company performance in Food and Beverage companies listed on the Exchange Indonesian Securities.
This finding is in line with the research of Suharto and Devie (2013) showing that there is a significant and positive influence between competitive advantage and company performance. The same results with the research conducted by Rustamblin et al. (2013) showed that the application of product differentiation strategies had a significant effect on the performance of commercial banks and also research conducted by Banker et al (2014) using panel data analysis showed that product differentiation strategies significant effect on company performance.
Effect of Competitive Strategies in costs on Company Performance
Based on the established regression model, competing strategy variables measured by Asset Utilization Efficiency as an indicator to measure competitive strategies in costs, it was found that the Asset Utilization Efficiency (AUE) variable had a significant effect on firm performance in Food and Beverage companies listed on the Indonesia Stock Exchange.
conducted by Chang et al (2015) regarding the relationship between strategic position as measured by cost leadership strategies and product differentiation on production efficiency and also research conducted by Josiah et al (2015) show that cost leadership strategies have a significant effect on the performance of gas companies, which means that the higher the level of competitive strategies applied in a company, the higher the level of performance the company will also increase.
The Effect of Supply Chain Management Company Performance
Based on the results of testing the second hypothesis it was found that thevariable Supply Chain Management did not significantly influence the performance of the company in the Food and Beverage companies listed on the Indonesia Stock Exchange. The results obtained show that Supply Chain Management is not a variable that affects the size of the company's performance measured by the ratio of net profit margin to Food and Beverage companies listed on the Indonesia Stock Exchange.
The results of the study in line with the results of the research conducted by Anggini, N. (2018) show that the supply chain management variable has no significant effect on company performance. The same results with the research conducted by Amalia, D. (2013) show thatintegration supply chain has a negative and not significant effect on company performance.
The Effect of Competitive Strategies on Company Performance with Supply Chain Management as Moderating Variables
Based on the established regression model, supply chain management as a moderating variable and competitive strategy variables measured by Price Premium Capability as indicators to measure competitive strategies in differentiation are found thatvariables Supply Chain Management have a significant effect on strengthening the relationship between competitive strategies and company performance in Food and Beverage companies listed on the Indonesia Stock Exchange.
This finding is in line with the research of Suhartati and Rosietta (2012) stating that it is proven that supply chain management influential strengthens the relationship between competitive strategies and company performance. The same results with the Ulfa (2015) study show that supply chain management can have a significant positive effect in strengthening the relationship between competitive strategies and company performance.
The Influence of Cost Competing Strategies on Company Performance with Supply Chain Management as Moderating Variables
Based on the established regression model, supply chain management as a moderating variable and competitive strategy variables measured as Asset Utilization Efficiency as an indicator to measure competitive strategies in costs found that variables Supply Chain Management has a significant effect on strengthening the relationship between competing strategies against the performance of companies in Food and Beverage companies listed on the Indonesia Stock Exchange.
This finding is in line with the research of Suhartati and Rosietta (2012) stating that it is proven that influential supply chain management strengthens the relationship between competitive strategies and company performance. The same results with the Ulfa (2015) study show that supply chain management can have a significant positive effect in strengthening the relationship between competitive strategies and company performance.
6. CONCLUSION:
Based on the analysis and discussion of the results of hypothesis testing that has been carried out, several important conclusions are proposed as follows: 1. Competitive strategy measured using Price Premium Capability as a competitive strategy indicator in the Asset Utilization Efficiency differentiation and variables as indicators of competing strategies in influential costs positive for the performance of food and beverage companies listed on the Indonesia Stock Exchange. 2. Supply Chain Management does not affect the performance of food and beverage companies listed on the Indonesia Stock Exchange. 3. Supply Chain Management has a positive effect in strengthening the relationship between competitive strategies and the performance of food and beverage companies listed on the Indonesia Stock Exchange.
7. IMPLICATION:
8. LIMITATIONS AND SUGGESTIONS:
Researchers realize that the results of research obtained at this time still have a number of weaknesses or weaknesses that researchers feel. These weaknesses are limitations that researchers have, namely: 1. The number of sample sizes used in data analysis is still relatively small so that it also affects the accuracy and accuracy of the results of the research obtained. 2. Only use two dimensions of competitive strategy, namely Asset Utilization Efficiency (Low cost strategy) and Price Premium Capability (differentiation strategy) 3. This research is based on secondary data taken on the IDX, not based on observations so that less can be explored more deeply about the truth of implementing competitive strategies and supply chain management.
In accordance with the limitations of the results of the study the researchers proposed several suggestions that could provide benefits for: 1. Researchers in the future are expected to try to increase the number of sample companies that will be used as samples, these suggestions are important to encourage the accuracy and accuracy of future research results . 2. Researchers in the future are advised to make the same sample characteristics using a sampling method. The suggestion is important to avoid outlier data so that the accuracy of the research results that will be obtained will be better. 3. Researchers in the future are advised to be able to use observations so that they can be explained qualitatively to find out the truth of implementing competitive strategies and supply chain management in the company
REFERENCES:
1. Ajija, Shochrul R. et al. 2011. Smart Ways to Master Eviews. Salemba Empat: jakarta.
2. Amalia, D. (2013). Analysis of the influence of management practices, supply chain integration, and competing capabilities on performance (Study on UKM Exporters in Kodya Yogyakarta) (Doctoral dissertation, UPN "Veteran" Yogyakarta).
3. Anggini, N.(2018). Effect of Supply Chain Management and competitive advantage onperformance company (Study of the Furniture Industry in Yogyakarta).
4. Banker, RD, Mashruwala, R., & Tripathy, A. (2014). Does A Differential Strategy Lead to More Sustainable Financial Performance than A Cost Leadership Strategy? Management Decision, Vol. 52.
5. Brigham, Eugene F and Joel F. Houston, 2013. Fundamentals of Financial Management Ali Interchange of Akbar Yulianto, Book one, Ten Edition, PT. Salemba Empat, Jakarta.
6. Chang, H., Fernando, GD, & Tripathy, A. (2015). An Empirical Study of Strategic Positioning and Production Efficiency. Hindawi Publishing Corporation.
7. Christopher, M. (2005), Logistics & Supply Chain Management: Creating Value-Adding Networks, FT / Prentice-Hall, Harlow.
8. Fahmi, Irham. 2012. Financial Performance Analysis. Alfabeta: Bandung. 9. --- 2012. Fundamentals of Financial Management. Alfabeta: Bandung.
10.Heizer, Jay, and Barry Render. 2009. Operations Management. 7th edition Jakarta: Salemba Empat. 11. --- 2010. Operations Management. Book 2 9th Edition Jakarta: Salemba Empat.
12.http://www.kemenperin.go.id/artikel/18727/Industri-Mamin-Potential-Growing-Positive- inYears Political 13.http://www.idx.com
14.Indonesian Institute of Accountants (2009) Financial Accounting Standards, PSAK No.1: presentation of financial statements. Jakarta: Salemba Empat.
15.J. David Hunger & Thomas L. Wheelen, Strategic Management and Business Policy, 9th Edition, Pearson Prentice Hall, 2004.
16.Kotler, Philip and Gary Armstrong, 2003. Fundamentals of Marketing, Volume 1, Issue Ninth. Jakarta, PT. Gramedia Index.
17.Nachrowi, D. 2006. Econometrics, for Economic and Financial Analysis. Printing First, Publisher Institute FE UI: Jakarta.
18.Rahmasari, Lisda. 2011. "The Effects of Supply Chain Management on Corporate Performance and Competitive Advantages (Case Study of Creative Industries in Central Java Province)". Magazine of Scientific Informatics Vol. 2, No. 3 (September 2011): 89-101.
19.Porter, Michael E. (1985). Competitive Advantage. New York: Free Press
20.---. (2008), "The Five Competitive Forces That Shape Strategy." Special Issue on HBS Centennial. Harvard Business Review86, no. 1 (January 2008)
21.Rustamblin, D., Thoyib, A., & Zain, D. (2013). Effect of Generic Strategy on Company Performance. Journal of Management Applications, Vol 11.
22.Sekaran, Uma. 2006. Business Research Methodology. Erlangga: Jakarta.
24.Suharto, Regina and Devie. 2013. "Analysis of the Effects of Supply Chain Management on Competitive Advantage and Company Performance". Journal of Business Accounting Review. Vol. 1, No. 2, (2013).
25.Suhartati, Titi and Hilda Rosietta. 2012. "Effects of Competing Strategies on the Relationship Between Supply Chain Management and Performance". National Symposium on Accounting for XV, Vol. 1, (June 2012): 1-24.
26.Tewal, Bernhard. (2010). "The Influence of Competing Strategies and Performance Innovations of Hospitality Companies in North Sulawesi". Journal of Management Applications Vol. 8, No. 2 (May 2010): 464 470.
27.Tripomo, Tedjo and Udan. 2005. Strategy Management. Bandung: Science Engineering.