ORIGINAL ARTICLE
EVALUATION OF IRIDOCILIARY AND LENTICULAR ELASTICITY
USING SHEAR-WAVE ELASTOGRAPHY IN RABBIT EYES
Efstathios T. Detorakis2, Eleni E. Drakonaki3, Harilaos Ginis2, Nikolaos Karyotakis2, Ioannis G. Pallikaris1,2
University Hospital of Heraklion, Greece, Department of Ophthalmology1;Institute of Vision & Optics, University of Crete2; Department of Medical Imaging, University Hospital of Heraklion, Greece3
Summary: Introduction: A previous study has employed shear-wave ultrasound elastographic imaging to assess corneal rigidity in an ex-vivo porcine eye model. This study employs the same modality in vivo in a rabbit eye model in order to assess lens, ciliary body and total ocular rigidity changes following the instillation of atropine and pilocarpine. Methods: Ten non-pigmented female rabbits were examined. Measurements of the lens, ciliary body and total ocular rigidity as well as lens thickness and anterior chamber depth were taken with the Aixplorer system (SuperSonic Imagine, Aix-en-Provence, France) with the SuperLinear™ SL 15-4 transducer in both eyes at baseline as well as after pilocarpine and atropine instillation. The IOP was also measured with the TonoPen tonometer. Results: Changes in rigidity in the examined areas following atropine instillation were statistically not significant. Ciliary body rigidity was significantly increased whereas lens and total ocular rigidity were significantly reduced following pilocarpine instillation. The decrease in lens rigidity following pilocarpine was significantly associated with the respective increase in ciliary body rigidity. Conclusions: Shear-wave ultrasound elas-tography can detect in vivo rigidity changes in the anterior segment of the rabbit eye model and may potentially be applied in human eyes, providing useful clinical information on conditions in which rigidity changes play an important role, such as glaucoma, pseudoexfoliation syndrome or presbyopia.
Key words: Ultrasonography instruments; Lens; Ciliary body; Shear-wave elastography; Ocular rigidity
Introduction
Elastography is a method of evaluating tissue elastici-ty, based on static tissue compression and cross-correlation methods (1). The main elastographic techniques include Magnetic Resonance (MR) elastography (1, 2). and ultra-sound (US) elastography (1, 3). In the case of strain US elastography, tissue compression (stress) is induced man-ually by the user whereas the relative deformation (strain) is estimated using tissue Doppler techniques (4). The de-rived strains are displayed as a qualitative elasticity image, based on grey-scale or color-scale grading (4). A previous study has reported that strain ocular US elastographic im-aging is feasible in assessing the elasticity of ophthalmic tissues (5). However, the recent introduction of shear-wave US elastography, which is based on the automated genera-tion and analysis of transient shear waves (low frequency and low propagation speed transverse waves, propagated in a direction perpendicular to tissue motion) has enabled the quantitative assessment of tissue elasticity (6). Shear-wave US elastography has previously been employed in the assess-ment of corneal elasticity in an ex-vivo corneal model (7). The present study employs shear-wave US elastography to quantitatively assess changes in the elasticity of ciliary body and lens following the induced contraction (by a cholinergic
agonist) and relaxation (by a cholinergic antagonist) of the ciliary muscle, in a rabbit eye model. Results could help in understanding the bio-mechanical behaviour of these tis-sues, depending on the status of ciliary muscle activity, and may also have clinical implications for conditions such as glaucoma or presbyopia.
Methods
This is an animal model (rabbit) experimental study. The protocol was approved by the ethics committee of our hospital. All animals were treated according to the national (Greek) laws concerning animal experiments. Ten female non-pigmented (white) adult rabbits were used, with an av-erage body weight of 2.4 Kg. Both eyes of the animals were examined. For the purpose of the experiment, the animals were anesthetized with subcutaneous injections of 1 ml of Xylazine hydrochloride 20 mg/ml solution (Rompun, Bayer HealthCare AG, Leverkusen, Germany) and 1 ml of Keta-mine hydrochloride solution 100 mg/ml (Merial SAS, Lyon, France). It has previously been reported that this method of sedation does not significantly affect the IOP in New Zea-land white rabbits (8).
the intraocular pressure (IOP) was measured in both eyes (Fig. 1A) using the TonoPenTM (Reichert, Buffalo, NY, USA). In order to take the elastographic images and meas-urements, an adequate amount of coupling gel was applied over the ocular surface and the transducer was gently applied on the ocular surface over the gel, without exerting pressure (Fig. 1B). During the ultrasound examination of one eye, care was taken not to compress the fellow eye on the ex-amination table by using an adequate silicone head support for the animal. The Aixplorer system (SuperSonic Imagine, Aix-en-Provence, France) with the SuperLinear™ SL 15–4 transducer (a 50 mm linear-array transducer equipped with an extended frequency range from 4–15 MHz), was used to produce simultaneous B-scan and shear wave
elastograph-ic images of the anterior ocular segment. The system was calibrated for superficial (thyroid) imaging, in accordance with previous ophthalmic ultrasonographic studies. Meas-urements of the Anterior Chamber Depth (ACD), Axial Length of the eye (AL) and lens thickness (LT) at the ante-rio-posterior axis were taken at the B-scan images (Fig. 2). In the elastographic images, the ciliary body, lens and total ocular surface were assessed as specific Regions of Interest (ROI), with standard shape, configuration and surface area, based on the built-in software of the system (Fig. 3). Once the image quality was adequate, based on the specifications of the system, the ROIs were delineated and elasticity meas-urements were taken for each ROI in KiloPascals (KPa). The eyes were scanned at a transverse plane (along the
in-Fig. 1: Technique of IOP measurement with the TonoPenTM (A) and use of ultrasound linear probe of the Aixplorer system on a rabbit eye (B).
A B
Fig. 2: Technique of lens thickness (A) and anterior chamber depth (B) measurements. The length to measure is marked on B-scan images and automatically transposed on shear-wave elastographic images by the Aixplorer software. A color scale of rigidity readings (0–180 KPa) is also shown.
ter-palpebral fissure) through the globe equator. Both eyes were consecutively examined in the same way. The left eye was examined first in all cases. On the average each eye was examined for approximately 5 min. Three measurements were taken and the mean calculated to plot the results of each eye. All data were acquired in real time. Subsequent-ly, the gel was washed out and pilocarpine hydrochloride ophthalmic solution 4% (Alcon Laboratories, was instilled 4 times at 5 min intervals in both eyes (Isoptocarpine, Alcon Laboratories, Fort Worth, Texas). One hour following the instillation of pilocarpine, the (IOP) was measured again and the elastographic imaging and measurements were repeated over the same ROIs in the same manner. Post-pilocarpine measurements of LT and ACD were also taken on B-scan images. Upon completion of measurements, tobramycin 0.3% eye drops (Tobrex, Alcon Laboratories, Fort Worth, Texas) was instilled in both eyes of the animals. One week
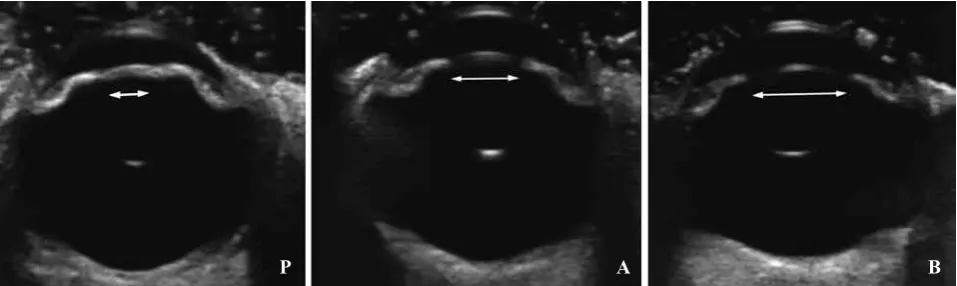
later, the procedure of animal anesthetization, IOP meas-urement and baseline B-scan and elastographic imaging was repeated in the same manner. However, following the completion of baseline measurements, atropine sulphate 1% eye drops (Atropine, Cooper, Athens, Greece) was instilled 4 times at 5 min intervals in both eyes. One hour following the instillation of atropine, the (IOP) was measured again and the elastographic imaging and measurements were repeated over the same ROIs in the same manner. Post-at-ropine measurements of LT and ACD were also taken on B-scan images. Transverse B-scan images of a rabbit eye after pilocarpine instillation, at baseline status as well after atropine instillation are presented in Fig. 4.
Statistical analysis of findings was performed using SPSS 8.0 (SPSS, Chicago, IL). Statistical significance was set at 0.05. Differences in the elasticity scores (in KPa) between baseline and post-instillation of both atropine and
isoptocar-Fig. 3: Region of Interest (ROI) delineation in the examined eyes. Lens and ciliary body areas (A) and total ocular areas (B) are delineated on B-scan images and the borders are automatically transposed on shear-wave elastographic images by the Aixplorer software. A color scale of rigidity readings (0–180 KPa) is also shown. The system also provides quantitative reading in each Q-box, corresponding to the delineated ROIs.
A B
Fig. 4: Transverse B-scan images of a rabbit eye after pilocarpine instillation (P), at baseline status (A) and after atropine instillation (B). The respective maximal pupillary opening is marked with a white line with arrowheads in all cases.
pine in all ROIs were examined using paired samples T-test. Differences in the ACD, the LT as well as the respective IOP readings between baseline and post-instillation of both atropine and isoptocarpine in all ROIs were examined us-ing paired samples T-test. Correlations between statistically significant changes in rigidity scores and AL, ACD, LT and IOP were examined using Pearson’s bivariate correlation coefficient. Respective correlations were also examined fol-lowing atropine and pilocarpine instillation.
Results
Ciliary body rigidity scores were decreased and lens rigidity scores were increased following the instillation of atropine, compared with respective baseline scores, but differences were statistically not significant in both cases. Differences between pre-atropine and post-atropine total ocular rigidity scores were also statistically not significant (Table 1). On the contrary, ciliary body rigidity was signif-icantly increased following the instillation of pilocarpine,
whereas respective lens and total ocular rigidity scores were significantly decreased, compared with pre-pilocarpine scores (Table 2).
Lens thickness was decreased following the instilla-tion of atropine and increased following the instillainstilla-tion of pilocarpine, compared with respective baseline scores, however differences did not exceed the level of statistical significance in either case (Tables 3 and 4, respectively). Anterior chamber depth was decreased following the instil-lation of pilocarpine and increased following the instilinstil-lation of atropine, compared with respective baseline scores, how-ever differences were also statistically not significant in both cases (Tables 3 and 4, respectively). Differences between pre-atropine and post-atropine IOP scores were statistically not significant (Table 3). On the contrary, the IOP scores were significantly reduced following the instillation of pi-locarpine (Table 4).
The decrease in total ocular rigidity following pilo-carpine instillation was significantly correlated with the decrease in lens rigidity (r = 0.72, p = 0.02) as well as
Tab. 1: Rigidity scores (KPa, mean ± SD, range) for all ROIs examined (ciliary body, lens, total ocular area) before and after pilocarpine instillation, paired samples t-test values and statistical significance (p).
ROI Pre-Pilocarpine Post-Pilocarpine t-test score p
Ciliary Body 9.01 ± 0.56, 7.95−10.04 12.60 ± 0.97, 10.60−13.88 2.20 0.04
Lens 30.10 ± 1.28, 29.07−31.42 19.52 ± 1.23, 18.32−21.05 2.40 0.03
Total ocular area 36.88 ± 1.66, 34.16−38.98 23.47 ± 1.08, 21.65−25.09 5.54 0.01
Tab. 2: Rigidity scores (KPa, mean ± SD, range) for all ROIs examined (lens, ciliary body, total ocular area) before and after atropine instillation, paired samples t-test values and statistical significance (p).
ROI Pre-Atropine Post-Atropine t-test score p
Ciliary Body 9.08 ± 0.55, 8.37−9.59 8.71 ± 0.99, 8.05−10.32 2.12 0.06
Lens 29.66 ± 3.88, 25.17−32.64 35.19 ± 4.32, 27.13−38.19 0.27 0.78
Total ocular area 37.77 ± 2.45, 35.18−40.22 29.66 ± 2.08, 27.44−32.33 1.40 0.19
Tab. 3: IOP, ACD and LT (mean ± SD, range) before and after atropine instillation, independent samples t-test values and statistical significance (p).
Parameter Pre-Atropine Post-Atropine t-test score p
IOP 14.50 ± 1.99, 10.25−16.32 15.80 ± 3.25, 13.78−17.05 0.12 0.88
ACD 1.80 ± 0.66, 1.70−2.08 1.96 ± 0.64, 1.27−2.25 0.45 0.69
LT 6.23 ± 0.50, 4.87−7.19 5.76 ± 0.33, 4.88−6.32 1.79 0.21
Tab. 4: IOP, ACD and LT scores (mean ± SD, range) before and after pilocarpine instillation, independent samples t-test values and statistical significance (p).
Parameter Pre-Pilocarpine Post-Pilocarpine t-test score p
IOP 13.80 ± 1.06, 10.02−15.27 10.02 ± 0.85, 8.87−11.13 2.38 0.03
ACD 2.01 ± 0.89, 1.92−2.63 1.94 ± 0.65, 1.18−2.14 0.37 0.74
with the respective decrease in IOP (r = 0.55, p = 0.04). Furthermore, the correlation between the decrease in lens rigidity following pilocarpine instillation and the respective increase in ciliary body rigidity was statistically significant (r = −0.642, p = 0.02). The ccorrelations between AL or ACD and changes in rigidity scores at all ROIs following pilocarpine instillation were statistically not significant.
Discussion
This study employed shear-wave ultrasound elastogra-phy to quantitatively evaluate in vivo changes in the rigidity of ocular structures following the instillation of atropine and pilocarpine in a rabbit eye model. Results imply that pi-locarpine induces a significant decrease in lens and total ocular rigidity as well as a significant increase in ciliary body rigidity, whereas respective changes following atropine instillation are less pronounced.
Ultrasonic waves reveal a tissue’s density and how it responds to compression forces, whereas mechanical shear waves indicate how tissues respond to shear forces, thus providing insights into tissue elasticity (6, 9). Shear-wave ultrasound elastography takes advantage of shear waves generated into the tissues though displacement caused by ultrasonic waves (6, 9). Shear wave propagation local speed is directly linked to local elasticity (6, 9). Shear-wave ul-trasound elastography offers the advantage of quantitative tissue rigidity assessment which is not available in strain ultrasound elastography (5, 6, 9). Furthermore, no pressure by the probe footprint is required to produce elastographic measurements, as opposed with strain ultrasound elastogra-phy, which requires manual compression of the tissue by the footprint of the ultrasound probe to produce elastographic images (5). The latter feature limits the use of strain ultra-sound elastography to superficial structures which may be readily compressible, whereas shear-wave ultrasound elas-tography may also be applied to deeper structures, such as the liver (10) or prostate (11). This characteristic may be particularly important in ocular elastography since the com-pression of the eye by the ultrasound probe may produce more pronounced changes in the anterior ocular segment, compared with the deeper located posterior ocular segment, thus compromising the use of strain ultrasound elastography for ocular imaging.
A previous study employing shear-wave elastographic imaging to assess corneal rigidity following photodynamic Riboflavin/UVA cross-linking in an ex vivo porcine corneal model reported a significant agreement between shear-wave elastographic measurements and elasticity simulations based on 3-D time domain finite differences (7). Findings from that study, which employed a 15 Mhz linear array immersed in water and positioned 5 mm above the corneal surface, sug-gested that the technique could also be used for real-time in vivo investigations (7). The present study aimed at assess-ing rigidity in livassess-ing ocular tissues by employassess-ing the same modality. Taking into account that deeper tissues (intraocular
The goal of elastographic imaging is to measure the elas-tic modulus of living tissues (Young’s modulus). The latter, expressed as the ratio of tensile stress versus tensile strain, is a metric of tissue bio-mechanical behaviour (18). Although ocular rigidity per se refers to the mathematical relationship between the volume tended by the eye and the IOP (19), it also reflects to a large extent the elastic properties of ocular tissues, including the ocular walls, choroid and choroidal cir-culation. The calculation of the Young’s modulus of a tissue is ideally based on assumptions on its mechanical behaviour (the tissue should be incompressible, isotropic and solid) (5). In calculating Young’s modulus for the total ocular area, fac-tors deviating from these assumptions are the cystic internal configuration and heterogeneous architecture of the eye (i.e. the eye behaves similarly to a poro-elastic body, with a solid skeleton incorporating amounts of fluid within its pores) (5). These inherent bio-mechanical characteristics of the ocular anatomy compromise to some extent the potential appli-cation of the methodology employed in the present study. Moreover, the low inherent spatial resolution of ultrasound elastography (800 μm for the central frequency of 8 Mhz of the system employed in this study) as well as the diffuse reflections created by the internal ocular interfaces due to the pressure exerted by the foot-print of the probe on the eye, cast some doubt on the true capability of ultrasound elastography to create enough speckle from the crystalline lens for accurate measurements. Diffuse ultrasound reflections from lenticu-lar interfaces may in fact create artefactual signals, which could be misinterpreted for true lenticular speckle. Another limitation of the present study is that, although the rabbit eye model has been extensively used in experimental studies, it is also known to present distinct anatomical and physiological differences compared with the human eye (20). Finally, the ocular tissues are particularly susceptible to mechanical and thermal injury associated with excessive ultrasound energy, so that the Food and Drug Administration (FDA) and World Federation for Ultrasound in Medicine and Biology have im-posed strict thermal index (TI) and mechanical index (MI) limits for diagnostic ocular ultrasound applications (TI < 1.0, MI < 0.23) (21). The fact that the system employed in this study was not ocular- rated implies that the methodology described may not be directly applicable in human eyes in its present form. Despite these limitations, the fact that the corre-lation between the increase in ciliary body rigidity following pilocarpine instillation and the respective decrease in lens rigidity was statistically significant implies that shear wave elastography can detect rigidity changes in the living eye and thus may be employed in human eyes with purpose-designed
ocular-rated ultrasound elastography systems in the future. Advantages of the technique include its non-invasive nature as well as its quantitative output. Accordingly, information obtained from shear-wave ocular elastographic imaging may be of value in the study of a variety of conditions as-sociated with the ciliary body-Zinn zonnule-lens complex, such as pseudoexfoliation syndrome, cataract or presbyopia.
References
1. Konofagou EE, Harrigan TP, Ophir J, Krouskop TA. Poroelastography: Imag-ing the poroelastic propertied of tissues. Ultrasound in Med. & Biol. 2001; 27: 1387–97.
2. Riek K, Klatt D, Nuzha H, et al. Wide-range dynamic magnetic resonance elas-tography. J Biomech. 2011; 44: 1380–6.
3. Garra BS. Elastography: current status, future prospects, and making it work for you. Ultrasound Q. 2011; 27: 177–86.
4. Wells PN, Liang HD. Medical ultrasound: imaging of soft tissue strain and elas-ticity. J R Soc Interface. 2011; 8: 1521–49. Review.
5. Detorakis ET, Drakonaki EE, Tsilimbaris MK, Pallikaris IG, Giarmenitis S. Re-al-Time Ultrasound Elastographic Imaging of Ocular and Periocular Tissues: A Feasibility Study. Ophthalmic Surgery, Lasers, Imaging. 2010; 41: 135–41. 6. Hoyt K, Hah Z, Hazard C, Parker KJ. Experimental validation of acoustic radiation
force induced shear wave interference patterns. Phys Med Biol. 2012; 57: 21–30. 7. Tanter M, Touboul D, Gennisson JL, Bercoff J, Fink M. High-resolution quanti-tative imaging of cornea elasticity using supersonic shear imaging. IEEE Trans Med Imaging. 2009; 28: 1881–93.
8. Holve DL, Gum GG, Pritt SL. Effect of sedation with xylazine and ketamine on intraocular pressure in New Zealand white rabbits. J Am Assoc Lab Anim Sci. 2013; 52: 488–90.
9. Namani R, Bayly PV. Shear wave propagation in anisotropic soft tissues and gels. Conf Proc IEEE Eng Med Biol Soc. 2009; 2009: 1117–22.
10. Kapoor A, Kapoor A, Mahajan G, Sidhu BS, Lakhanpal VP. Real-time elastog-raphy in differentiating metastatic from nonmetastatic liver nodules. Ultrasound Med Biol. 2011; 37: 207–13.
11. Zhai L, Madden J, Foo WC, et al. Characterizing stiffness of human prostates using acoustic radiation force. Ultrason Imaging. 2010; 32: 201–13.
12. Pardue MT, Sivak JG. Age-related changes in human ciliary muscle. Optom Vis Sci. 2000; 77: 204–10.
13. Celebi S, Aykan U.The comparison of cyclopentolate and atropine in patients with refractive accommodative esotropia by means of retinoscopy, autorefractometry and biometric lens thickness. Acta Ophthalmol Scand. 1999; 77: 426–9. 14. Chen YY, Chen YY, Sheu SJ, Chou P. The biometric study in different stages of
primary angle-closure glaucoma. Eye (Lond). 2013; 27: 1070–6.
15. Marchini G, Pagliarusco A, Toscano A, et al. Ultrasound biomicroscopic and con-ventional ultrasonographic study of ocular dimensions in primary angle-closure glaucoma. Ophthalmology. 1998; 105: 2091–8.
16. Bill A, Stjernschantz J. Cholinergic vasoconstrictor effects in the rabbit eye: vaso-motor effects of pentobarbital anesthesia. Acta Physiol Scand. 1980; 108: 419–24. 17. Agrawal KK, Sharma DP, Bhargava G, Sanadhya DK. Scleral rigidity in glaucoma, before and during topical antiglaucoma drug therapy. Indian J Ophthalmol. 1991; 39: 85–6.
18. Tozaki M, Fukuma E. Pattern classification of ShearWave™ Elastography images for differential diagnosis between benign and malignant solid breast masses. Acta Radiol. 2011; 52: 1069–75.
19. Friedenwald JS. Tonometer calibration; an attempt to remove discrepancies found in the 1954 calibration scale for Schiotz tonometers. Trans Am Acad Ophthalmol Otolaryngol. 1957; 61: 108–222.
20. Werner L, Chew J, Mamalis N. Experimental evaluation of ophthalmic devices and solutions using rabbit models. Vet Ophthalmol. 2006; 9: 281–91.
21. Palte HD, Gayer S, Arrieta E, et al. Are ultrasound-guided ophthalmic blocks injurious to the eye? A comparative rabbit model study of two ultrasound devices evaluating intraorbital thermal and structural changes. Anesth Analg. 2012; 115: 194–201.
Received: 03/02/2013 Accepted in revised form: 15/01/2014
Corresponding author: