Factors Affecting the Consumer Purchasing Decisions of
Perishable Foods: Exploring the Attitudes and the Preferences
Muhammad Rehan MASOOM United International University
80 UIU Bhaban, House, Road No. 8/A (Old 15), Satmosjid Road, Dhanmondi, Dhaka-1209, Bangladesh
Syed Habib Anwar PASHA Eastern University
26 House, Road 5, Dhanmondi, Dhaka-1205, Bangladesh [email protected]
S.M. Asif-Ur-RAHMAN United International University
80 UIU Bhaban, House, Road No. 8/A (Old 15), Satmosjid Road, Dhanmondi, Dhaka-1209, Bangladesh
Abstract. The present study is designed to make a comprehensive understanding of the attitude of the urban consumers and explore the factors involved in dealing with the perishable food of certain kinds. The rise of the middle class stipulates the enhancement of the shopping environment; hence witnessing a substantial increase of the number of the supermarkets in developing countries like Bangladesh will not be surprising. A number of urban supermarkets in recent times start selling perishable foods that were once available in Bangladesh only in flea markets (Kaccha Bazaar). However, due to the lack of proper infrastructure, agro-based perishable food reaches the urban market via a long process of chain mediations and raises concerns about quality and price for both retailers and consumers. Very often the attitudes of consumers regarding perishable foods are unknown and their preferences remain unidentified. This high level of uncertainty regarding the attitude of consumers and the unpopularity regarding overall food quality need to be resolved to ensure the continuity of the business and guarantee the quality of the products. This has made the study of the consumers’ attitude towards perishable food, especially relevant for emerging economies like Bangladesh. The data is collected from one hundred (100) consumers, who buy food regularly from both super-shops and flea markets in Dhaka city. The collected data are analyzed in terms of factors like importance, expectation and perceived actual level of value to show the gap in terms of perishable foods involved.
Introduction
Today’s consumers not only want food products to be of high quality, but also to meet health, safety and environmental attributes. As income increases, food consumption also changes, and consumers become more demanding in terms of the quality and safety of the products (Grunert, 2002). They are also demanding consistency and value for their money. Hence, consumers in recent years have shown their high concern about safety, quality and health issue in case of choosing and consuming foods, more specifically, perishable goods (Jacobs, Heinemans & Donegan, 2007). According to Darby and Karni (1973) quality is commonly categorized into search (e.g., appearance), experience (e.g., taste) and credence (e.g., healthy, organic, etc.) dimensions. The number of new products that have failed in the marketplace, coupled with falling brand loyalty, has created awareness among buyers of their power as they do not just passively receive the choices offered by sellers (Grunert, 2002). In addition, consumers are increasingly characterized by being health conscious and more aware of the impact of their food choices on their well-being (Gilbert, 2000). Vegetables and fruits are more and more recognized for their benefits towards healthy living (Balick & Cox, 1996). Furthermore, consumers now recognize their influence over products and stores. Therefore, it is important to understand consumer needs and preferences so that retailers and suppliers can better anticipate the changes that may happen in the future.
produce the food (e.g., information about environmental and ethical impacts) is increasingly important as these influence consumers in deciding what foods to consume. Consequently, there is a need for research that would provide an additional way for consumers to assess the quality of fresh food products.
Perishable goods marketing, according to the needs and demands of the customers have become the colossal task of the marketer because of its inherent features. Brody (2008) reports that approximately 15% of perishable goods spoil before they can be sold. Retailers could reduce food waste and keep food prices low by using the freshness indicator to help control and monitor inventories. They could stock products that have been subject to a small amount of time or temperature abuse first to reduce product loss. In addition, the indicators of identifying perishable good freshness may help consumers make better decisions about storage of fresh food products in their home environment and thereby reduce food waste. As cited by Brody (2008), a 2004 USDA report concludes that households throw away 40–50% of edible food, valued at nearly $50 billion. Hence, ensuring quality in perishable goods seems to be almost unfeasible. Perishable food scares during the past fifteen years, including salmonella in milk, have precipitated health concerns among consumers (Tslros & Heilman, 2005). These researchers found that consumers who perceive a high level of risk in perishable products checked the expiration date more frequently than consumers who did not perceive a risk. Some consumers recognized the seriousness of using out-of-date products, but did not always pay careful attention to expiration dates because they lacked information concerning the meaning of the dates (Harcar & Karakaya, 2005).
specific kinds of foodstuff may be of high significance to producers and processors in relevant businesses.
Literature review
The problem that this study is concerned about has many similarities to a firm's product line decision. A firm producing a single product and selling it in a market with an unknown demand often ends up with unsold products when demand turns out to be lower than expected. These products can be carried as inventory into the next period, but in the case of perishable products, the unsold products suffer quality deterioration and become a partial substitute for new (fresher) products. Thus, the firm's decision to carry inventory or not turns into a product line decision as the firm must now consider the effect of potential future reduction in sales volume, sales revenue, or market share of that product and introducing a one on the original product line. This poses an immediate problem of introducing products with different qualities, as some products may serve as partial substitutes for others and consumers usually will choose the product that maximizes their utility.
share from traditional markets. They discussed diagnostic and monitoring applications, and extensions of the approach to other retail contexts.
The vast majority of consumers is dissatisfied with their shopping environment, according to a major new study from Capgemini.com. A study titled “Future Consumer: How Shopper Needs and Behavior Will Impact Tomorrow’s Value Chain” finds that in some areas, such as the purchase of perishable goods, over 90% of those surveyed clearly indicated that their shopping environments need to be changed. According to the study, retailers and consumer product manufacturers need to understand consumer expectations and must address key issues such as health, wellness and affordable sustainability. They must also take into account major trends such as the increasing use of the online channel and the growing demand for on-site services to better address consumers’ needs. Capgemini surveyed more than 2,000 consumers in four countries (the UK, France, the Netherlands, and the United States). Their study indicated that today’s consumers are becoming more demanding. According to their findings, between 80% to 90% of consumers (depending on the product category) are not satisfied with stores (both brick-and-mortar and online). Moreover, most mentioned shopper concerns related to things like product issues (quality, availability), accessibility and navigation, packaging and information labeling (for example, in relation to health and wellness) as well as price perception. 85% of consumers named health as their most important concern over the coming years. Many researchers also rated sustainability as extremely important to future buying decisions.
to make a modified atmosphere. These coatings can be supplied with active compounds like antimicrobials or antioxidants to get additional desired effects. Packaging as such is very powerful against microbial spoilage, hence the loss of intrinsic product quality can be avoided and a prolonged shelf-life can be ensured. Santos et al. (2015) also demonstrated the potentiality of hyperbaric storage as a new way to preserve the quality of the food at variable room temperature, thus considering it as an alternative to refrigeration.
Perhaps, the most relevant study in this area of research is being conducted by Xiaohuan Wang, Zhi-Ping Fan, Yiming Wang, and Manning Li (2015). They have shown three important aspects of consumer attitude towards perishable foods: (1) Freshness of food and the risk of inventory storage have an effect on consumers’ willingness to pay, (2) Price differences contributes to consumer purchasing behaviors and (3) Consumers' perception of inter-temporal price fairness has an effect on buying decisions. They have also suggested that multi-period dynamic pricing strategy can help the food retailer's to meet long-term utility maximization. Thus, there are studies that are concerned with perishable foods, their quantity, price, and distribution. Most of the studies are concerned with the supply-chain and the process of distribution, whereas there is hardly any study that shows the customer’s perception and attitude towards the quality of perishable food. For long, the study of perception and attitude belong to the arena of psychology, but recently there has been a trend to understand this psychological process to interpret consumers’ behavior from a marketing point of view. Consumer behavior is the black box that is to reveal with certain systematic procedure. Existing studies regarding the consumers’ attitude tend to ignore the attitude towards perishable food that resulted in the lack of relevant studies regarding this particular research.
Objectives of the study
as a strategic tool for food retailers to increase competitive advantages. It is for this that it can control the performance of partners in the whole chain. Interestingly, supply chain management plays an important role in controlling food quality and safety. This research studied overview of supply chain concepts in developing countries and consumer perception and their buying behavior of perishable food in a Shopping Mall and ‘Kaccha bazaar’ (flea market) in Dhaka city.
The study focuses on the quality of Vegetable, fish and meat (VFM) available in the market. It will identify the following: (1) The importance of the parameters for VFM attached with quality, (2) The quality parameters for VFM evaluated by consumers, (3) The actual quality of VFM perceived by consumers, and (4) The quality gaps prevailing in the market. Finally, considering the findings of this study, some recommendations are made which might be helpful for perishable food producers and processors to enhance their competitive advantages in the food retail market.
Theoretical framework
Attitudes represent the feelings of favorability or unfavorability toward an object, person, issue, or behavior. Marketing expert Philip Kotler (1997) defines ‘attitude’ as “a lasting general evaluation” of any product or service often based on the knowledge shared about that product or service as well as the strength of the feelings such as ‘liking’ or ‘disliking’. Consumers learn these attitudes over time by being exposed to the object directly (experience) or through receiving information about the object (e.g., advertising). Attitudes serve as general guides to overt behavior with respect to the attitude object, giving rise to a consistently favorable or unfavorable pattern of response. Martin Fishbein’s (1963) attitude theory, perhaps, has the greatest influence on consumer attitude research over three decades. According to Fishbein, attitude is an independent measure of affect for or against the attitude object, which is a function of belief strength and evaluative aspect associated with each attribute. Fishbein drew his support for this proposition from behavioral learning theory. Simply stated, his contention was that an attitude toward an object is more or less automatically learned as one learns about the object itself. That is, when one learns about a new product, that learning occurs in the form of beliefs about product attributes. Therefore, Fishbein’s attitude theory captures how beliefs, attributes of a certain object lead to the attitude toward that object.
an abstraction. According to Green, the concept of attitude does not refer to any one specific act or response of an individual, but it is an abstraction from a large number of related acts or responses. Donald Campbell (1950) defines an individual’s social attitude as an enduring "syndrome of response consistency with regard to a set of social objects" (Campbell, 1950, p.31). Daniel Katz (1960) considers ‘attitude’ as "the predisposition of an individual to evaluate some symbol or object or aspect of his world in a favorable or unfavorable manner" (p.168). Arthur Cohen (1964), in writing about the group as an important source of attitude change, states that "many research findings which show that members of a group resist communications that run counter to the norms and values of the group and accept those sanctioned by it can be interpreted in terms of social approval or disapproval” (p.40). According to him, a favorable attitude to the group may be value-expressive since group gives the individual a sense of identity.
Therefore, it can be said that thinkers conceptualize attitude in a different way, some considers it is a manifestation of evaluation, where others may consider it something latent rather than an expressed behavior. However, it is clear from the above discussion that attitude is a two-part concept: when measured, it involves attitude direction and attitude intensity. Direction is the evaluative component and it reflects performance on a given dimension. Direction is often measured using a 5-point Likert scales that range from Delight to Failure, Like to Dislike, or Excellent to Poor. On the other hand, Intensity of attitude is the important component that reflects that some attitudes are held more strongly than others. Important is often measured using a 5 point Likert scale that ranges from ‘Very Important’ to ‘Not at all Important’. The key to proper measurement of attitudes is to combine the evaluation and importance measures so that the importance scores weight the evaluation measures.
Methodology
previous research related to the area of interest, hence it is utterly not possible to delineate the survey population. For that, the survey is formulated on the consumers, who were present at the shopping mall to buy the perishable food (vegetable, fish and meat) at the time of the data collection period and agreed to participate in the survey. The data are collected on the consumers who regularly visit any of the three most popular super-shops of ‘Dhanmondi Area’ in Dhaka city, namely the Shawpno, the Meena bazaar, and the Agora. Initially, a filtered question is asked, whether they buy only from these super-shops or purchases from one of these shops as well as from any flea markets, like ‘Zigatola Kaccha Bazar’ or ‘Notun Bazar.’ The information is gathered from only those customers, who buy perishable foods from both super-shops and flea markets.
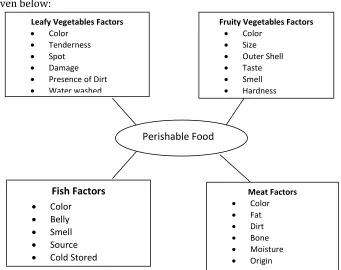
The questionnaire of the survey, considered four different types of perishable food as the subject to be analyzed; (a) leafy vegetables, (b) fruity vegetables, (c) fish, and (d) meat. There are certain factors involved with every type of food. Such as color, tenderness, spot, damage, physical dirt and water-wash for leafy vegetables; color, size, outer-shell, taste, smell and hardness for fruity vegetables; color, belly, smell, source, cold-storing for fish; and color, fat, presence of dirt, bone, moisture and origin for meat. The questions were set to ask three categories of responses (High, Medium, Low) from each factor of four different types of perishable foods. The responses contain as the level of importance, the expectation level and the actual perceived level that the respondents were getting from the market. The research was conducted using non-probability sampling. Implying sophisticated statistical analysis with the data collected from the field was not possible because of lack of randomization. Therefore, judgmental sampling technique was employed. The sample size of the research reached 100 respondents. This sample size roughly represents one million respondents (95% confidence level, 10 confidence interval). The data are presented in accordance with the importance of factors, the expectation and perceived actual value that they are getting while buying perishable food.
Consumers’ attitude toward perishable food
buying leafy vegetables, fruity vegetables, fish and meat. These factors are given below:
Figure 1. Factors affecting the perceived quality of Parishable Foods
The study explores that all factors are not equally important for all kinds of perishable food, some are highly important as a criteria, whereas some others are to be expected at the best level of availability. Sometimes, it differs that consumers, giving importance of certain factor is low, but the expectation is very high. There is a gap between the ‘level of expectation’ and the ‘actual value’ received from the market. While constructing the scale of values, the study considered that from 1 to 7 on the rating scale is low, 8 or 9 is medium and 10 is high.
Leafy Vegetables
Table 1 shows the most important factor for buying leafy vegetables is free. More than half of the respondents (55%) consider damage-freeness is their highest priority. Among the other factors, the presence of dirt is very important as well; exactly half of the respondents consider this as their most important priority. Some other factors like color and tenderness
Perishable Food Leafy Vegetables Factors
Color
Tenderness
Spot
Damage
Presence of Dirt
Water washed
Fruity Vegetables Factors
Color
Size
Outer Shell
Taste
Smell
Hardness
Fish Factors Color
Belly
Smell
Source
Cold Stored
Meat Factors
Color
Fat
Dirt
Bone
Moisture
is relatively high to be considered, 46% respondents consider color as their highest priority, whereas 43% respondents consider that tenderness is their highest priority. Surprisingly, water washed is not very important for the consumers, 31% consumers consider that water washed is their low priority, whereas another 34% give that as middling priority, and almost the same number of respondents, 35% considers this as their highest priority.
Table 1. Weighted values of factors of leafy vegetable (in percentage)
Level Color Tenderness Spot Damage Presence of Dirt washed Water
Low 13.0 19.0 31.0 23.0 30.0 31.0
Medium 41.0 38.0 28.0 22.0 20.0 34.0
High 46.0 43.0 41.0 55.0 50.0 35.0
Total 100.0 100.0 100.0 100.0 100.0 100.0
Thus, factors like color, tenderness, spot, damage-freeness, the presence of dirt and water-washed are not equally important to the customers, some factors are more important than others. Respondents consider that damage-freeness is the most important factor while they are buying leafy vegetables. On the other hand, water-washed leafy vegetables are moderately important while they are going to buy this.
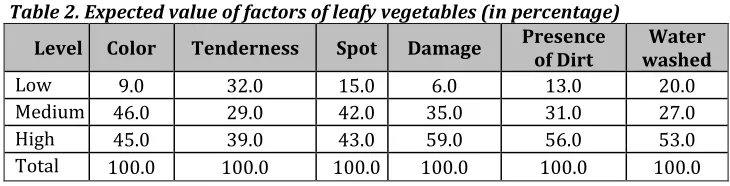
Table 2 shows that there is a low tolerance level of damage; most of the respondents, 59% expect that the leafy vegetables should be totally damage-free. While considering the presence of dirt, 56% expect highly that there would be no dirt at all and 53% of the respondents consider that the leafy vegetables should be properly water-washed. Surprisingly, tenderness does not seem as a factor that consumers expect to be at its best, 32% set low expectation level for the tenderness of leafy vegetables. There is a medium expectation level of color, more than half (46% + 9% = 55%) of the consumers expect moderately light color. Surprisingly, many people, 42% set their expectation level of spot at medium.
Table 2. Expected value of factors of leafy vegetables (in percentage)
Level Color Tenderness Spot Damage Presence of Dirt washed Water
Low 9.0 32.0 15.0 6.0 13.0 20.0
Medium 46.0 29.0 42.0 35.0 31.0 27.0
High 45.0 39.0 43.0 59.0 56.0 53.0
Thus, the consumer expects highly that the leafy vegetable should be damage-free, there would be hardly any dirt and it should be water-washed properly.
Table 3. Actual value of factors of leafy vegetables (in percentage)
Level Color Tenderness Spot Damage Presence of Dirt washed Water
Low 73.0 84.0 93.0 84.0 81.0 78.0
Medium 23.0 16.0 7.0 16.0 19.0 22.0
High 4.0 0.0 0.0 0.0 0.0 0.0
Total 100.0 100.0 100.0 100.0 100.0 100.0
Consumers complain mostly for the spot at the leafy vegetables. Table 3 above shows that the overwhelming majority, 93% of the respondents think that the actual value they are getting in terms of spot-freeness is low. There are 84% respondents who consider that they are receiving low level value in terms of tenderness and damage-freeness. Near about one-fourth to one-fifth of the respondents thinks that the value that they are actually getting in terms of factors like color and water-washed is medium. That is they are getting moderate color of leafy vegetables.
Thus, spot, followed by tenderness, damage and presence of dirt are the factors that most of the respondents consider as available with low actual value.
Therefore, damage-freeness is the most important factor while they are buying leafy vegetables, whereas they highly expect that it should be damage-free, there would be hardly any dirt and it should be water-washed properly. However, they most of the respondents are complaining about low available value of spot tenderness, damage and presence of dirt.
Fruity vegetables
fruit-vegetables. However, 36% of the respondents give low priority and 42% give medium priority to hardness. Only 22% give high priority to this (hardness) criterion.
Table 4. weighted values of Factors of fruit-vegetables (in percentage)
Level Color Size Outer Shell Taste Smell Hardness
Low 11.0 27.0 28.0 7.0 9.0 36.0
Medium 40.0 48.0 41.0 16.0 26.0 42.0
High 49.0 25.0 31.0 77.0 65.0 22.0
Total 100.0 100.0 100.0 100.0 100.0 100.0
Thus, size, hardness and outer shell of fruit vegetables are not as important as taste, smell and color. Taste is the most important factor to consumers while buying fruity vegetables. Respondents give moderate importance to color. On the other hand, they give least importance to the hardness of the fruity vegetables.
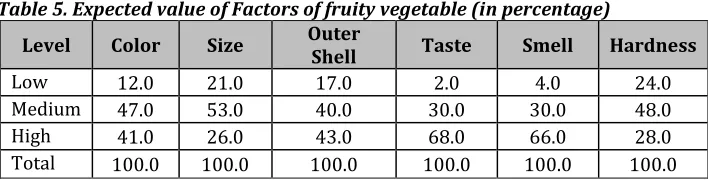
Consumers do not expect all factors such as color, size, outer shell, taste, smell and hardness of fruit vegetables would be very appropriate. Table 5 shows that there is a higher expectation for some certain criteria, whereas some factors are not expected as such. Size is not expected to be very precise, more than half of the respondents, 53%, expect moderately that size suppose to be accurate. The most important factors that the consumers expect are to be best in taste and smell. The majority of the customers’ (68% for taste and 66% for smell) expectation of taste and smell is high. Hardness is a relatively less expected factor; only 28% of the respondents expect this at the best. Many consumers, 41% expect that color should be appropriate. Again, many consumers, 43% expect that outer shell should be accurate.
Table 5. Expected value of Factors of fruity vegetable (in percentage)
Level Color Size Outer Shell Taste Smell Hardness
Low 12.0 21.0 17.0 2.0 4.0 24.0
Medium 47.0 53.0 40.0 30.0 30.0 48.0
High 41.0 26.0 43.0 68.0 66.0 28.0
Total 100.0 100.0 100.0 100.0 100.0 100.0
Customers’ perception about the actual value they get from the perishable food that they are buying from the market place actually varies. Noticeably, there is a lowness regarding all the factors of fruity available in the market place. From table 6, it can be said that the overwhelming majority, near about 80% or so consider that they are actually getting low value in terms of color, size, outer shell and smell. Only 16% consider that moderate hardness is available, and 84% of the consumers consider hardness they are getting from the fruity vegetable is of low value.
Table 6. Actual value of Factors of fruity vegetables (in percentage)
Level Color Size Outer Shell Taste Smell Hardness
Low 79.0 80.0 79.0 76.0 80.0 84.0
Medium 19.0 20.0 15.0 21.0 20.0 16.0
High 2.0 0.0 6.0 3.0 0.0 0.0
Total 100.0 100.0 100.0 100.0 100.0 100.0
Thus, consumers consider hardness, smell, size and taste that they are getting while they are buying fruity vegetables are at low level, whereas they consider outer-shell is relatively appropriate.
Therefore, it can be said that while consumers are buying fruity vegetables, they consider smell and color as very important and they expect two factors, smell and taste as suppose to be at the best. However, they are receiving low value for all these three (color, smell and taste) factors.
Fish
Table 7. Weighted values of Factors of fish (in percentage)
Level Color Belly Smell Source Cold Stored
Low 16.0 12.0 10.0 31.0 32.0
Medium 32.0 45.0 26.0 42.0 36.0
High 52.0 43.0 64.0 27.0 32.0
Total 100.0 100.0 100.0 100.0 100.0
Thus, the smell of fish is the most important factor for consumers when they buy fish. Secondly, they check the color of gill. The condition of belly is moderately important to them. However, the other two criteria, source and the way of storage, are not so important to all customers.
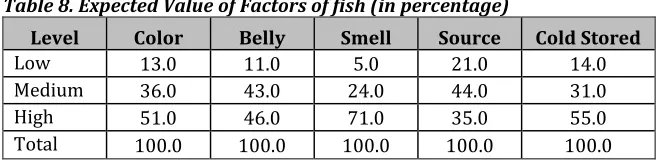
Table 8. Expected Value of Factors of fish (in percentage)
Level Color Belly Smell Source Cold Stored
Low 13.0 11.0 5.0 21.0 14.0
Medium 36.0 43.0 24.0 44.0 31.0
High 51.0 46.0 71.0 35.0 55.0
Total 100.0 100.0 100.0 100.0 100.0
The above table (table 8) shows that smell of fish is expected to be accurate to most of the respondents; 71% of the respondents expect high accuracy and 24% of the respondents expect moderate accuracy. However, the table also shows that 46 and 35% of the respondents seek high expectation for condition of the belly and source of fish accordingly; which means consumers do not expect the condition of the belly and the source of fish to be very precise. Noticeably, 55% of the respondents do not prefer frozen fish and 51% of the respondents expect bright color of gill. Here it is also found that 46% of the respondents expect that the fish should not be captured fish rather should be cultured.
Thus, consumers expect the smell of high quality fish should be accurate. They are also moderately concerned about the accuracy of the color of gill and they expect that the high quality fish should have bright red gill. More than half of the consumers expect non-frozen fish. On the other hand, the condition of the belly and the source of fish need not be as accurate as other factors.
color, smell, source and cold stored of the fish. Near about one-fifth of the respondents perceived that, the actual value of the fish while judging factors involve color, belly and smell is moderate. No respondent believes that high value is being offered due to lack of hardness of the belly of any particular fish.
Table 9. Actual values of Factors of fish (in percentage)
Level Color Belly Smell Source Cold Stored
Low 76.0 77.0 76.0 95.0 82.0
Medium 22.0 23.0 22.0 3.0 16.0
High 2.0 0 2.0 2.0 2.0
Total 100.0 100.0 100.0 100.0 100.0
Thus, consumers perceive that they got very low value if they judged the source of the fish. This low value is also evident while they judged whether the fish is cold-stored or not. Some respondents consider that they get medium level values when they judge the fish in terms of color, belly, and smell.
Therefore, the important factors while judging fish is the smell of the particular fish and the color of gill, whereas customers’ expectations centered around the source of the fish and how it is being preserved, like cold stored or not.
Meat
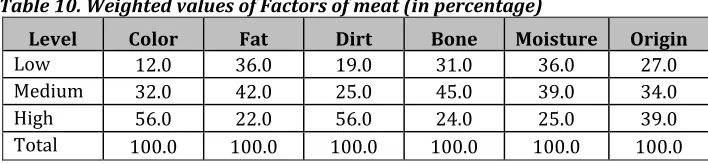
Table 10. Weighted values of Factors of meat (in percentage)
Level Color Fat Dirt Bone Moisture Origin
Low 12.0 36.0 19.0 31.0 36.0 27.0
Medium 32.0 42.0 25.0 45.0 39.0 34.0
High 56.0 22.0 56.0 24.0 25.0 39.0
Total 100.0 100.0 100.0 100.0 100.0 100.0
Thus, it can be said that color and cleanliness of meat are two most important factors for consumers when they buy meat. Origin of meat is moderately important to them. However the other three criteria: the amount of fat, the amount of bone and the moisture are not as important as color and cleanliness of meat to consumers.
Table 11 shows that there are mixed responses regarding the expected value related to all criteria of judging any type of meat. One noticeable factor is this, more than half (61%) of the respondents expect that there would be no dirt while they are intended to buy meat. Exactly half of the respondents’ expectation tends to be high while the judging factor is the origin of the meat. More than one-third of the respondents expect that moisture and bone suppose to be low, whereas exactly one fifth of the respondents expect high value regarding these two factors. Only 15% of the respondents expect a low value while the deciding factor is the color of the meat; this implies that color is an important criterion. Noticeably, near about half (46%) of the respondents are ready to accept a medium level of the presence of fat.
Table 11. Expected Value of Factors of meat (in percentage)
Level Color Fat Dirt Bone Moisture Origin
Low 15.0 32.0 12.0 35.0 38.0 19.0
Medium 41.0 46.0 27.0 45.0 42.0 31.0
High 44.0 22.0 61.0 20.0 20.0 50.0
Total 100.0 100.0 100.0 100.0 100.0 100.0
Thus, it can be said that customers expect a high value while it is a matter of cleanness and they are ready to tolerate some bones and moisture. The origin of the meat that is whether ‘Indian’ or ‘local’, plays a crucial role as a deciding factor.
85% of the respondents think as such. No respondents think that a high value is being provided while it is the moisture of the meat. Lots of respondents (86%) consider that they are getting low value because of the excessive bones. Near about one-third (29%) of the respondents consider that a medium value is being offered regarding color. Almost one-fourth (24%) of the respondents perceived that a medium value level is there concerning the origin of meat.
Table 12. Actual values of Factors of meat (in percentage)
Level Color Fat Dirt Bone Moisture Origin
Low 69.0 85.0 70.0 86.0 91.0 74.0
Medium 29.0 12.0 27.0 12.0 9.0 24.0
High 2.0 3.0 3.0 2.0 0.0 2.0
Total 100.0 100.0 100.0 100.0 100.0 100.0
Thus, it can be said that consumers consider the low actual value while it is about the fat, bone and moisture of the meat. There are some customers who consider that color and origin of the meat are being valued moderately, whereas there is no one who perceived highly while it is the matter of moisture of the meat.
Therefore, it can be said that color and cleanness are the important criteria while judging meat and customers expect cleanness with very high value level. Color plays a crucial role a deciding factor, but a low level of actual value is being provided.
Measuring the gap between the Expected Value and Perceived Actual Value
Not every time customers’ expected value meets the perceived actual value while buying perishable foods. However, there are certain differences from one customer to another regarding the gap of expectation and perceived actual value. Further, not every factor of each kind of food like leafy vegetables, fruity vegetables, fish and meat can meet the expectation with equal degree of satisfaction. Again, the factors vary in accordance with the type of food as well.
following formula while calculating the gap between expected value and perceived actual value.
Gap = (Expected Value – Perceived Actual Value) x Weighted Value.
That is, if the expected value and the perceived actual value became the same, there would be no gap. The responses varied from 0 to more than 70, and for certain readiness to meet the focus of the study, the values are being categorized into three levels. From 0 to 25, the gap is being considered as low; from 26 to 50 the gap is considered as a medium and for more than 51 it is labeled as high gap. Thus, the study can imply that the higher the gap, the higher that level of dissatisfaction whereas the low the gap the higher the satisfaction. By doing this, the study can show the satisfaction level and thus can reach to the decision regarding the differences that the customers perceived value as their source of dissatisfaction.
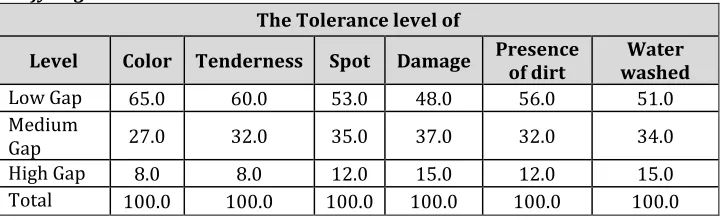
Table 13 shows that the gap is lower while the color is the deciding factor about the leafy vegetables. However, the dissatisfaction is higher when it comes to the tolerance level of spot and damage. From table 13 it can be said that 53% of respondents consider that the gap is less while the factors are tolerance level of spot and damage. It is very low while the factor is water-washed. Noticeably, 15% of the respondents consider that there is a high difference between the expected and perceived actual value of water-washed. The gap between expectation and perceived actual value regarding the factor like tolerance level of damage is relatively moderate.
Table 13. Gap between the Expected and Perceived Actual Level of Factors of Leafy Vegetables
The Tolerance level of
Level Color Tenderness Spot Damage Presence of dirt washed Water Low Gap 65.0 60.0 53.0 48.0 56.0 51.0 Medium
Gap 27.0 32.0 35.0 37.0 32.0 34.0
High Gap 8.0 8.0 12.0 15.0 12.0 15.0
Total 100.0 100.0 100.0 100.0 100.0 100.0
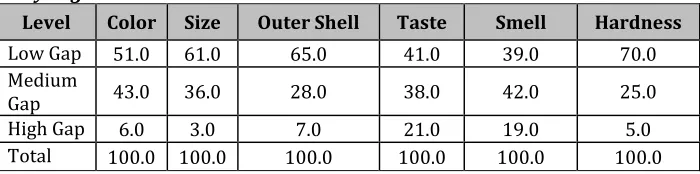
like color and taste respectively. Noticeably 21% of the respondents stated that there is a huge gap between their expectation level and perceived actual level for the factor taste.
Table 14. Gap between the Expected and Perceived Actual Level of Factors of Fruity Vegetables
Level Color Size Outer Shell Taste Smell Hardness Low Gap 51.0 61.0 65.0 41.0 39.0 70.0 Medium
Gap 43.0 36.0 28.0 38.0 42.0 25.0
High Gap 6.0 3.0 7.0 21.0 19.0 5.0
Total 100.0 100.0 100.0 100.0 100.0 100.0
Table 15 shows that there is a higher gap between expectations and perceived actual value regarding smell of the fish. A large number of respondents (48%) consider that they are not very satisfied with the source of the fish that they are buying. Surprisingly, there is a less gap between the expectations and perceived actual value regarding cold stored, almost half of the respondents considered that level of gap is low about the cold stored factor. The higher dissatisfaction among the factors while buying fish is ‘smell’, 20% of the respondents consider that there is a high gap between the expectations and perceived actual value. Noticeably, almost half of the respondents (47%) consider that the gap is low.
Table 15. Gap between the Expected and Perceived Actual Level of Factors of Fish Level Color Belly Smell Source Cold Stored
Low Gap 44.0 47.0 43.0 44.0 49.0
Medium Gap 43.0 42.0 37.0 48.0 35.0
High Gap 13.0 11.0 20.0 8.0 16.0
Total 100.0 100.0 100.0 100.0 100.0
Table 16. Gap between the Expected and Perceived Actual Level of Factors of Meat Level Color Fat physical dirt Presence of Bone Moisture Origin
Low Gap 58.0 63.0 52.0 66.0 65.0 57.0
Medium Gap 35.0 30.0 30.0 31.0 29.0 32.0
High Gap 7.0 7.0 18.0 3.0 6.0 11.0
Total 100.0 100.0 100.0 100.0 100.0 100.0
Thus, the study found that there are certain factors that have a higher gap of expectation-actual level. Noticeably, there are a lot of respondents who are more or less satisfied with what they are getting from the market at the present condition.
Conclusion
There are certain factors that are more important, expected with high value and a matter of concern for the level of perceived actual value. However, there are many respondents are more or less satisfied with what they are getting from the market at the present condition. The investigation implies that the supermarket need to preserve the actual shape of the leafy vegetables and a special care is needed while handling these sorts of vegetables, because the damaged leaves drives away the customers buy those. Although the general believe is customers prefer fruit-vegetables that are relatively big in size, but the study indicates that the color, not the size that the customers measures at the point of purchase. Hence, the availability of proper lightings needs to be ensured at the location of the supermarket where fruit vegetables are intended to keep. Other than general factors like the smell, the color of gill and the condition of the belly of the fish, consumers often tend to judge the quality based on where it is preserved in the supermarket. Hence, keeping fish in the refrigerators may decrease the number of sales of fish. Generally, retailers perceive that buyers are willing to avoid bones when they are buying meats; however, the research indicates that the consumers valued the color and cleanliness lot more than that of the presence of fat or bones. Thus, meat needs to be properly cleaned, not just chopped and hanged to sell in large volume.
References
Balick, M.J., and Cox, P.A. (1996). Plants, people, and culture: the science of ethnobotany. New York: Scientific American Library.
Brody, A. (2008). How Green Is Food Waste?. Food Technology, 62(6), 121–126. Campbell, D.T. (1950) The Indirect Assessment of Social Attitudes. Psychological
Bulletin, 47, 15-38.
Chen, H.K., Hsueh, C.F., and Chang, M.S. (2009). Production scheduling and vehicle routing with time windows for perishable food products. Computers & operations research, 36(7), 2311-2319.
Cohen, A.R. (1964). Attitude Change and Social Influence. New York: Basic Books. Darby, M.R., and Karni, E. (1973). Free competition and the optional amount of
fraud. The Journal of Law and Economics. 16(1), 67-88.
Farhangmehr, M., Marques, S., and Silva J. (2001). Hypermarkets versus traditional retail stores — consumer and retailers’ perspectives in Braga: a case study. Journal of Retailing and Consumer Services, 8(4), 189–198.
Fishbein, M. (1963). An Investigation of the Relationships between Beliefs about an Object and the Attitude Toward That Object. Human Relations, 16(3), 233-240.
Goldman, A., Ramaswami, S., and Krider, R.E. (2002). Barriers to the Advancement of Modern Food Retail Formats: Theory and Measuremen. Journal of Retailing, 78(4), 281-295.
Green, B.F. (1953). Attitude Measurement. In G. Lindzey (ed.) Handbook of Social Psychology (Vol. 1, p.335). New Jersey: Wiley & Sons.
Grunert, K.G. (2002). Current issues in the understanding of consumer food choice. Food Science and Technology, 13(3), 275-285.
Guilbert, S., Gontard, N., and Gorris, L.G. (1996). Prolongation of the shelf-life of perishable food products using biodegradable films and coatings. LWT-Food Science and Technology, 29(1), 10-17.
Harcar, T., and Karakaya, F. (2005). A Cross-Cultural Exploration of Attitudes toward Product Expiration Dates. Psychology & Marketing, 22(4), 353-371. Hsu, C.I., Hung, S.F., and Li, H.C. (2007). Vehicle routing problem with time-windows
for perishable food delivery. Journal of Food Engineering, 80(2), 465-475. Jacobs, K., Heinemans, L., and Donegan, P. (2007), Future consumer: how shopper
needs and behaviour will impact tomorrow’s value chain, Capgemini report. Retrieved from
http://www.capgemini.com/industries/products/future_consumer. Katz, D. (1960). The Functional Approach to the Study of Attitudes. Public Opinion
Quarterly, 24(2), 163-204.
Kotler, P. (1997). Marketing Management: Analysis, Planning, Implementation and Control (9th Edition). Upper Saddle River, NJ: Prentice Hall.
Lewis, C. (2002). Food Freshness and “Smart” Packaging. U.S. Food and Drug Administration FDAConsumer Magazine, 36(5). Retrieved from http://www.fda.gov/Food/default.htm.
Novaes, A.G., Lima, O.F. Jr, Carvalho, C.C.D., and Bez, E.T. (2015). Thermal
Performance of Refrigerated Vehicles in the Distribution of Perishable Food. Pesquisa Operacional, 35(2), 251-284.
Ragaert, P., Verbeke, W., Devlieghere, F., and Debevere, J. (2004). Consumer perception and choice of minimally processed vegetables and packaged fruits. Food Quality and Preference, 15(3), 259-270.
Santos, M.D., Queirós, R.P., Fidalgo, L.G., Inácio, R.S., Lopes, R.P., Mota, M.J., Sousa, S.G., Delgadillo, I., and Saraiva, J.A. (2015). Preservation of a highly perishable food, watermelon juice, at and above room temperature under mild pressure (hyperbaric storage) as an alternative to refrigeration. LWT-Food Science and Technology, 62(1), 901-905.
Tslros, M., and Heilman, C. (2005). The Effect of Expiration Dates and Perceived Risk on Purchasing Behavior in Grocery Store Perishable Categories. Journal of Marketing, 69(2), 114-129.