1 Samad Zahermand Khosrow Shafiei Motlagh
1 , 2 ,Department of Civil Engineering, Dehdasht Branch , Islamic Azad University,
Dehdasht, Iran
Corresponding Author:Samad Zahermand [email protected]
ABSTRACT
The expansion of societies and an increase in vehicles have led to realizing many waste tires annually in almost all countries. These tires enter environment and cause serious problems. In some cases, soils should be improved for the use in geotechnical projects. These factors may come together, leading to finding appropriate applications of waste tires. Given the important role that the aspect ratio on shear strength of sand chips in this investigation and study author with the help of artificial neural network to predict the optimal aspect ratio pays rubber chips. In this study, using the results of direct shear tests were carried out on sandy soil reinforced with rubber chips to within 2 cm and a length to width ratio 30.15% by volume and 50 different three chips, with two different density, an artificial neural network built to predict the strength parameters sandy soils reinforced with chips tires with a width of 3 and 4 cm with an aspect ratio of 1 to 14 with hundreds of letters of 15 and 30 and 50 deals with the aspect ratio optimally offers. Forecast neural network demonstrates the length to width ratio rubber chips are effective shear strength parameters of the concrete sand, so that only a certain width to any length to width ratio can have a maximum of shear strength parameters.
KEYWORDS: rubberchips, artificial neural network, strength parameters,reinforcement
1.INTRODUCTION
There are several methods to overcome the weakness of the soil. But what has attracted the attention of many researchers, is the debate about arming the soil. At the beginning of the tape and steel bars used for soil reinforcement, but with the advancement of science, the use of polymer textiles such as geosynthetics, have been alternative materials[
7
]
. Due to the increasing population and a significant increase in molded plastic and rubber human need, the need to manage and plan for remediation or using this material again and remove solid waste, more than ever, and need macro programming. Research shows that the increase in cement much impact on the internal friction does not soil grains, while fiber-reinforced soil internal friction angle is increased.Gary and viscera (1983) direct shear tests on different samples of soil with a small box made of sandstone. The pair of Reinforcement of different material of plastic, copper and natural fibers used during various tests 3, 6, 12 and 22 pieces of these fibers with the sand dry mix and resistance sand with gravel reinforced with fiberglass compared. These fibers in place during the box cutting angles 30, 60, 90, 120 and 150 degrees were cut surface.Gray and Ohashi (1983) with regard to direct shear tests have shown that reinforcement fibers increases and peak-peak shear strength after the failure in the shear strength limit. Their study did not show an increase in hardness mixed concrete sand.Gary and al-Rifai (1986) with respect to studies on the sand triaxial apparatus that is randomly distributed fiber demonstrated that fiber increases the ultimate shear strength. They also show that the reinforcement of uniaxial strain at rupture increases and in most cases reduces peak after failure.Kumar et al. (1999) based on
International Journal of Research Publications
Volume-3, Issue-1,April 2018
Accepted and Published Manuscript
Study of Changes in Sand Strength Parameters Due to Reinforcement by
Rubber Chips
Samad Zahermand
PII : Samad Zahermand.100315201867
DOI: 100315201867
Web: http://ijrp.org/paper_detail/68
To appear in: International Journal of Research Publication (IJRP.ORG)
Received date: 12 Apr 2018
Accepted date: 28 Apr 2018
Published date: 06 May 2018
Please cite this article as: Samad Zahermand , Study of Changes in Sand
Strength Parameters Due to Reinforcement by Rubber Chips ,
International Journal of Research Publication (Volume: 3, Issue: 1),
http://ijrp.org/paper_detail/68
This is a PDF file of an unedited manuscript that has been accepted for
publication. As a service to our customers we are providing this final
version of the manuscript.
1
Study of Changes in Sand Strength Parameters
Due to Reinforcement by Rubber Chips
Samad Zahermand
1Khosrow Shafiei Motlagh
21 , 2 ,
Department of Civil Engineering, Dehdasht Branch , Islamic Azad University,
Dehdasht, Iran
Corresponding Author:Samad Zahermand
ABSTRACT
The expansion of societies and an increase in vehicles have led to realizing many waste tires annually in almost all countries. These tires enter environment and cause serious problems. In some cases, soils should be improved for the use in geotechnical projects. These factors may come together, leading to finding appropriate applications of waste tires. Given the important role that the aspect ratio on shear strength of sand chips in this investigation and study author with the help of artificial neural network to predict the optimal aspect ratio pays rubber chips. In this study, using the results of direct shear tests were carried out on sandy soil reinforced with rubber chips to within 2 cm and a length to width ratio 30.15% by volume and 50 different three chips, with two different density, an artificial neural network built to predict the strength parameters sandy soils reinforced with chips tires with a width of 3 and 4 cm with an aspect ratio of 1 to 14 with hundreds of letters of 15 and 30 and 50 deals with the aspect ratio optimally offers. Forecast neural network demonstrates the length to width ratio rubber chips are effective shear strength parameters of the concrete sand, so that only a certain width to any length to width ratio can have a maximum of shear strength parameters.
KEYWORDS
: rubberchips, artificial neural network, strength parameters,reinforcement1. INTRODUCTION
There are several methods to overcome the weakness of the soil. But what has attracted the attention of many researchers, is the debate about arming the soil. At the beginning of the tape and steel bars used for soil reinforcement, but with the advancement of science, the use of polymer textiles such as geosynthetics, have been alternative materials[ 7
]. Due to the increasing population and a significant
increase in molded plastic and rubber human need, the need to manage and plan for remediation or using this material again and remove solid waste, more than ever, and need macro programming. Research shows that the increase in cement much impact on the internal friction does not soil grains, while fiber-reinforced soil internal friction angle is increased.Gary and viscera (1983) direct shear tests on different samples of soil with a small box made of sandstone. The pair of Reinforcement of different material of plastic, copper and natural fibers used during various tests 3, 6, 12 and 22 pieces of these fibers with the sand dry mix and resistance sand with gravel reinforced with fiberglass compared. These fibers in place during the box cutting angles 30, 60, 90, 120 and 150 degrees were cut surface.Gray and Ohashi (1983) with regard to direct shear tests have shown that reinforcement fibers increases and peak-peak shear strength after the failure in the shear strength limit. Their study did not show an increase in hardness mixed concrete sand.Gary and al-Rifai (1986) with respect to studies on the sand triaxial apparatus that is randomly distributed fiber demonstrated that fiber increases the ultimate shear strength. They also show that the reinforcement of uniaxial strain at rupture increases and in most cases reduces peak after failure.Kumar et al. (1999) based on
2
laboratory observations on silty sand ash armed with random distribution of polyester fibers have stated that the amount optimum for either mode fiber silty sand or ash almost 3% to 4% of the weight dries. Contradictions between the report shows that differences in material properties and test results are causing the problem.Yoon et al. (2014) in a study entitled sands armed with rubber bearing capacity and meeting the. Turgut & Yesilata in 2010 in a study as physical performance - mechanical and thermal bricks added fresh rubber expanded consideration.Tafreshi & Norouzi in 2012 in a study as a wake-square-modeled real bearing capacity of the crumb rubber on concrete sand - an empirical study into consideration. Application set or combination of methods to achieve higher goals and more complicated "methodology" they say, such method or methods of research and theorizing about the man. (Earth, 2012). In this branch of relying on theoretical principles, materials and environmentally appropriate to improve some soil engineering properties such as strength, hardness, ductility, reduce meeting, change forms and increase tensile strength and shear components caused by the friction in the contact surface between soil and reinforcement materials. [ 9
]. Using the criteria, rules and
standards in the planning, operation and maintenance of projects in terms of technical and economic feasibility of projects, quality of design and implementation, and maintenance and operation costs, is important[ 8
. Technical and operational system of the country deployment criteria, standards and
technical regulations in the development and implementation of the necessary attention to the maintenance costs of the projects put strong emphasis. (Stale et al., 2013).In the present study will be discussed. in detail the effect of the chip size due to changes in other parameters such as vertical stress, the weight of the mixture of sand and rubber chips, the percentage of mixed-use rubber in different widths as well as variation of the ratio of length different width rubber chips Solid waste management is one of the major environmental concerns worldwide. In India, the scrap tyres are being generated and accumulated in large volumes causing an increasing threat to the environment.In order to eliminate the negative effect of these depositions and in terms of sustainable development, there is great interest in the recycling of these non -hazardous solid wastes. The potential of using rubber from worn tyres in many civil engineering works has been studied for more than 30 years. Applications where tyres can be used have proven to be effective in protecting the environment and conserving natural resources[ 10
]. In recent times with the increase in the demand
for infrastructure and feasible foundation design in not applicable due to poor bearing capacity of ground soil stabilization has started to take a new shape.Stabilizationis processof fundamentally changing the chemical properties of soft soils by adding binders or stabilizers, either in wet or dry conditions to increase the strength and stiffness of the originally weak soils(Yilmez and egirmenci,[1]; Lee and Lee,[2]).With the availability of better research, materials and equipment soil stabilization is emerging as a popular and cost-effective method for soil improvement[ 14
]. With the availability of
better research, materials and equipment soil stabilization is emerging as a popular and cost-effective method for soil improvement. In the present investigation attempt is made to stabilize black cotton soil and shedisoil. Black cotton is collected from Vidyagiri area of Bagalkotcityandshedi soil is collected from Haliyal road of Dharwad cityarea with randomly distributed shredded rubber tyrechips with 5%, 10%, 15% and cement with 2% and 4% percentage[ 12
]. The unconfined and CBR tests were
carried out in the laboratory for different mix proportions of rubber with black cotton soil and shedi soil.When cement is mixed with soil, generally there will be reduction in liquid limit, plastic limit and the potential for volume change of soils (Bell[3]). But there will be increase in the shrinkage limit and shear strength. The increase in strength of cement treated soil is by primary and secondary cementations reactions in the soil cement matrix[ 13
]. The primary cementation is due to hydration
3
chips and their mix with sand can be used as a lightweight material for the bankment
behind the retaining wall and reinforce the soft soils in road construction. Also,
according to the results of this study, sand and rubber chips mixtures have higher
resistance,compressibility and permeability than unmodified soils. In some cases,
environmental assessments have been carried out on the rubber-reinforced embankments
by
[17-18]
, they concluded that waste tires had less impact on groundwater quality for a
2-year process. Significant advances have been made in using pure rubber chips or full
tires as the embankment materials in transportation
substructures [19-20]
.
2. DISCUSSION
In this study, using data from direct shear tests on sand samples only and a mixture of sand and rubber with double density γ = 15/5 KN/m ^ 3 (low density) and γ = 16/8 KN/m ^ 3 (density), three per cent of the volume of rubber in the mix at 15, 30 and 50 and a width of 2 cm rubber chips 1,2,3,4,5,6,7 aspect ratio that results in tables 4-1 to 4-7 presented, trying to model the friction angle (degrees) and adhesion are using neural network.
Table 4-1 large direct shear tests on sand at two different densities
Special Weight
𝛾 = 15/5 𝐾𝑁 ⁄ 𝑚^3 𝛾 = 16/8 𝐾𝑁 ⁄ 𝑚^3
Internal friction angle (degrees) 31
40.9
Adhesion (Kpa) 0
0
Table 4-2 test results of large direct shear on the mixture of sand and 15% by volume tires with a width of 2 cm and less density mode
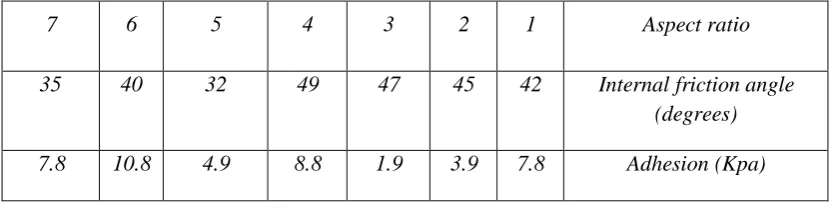
Table 4-3 test results of large direct shear on the mixture of sand and 30% by volume tires with a width of 2 cm and less density mode
Aspect ratio 1
2 3
4 5
6 7
Internal friction angle (degrees) 42
45 47
49 32
40 35
Adhesion (Kpa) 7.8
3.9 1.9
8.8 4.9
10.8 7.8
4
Aspect ratio 1 2 3 4 5 6 7Internal friction angle (degrees) 46.9 50.2 51.7 53.1 55.7 52.4 45.9 Adhesion (Kpa) 14.7 15.7 14.7 23.5 14.7 22.5 19.6
Table 4-4 test results of large direct shear on the mixture of sand and 50% by volume tires with a width of 2 cm and less density mode
Aspect ratio 1 2 3 4 5 6 7
Internal friction angle (degrees) 49.6 52.9 53.1 56.9 58.1 55.1 53.1 Adhesion (Kpa) 23.5 27.4 24.5 28.4 25.5 32.3 29.4
Table 4-5 test results of large direct shear on the mixture of sand and 15% by volume tires with a width of 2 cm and in a state with higher density
Aspect ratio 1 2 3 4 5 6 7
Internal friction angle (degrees) 45 49.4 50.2 53.1 55.7 49.4 45 Adhesion (Kpa) 10.7 14.7 22.5 8.8 4.9 16.6 16.6
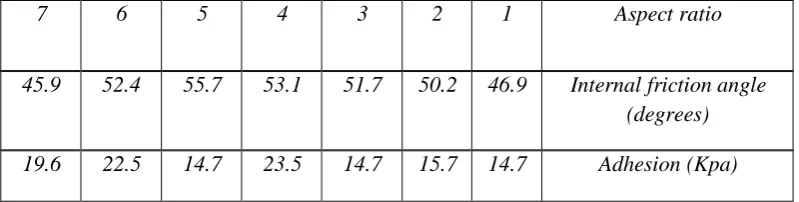
Table 4-6 test results of large direct shear on the mixture of sand and 30% by volume tires with a width of 2 cm and in a state with higher density
Aspect ratio 1 2 3 4 5 6 7
Internal friction angle (degrees) 48.6 52.4 57.5 58.5 62.2 55.1 52.4 Adhesion (Kpa) 19.6 22.5 27.4 31.3 27.4 32.3 34.3
Table 4-7 test results of large direct shear on the mixture of sand and 50% by volume tires with a width of 2 cm and in a state with higher density
Aspect ratio 1 2 3 4 5 6 7
5
0 10 20 30 40 50 60
1 2 3 4 5 6 7
45.9 49.4 50.2
53.1 55.7
49.4 45
in
te
rn
a
l
fr
ic
ti
o
n
drat io 0
10 20 30 40 50 60
1 2 3 4 5 6 7
46.9 50.2 51.7 53.1
55.7 52
45.9
in
te
rn
a
l
fr
ic
ti
o
n
drat io
(degrees)
Adhesion (Kpa) 39.3
34.3 34.3
30.3 33.3
41.2 36.3
As shown in Fig system inputs and outputs of the model to be determined On the first try using neural network modeling the relationship between inputs and outputs calculated output of the system is defined as follows:Friction angle (degrees) and adhesion system inputs as well as a mixture of sand and rubber volume fraction is definedOn the first try using neural network modeling the relationship between inputs and outputs calculated output of the system is defined as follows: Friction angle (degrees) and adhesion system inputs as well as a mixture of sand and rubber volume fraction is defined. Input and output data are ready for neural network and then use the tools in MATLAB neural network modeling was carried out using neural network Input data according to Table 4-2 to 4-4 made input data for the following matrix is formed for the first output The input data for the following matrix to the first output is formed. The model output friction angle (degrees) and entries for the following items listed are shown input vector and output vector also come under it . Figure 4.4 Forecast friction angle for up to fourteen aspect ratio, a mixture of sand and 15% by volume tires with a width of 2 cm and less density modeSimilarly to other output prediction and modeling is done and the results come in the form below.
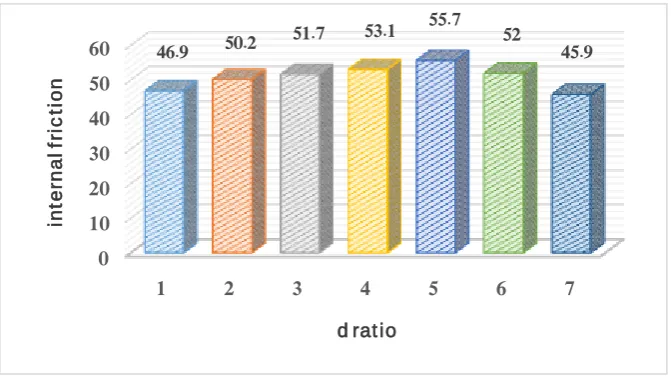
Figure 4-5 mixed friction angle of sand and 30% by volume tires with a width of 2 cm and less density mode
Figure 4-7 mixed friction angle of sand and 50% by volume tires with a width of 2 cm and in a state with low density
6
Figure 4.9 friction angle of sand mixer and15% by volume rubber to within 2 centimeters and in a state with higher density
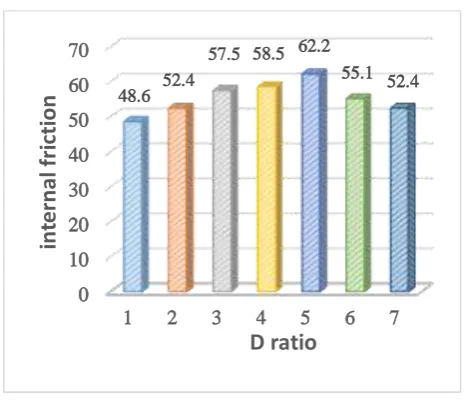
Figure 4-11 friction angle of sand mixer 30% by volume tires with a width of 2 cm friction angle of sand mixer in a state with higher density
0 10 20 30 40 50 60 70
1 2 3 4 5 6 7
48.6 52.4
57.5 58.5 62.2 55.1
52.4
in
te
rn
al
f
ri
ct
ion
D ratio
7
Figure 4-12 Forecast for up to fourteen aspect ratio, friction angle of sand mixer 30% by volume tires with a width of 2 cm friction angle of sand mixer in a state with higher density
Figure 4-13 friction angle of sand mixer 50% by volume tires with a width of 2 cm friction angle of sand mixer in a state with higher density
3. CONCLUSION
The results show that the addition of pieces of rubber to increase internal friction angle friction angle of sand mixer adhesion, rubber adhesion is apparent that because it would be added to the sand, rubber internal friction angle of sand and rubber chips with a specific gravity / m35 / 15 for rubber components to within 2 cm in and15% by volume equal to 5/65 of tires, tires at 30% by volume equal to 78/1% and 50% by volume tires equal to 4/87 percent . Increased internal friction angle of sand and rubber chips with a specific gravity kn / m38 / 16 for rubber components to within 2 cm in and15% by volume equal to 5/32 of tires, tires at 30% against 35.3 per cent in volume and 50% by volume rubber against 9/59 percent. Add rubber chips to increase internal friction angle friction angle of sand mixer rubber friction angle of sand mixer generally for weight loss is the result of reduced soil lateral pressure coefficient in the active mode, the friction angle of sand mixer rubber can be used as embankment resistant friction angle of sand mixer More durable, reduces the lateral force on retaining walls.
The fibers inclusion improves the peak and post-peak shear strengths
of sand by up to 50% and 30%, respectively. On the other side, the fibers inclusion
increases the sand dilation.•The introduction of moisture reduces the fibers effect on
the peak and post-peak shear strengths. The peak shear strengths of the moist
0 20 40 60 80
1 2 3 4 5 6 7
55.1 58 61.8 63.1 66.2 63.8 59
D ratio
8
specimens are affected by the relative density increase more than they are affected by
the fibers inclusion. The post-peak shear strength drop is reduced by the introduction
of moisture to fiber-reinforced sand.•Changing the moisture content on the dry side
does not have any noticeable impact on the peak shear strength, the post-peak shear
strength and dilation of unreinforced and fiber-reinforced sand.
A
CKNOWLEDGEMENTSI would like to thank research deputy of Islamic Azad University, Dehdasht branch for supporting
4. REFERENCES
[1] Yilmaz, A. and Degirmenci, N. (2009). Possibility of using waste tire rubber and fly ash with Portland cement as construction materials.Waste Management, 29 (5) 1541-1546
[2] Lee, K.H. and Lee, S. (2002). Mechanical properties of weakly bonded cement stabilized kaolin. KSCE Journal of Civil Engineering, Vol. 6 (4) 389-398
[3] Bell F.G.,Stabilization and treatment of clay soils with lime.Journal of Ground engineering,Vol 21(1) 1988,pp.10-15.
[4] Chen, H., and Wong, Q.,The behavior of soft soil stabilization using cement.Bulletin of Engineer ing Geology and the Environmenta by Springerlink.2006.
[5] Croft, J.B. The Influence of Soil Mineralogical Composition on Cement Stabilization.Geotechnique, London, England, No.17, 1967,pp119-135.
[6] Al-Rawas, A.A., Taha, R., Nelson, J.D., Al-Shab., T. and Al-Siyabi, H., A Comparative Evaluation of Various Additives Used in the Stabilization of Expansive Soils,Geotechnical Testing Journal, GTJODJ, ASTM No. 25 (2) 2002,pp199-209
[7] Bita, Hoopoe, CE, pilgrims come, O., (2012), "Study the Effect of Balastyk reinforced rubber crumb in strengthening the sandy soil shear strength", the first National Conference on Geotechnical Engineering. [8] Habibi, A., (2012), "The effect of tire yarn fibers to the clay soil shear strength parameters and
load-bearing capacity", senior thesis Ministry of Science and Research, University of Yazd.
[9] Tafreshi, S. M., & Norouzi, A. H. (2012). Bearing capacity of a square model footing on sand reinforced with shredded tire–An experimental investigation. Construction and Building Materials, 35, 547-556. [10] Turgut, P., & Yesilata, B. (2010). Physico-mechanical and thermal performances of newly developed
rubber-added bricks. Energy and Buildings, 40(5), 679-688.
[11]-Yoon, Y. W., Cheon, S. H., & Kang, D. S. (2014). Bearing capacity and settlement of tire-reinforced sands. Geotextiles and Geomembranes, 22(5), 439-453.
[12]-Gray, D.H. and Ohashi, H. 1983, “Mechanics of Fibre Reinforcement in Sand”, Journal of Geotechnical Engineering, Vol. 109, No. 3, pp. 335-353
[13]-Gray, D.H. and Al-Refeai, T., 1986. Behavior of Fabric Versus Fiber Reinforced Sand. Journal of Geotechnical Engineering, ASCE, Vol. 112, No. GT8, pp. 804-820. Guido , V.A. 1987. Discussion of Bearing Capacity of Reinforced Sand Subgrades. Journal of Geotechnical Engineering. ASCE, Vol 113, No. 5, pp. 541-542
[14]Kumar, R. Kanaujia, V.K. and Chandra, D., 1999, “Engineering Behavior of Fiber-Reinforced Pond Ash
9
[15] Rubber Manufacturers Association _RMA_. 2004. “US scarp tire markets, 2003 edition.” 7th Biannual Rep. of the Rubber Manufacturers Association, 1–51.
[16] Garga, V. K., and O’Shaughnessy, V., 2000, “Tire-reinforced earthfill. Part 1: Construction of a test fill, performance, and retaining wall design.” Can. Geotech. J., 37, 75–96.
[17] O’Shaughnessy, V., and Garga, V. K.,(2000b), “Tire-reinforced earthfill. Part 3: Environmental assessment.” Can. Geotech. J., 37, 117–131.
[18] Moon, C.M., 2003, Environmental effect of waste tires as earth reinforcing material. Master Thesis, Inha University (in Korean)
[19]Garga, V.K., and O’Shaughnessy, V. 2000. Tire-reinforced earthfill.Part 1: Construction of a test fill, performance, and retaining wall design. Canadian Geotechnical Journal, 37: 75–96.
[20]O’Shaughnessy, V., and Garga, V.K. 2000b. Tire-reinforced earthfill. Part 3: Environmental assessment. Canadian Geotechnical Journal, 37: 117–131