Telephone: +44 (0)1582 763133 Web: http://www.rothamsted.ac.uk/
Rothamsted Research is a Company Limited by Guarantee Registered Office: as above. Registered in England No. 2393175. Registered Charity No. 802038. VAT No. 197 4201 51.
Rothamsted Repository Download
A - Papers appearing in refereed journals
Van Den Bosch, F., Paveley, N., Shaw, M., Hobbelen, P. and Oliver, R.
2011. The dose rate debate: does the risk of fungicide resistance
increase or decrease with dose? Plant Pathology. 60 (4), pp. 597-606.
The publisher's version can be accessed at:
•
https://dx.doi.org/10.1111/j.1365-3059.2011.02439.x
The output can be accessed at:
https://repository.rothamsted.ac.uk/item/8q949
.
© Please contact [email protected] for copyright queries.
REVIEW
The dose rate debate: does the risk of fungicide
resistance increase or decrease with dose?
F. van den Bosch
a*, N. Paveley
b, M. Shaw
c, P. Hobbelen
aand R. Oliver
da
Rothamsted Research, Harpenden AL5 2JQ;bADAS High Mowthorpe, Dugglesby YO17 8BP;cSchool of Biological Sciences, University of Reading, Reading RG6 6AS, UK; anddEnvironment & Agriculture, ACNFP, Curtin University, Bentley, WA 6102, Australia
This paper reviews the evidence relating to the question: does the risk of fungicide resistance increase or decrease with dose? The development of fungicide resistance progresses through three key phases. During the ‘emergence phase’ the resistant strain has to arise through mutation and invasion. During the subsequent ‘selection phase’, the resistant strain is present in the pathogen population and the fraction of the pathogen population carrying the resistance increases due to the selection pressure caused by the fungicide. During the final phase of ‘adjustment’, the dose or choice of fungicide may need to be chan-ged to maintain effective control over a pathogen population where resistance has developed to intermediate levels. Emer-gence phase:no experimental publications and only one model study report on the emergence phase, and we conclude that work in this area is needed.Selection phase:all the published experimental work, and virtually all model studies, relate to the selection phase. Seven peer reviewed and four non-peer reviewed publications report experimental evidence. All show increased selection for fungicide resistance with increased fungicide dose, except for one peer reviewed publication that does not detect any selection irrespective of dose and one conference proceedings publication which claims evidence for increased selection at a lower dose. In the mathematical models published, no evidence has been found that a lower dose could lead to a higher risk of fungicide resistance selection. We discuss areas of the dose rate debate that need further study. These include further work on pathogen-fungicide combinations where the pathogen develops partial resistance to the fungicide and work on the emergence phase.
Keywords: dose response curve, emergence, healthy area index, insecticide resistance, mutation, selection
Introduction
The control of fungal plant pathogens has been character-ized by repeated cycles of introduction of new fungicides and subsequent loss of efficacy due to the emergence and selection of resistant pathogen strains. Since the 1970s, strategies have been proposed to prevent, or at least delay, resistance problems. The methods suggested include (i) management of application dose, (ii) con-straining the number of applications, (iii) use of fungicide mixtures, (iv) use of fungicide alternation, and (v) provi-sion of pathogen refugia, or various combinations of the above. Field experiments on the development of fungicide resistance are labour intensive and time consuming. This is one of the reasons why there are few detailed studies on
the dynamics of fungicide resistance in the literature (Hunteret al., 1984; Sanderset al., 1985; Porraset al., 1990; Steva, 1994; Pijls & Shaw, 1997; Metcalfeet al., 2000; O’Haraet al., 2000; Fraaije et al., 2006; Genet
et al., 2006; Mavroeidi & Shaw, 2006). In cases where fungicide resistance can be linked to a specific genetic mutation, molecular techniques are now available to assess the fraction of the pathogen population resistant to a fungicide from a bulk sample of the field population. This reduces the labour and time needed for such studies, and these techniques have been used for a number of field experiments in recent years.
Mathematical models have contributed to the discus-sion on fungicide resistance management methods (van den Bosch & Gilligan 2008 and references therein). This also holds for insecticide, herbicide and antibiotic resis-tance. When developed with considerable scrutiny and reference to the biology of the plant-pest-pesticide sys-tem, such models may help determine whether resistance management methods are good candidates for field testing.
*E-mail: [email protected]
Published online 6 March 2011
ª2011 Rothamsted Research Ltd
Plant Pathologyª2011 BSPP 597
One of the key questions in the search for methods to manage fungicide resistance is how dose affects the emer-gence and selection of fungicide resistance. Can the use of a high dose (i.e. a dose at, or near, the dose recommended on the product label) prevent or delay the emergence and selection of fungicide resistance, or does a high dose increase the risk of fungicide resistance compared to the risk at lower dose? These questions will be discussed in this paper. We study the effect of dose in isolation and will not discuss the interaction of dose with other aspects of fungicide application (number of treatments, mixtures, alternation). We review the experimental evidence and insights from modelling, and describe areas of research that are being developed currently in this area.1
Is fungicide resistance analogous to herbicide or insecticide resistance?
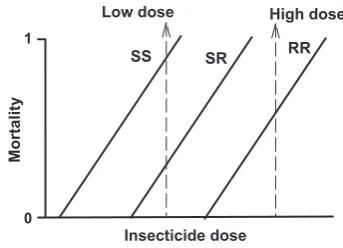
The development of fungicide resistance is not unique. Insects also develop resistance to insecticides, weeds develop resistance to herbicides, and rats develop resis-tance to rodenticides. However, insects, weeds and mam-mals are diploid organisms and this has important consequences for the development of resistance. Consider the following situation: the genotypes in the population are SS, SR and RR, where S stands for a sensitive allele and R for a resistant allele. In many cases the phenotype of the heterozygote, SR, individuals is intermediate between that of the homozygotes. This implies that the control chemical has a partial effect on the survival of the hetero-zygote individual. The situation is graphically represented in Figure 1. In such a case, when a low dose of the control chemical is applied, a large fraction of the heterozygote individuals survives the treatment. Applying a high dose will cause high mortality of the heterozygous individuals.
Now consider the situation where resistance against the control chemical is present but still rare. If mating is random, almost all resistance alleles will be present in het-erozygote individuals, because virtually all individuals carrying one or more resistance alleles (SR and RR) will mate with a homozygote sensitive individual, SS. The result of such mating is heterozygous individuals and homozygous sensitive individuals. It makes sense in some cases to apply a high dose, which will kill heterozygote individuals, thus removing R alleles from the population. However, the effectiveness of the strategy is reduced by inbreeding or selfing, because this increases the propor-tion of homozygous resistant individuals.
This high dose strategy may be combined with the crea-tion of refugia (Andow & Zwahlen 2006 and references therein), within which the control chemical is not used. This enables the homozygous sensitive population to sur-vive in these areas. Migration between the refugia and the
treated area then increases the chance of individuals car-rying one or more resistance alleles mating with a homo-zygous sensitive individual. This high dose plus refugia method is used and presumed to be effective, for example, in the control of resistance toBtcorn andBtcotton (Cer-da & Paoletti, 2004; Andow & Zwahlen, 2006).
In contrast to insects and weeds, many important fun-gal and oomycete plant pathogens are either haploid, in which case there are no heterozygotes, or diploids or dikaryons that are largely clonal, in which case selection acts on the entire clonal genotype. The high dose plus refugia mechanism is not relevant for such fungi (but see the section ‘Current research into the dose debate’).
Physiological adaptation is not resistance selection
In discussions on fungicide resistance it is sometimes assumed (without necessarily making it explicit) that a pathogen population can be ‘trained’ to resist a fungicide. The implication is that applying a low dose would train the population to ‘resist’ the fungicide, rather as an ani-mal might adapt to lower temperatures in winter. Apply-ing a high dose on the other hand would not lead to adaptation, but would kill the pathogen. There is no evi-dence that such physiological adaptation is relevant in the case of resistance development. Resistance is a matter of genetic or epigenetic change in individuals in the popula-tion that is inherited by their offspring and the subsequent selection of this altered genotype causing its eventual domination in the population. The development of fungi-cide resistance is thus a matter of differential selection of inherited variation.
The three key phases in fungicide resistance development
The three key phases in the development of fungicide resistance are (i) emergence, (ii) selection, and (iii) adjust-ment. Different resistance management strategies may be appropriate during these phases.
Low dose
Insecticide dose
Mortality
1
0
RR SR
SS
High dose
Figure 1The mortality rate of an insect species as a function of the insecticide dose. The line marked SS is the dose response curve of homozygote sensitive individuals, the line marked SR is the curve for heterozygotes and the line marked RR is for homozygote resistant individual.
1In a general discussion covering all fungal plant pathogens, it is
dif-ficult to find common terminology for the processes involved in population change. Here we will simply use words suitable for a large subgroup and refer, for example, to ‘infections’ as ‘lesions’, and to ‘infectious units’ as ‘spores’.
Emergence
The resistant strain has to arise through mutation and invasion. Mutation refers to one or more heritable changes in individual cells conferring some level of resis-tance. Invasion refers to the increase in frequency – by selection or genetic drift – to a sufficiently high number that the resistant strain is unlikely to die out by random chance. The sequence of mutation and invasion is called emergence.
Selection
The resistant strain is present in the pathogen population and the fraction of the pathogen population carrying the resistance increases due to the selective pressure imposed by the fungicide.
Adjustment
In the later stages of the selection phase, when the resis-tant fraction of the pathogen population has become large, crop managers have to adjust fungicide pro-grammes, by altering the dose or active substance(s) used, in order to maintain control. The use of, for example, fun-gicide mixtures or high doses in order to adjust for resis-tance, should not be confused with anti-resistance strategies – the aim of which is to slow emergence or selec-tion to prolong effective life.
At the start of the emergence phase the pathogen popu-lation consists of sensitive strains only. Occasionally a mutant spore carrying the resistance mutation will arise. There is a high probability that this spore, or the descen-dants of this spore, will die out because the vast majority of spores die rather than form infectious lesions. It is likely to take a multitude of such mutation events before the resistant strain emerges in the population (Fig. 2). If a strain resistant to a particular mode of action emerges before that mode of action is introduced, then only the
selection phase is relevant to anti-resistance strategies. If not, then the new mode of action should be used in a way which maximizes the time from introduction of the fungi-cide to the emergence of resistance. This time period depends, among other things, on the number of mutant spores developing per time unit, which in itself depends, among other things, on the size of the sensitive popula-tion. The time to emergence also depends on the transmis-sion rates of the resistant letransmis-sion (i.e. spore production rates, leaf to leaf transmission and infection efficiency). Emergence is thus governed, to a major extent, by the basic reproduction number,R0(the number of daughter
lesions per mother lesion in a fixed environment; Diek-mannet al., 1990), of the resistant strain in the sensitive pathogen population. Note that, in many applications,
R0is defined as the number of offspring in a crop where
the pathogen is not present (or is present at infinitesimally low density). In the resistance case we are interested in the number of offspring of a resistant lesion in a population of sensitive lesions.
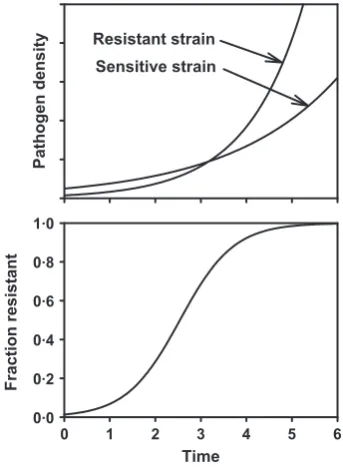
In the selection phase, the rate of increase of the fungi-cide resistant strain is larger than that of the sensitive strain (Fig. 3), due to the effect of the fungicide on the sen-sitive strain. This increases the fraction of the pathogen population that is resistant to the fungicide. It is impor-tant to note that the effect of selection is to change the proportion of the resistant strain in the total population. Selection is not about absolute numbers. In the selection phase the governing quantity is the rate of increase,r, of the resistant strain (relative to that of the sensitive popu-lation) and not, as in the emergence phase, the absolute
R
e
si
st
ance emer
g
e
d
Figure 2The emergence of a new pathogen genotype. The sensitive population is represented as a constant density through time. At times, where a dotted arrow starts, a resistant mutant spore is produced by a lesion in the sensitive population. Each circle represents a resistant lesion of the pathogen, the lines connecting the lesions show their lineage. In this particular example the first five mutations do not result in emergence of a resistant pathogen population, although some do build up a transient population; the sixth mutation does.
Pathogen density
Time
0 1 2 3 4 5 6
Fraction resistant
0·0 0·2 0·4 0·6 0·8 1·0
Resistant strain
Sensitive strain
Figure 3The dynamics of a resistant strain in an existing population of the sensitive strain. Top panel shows the increase in both the sensitive strain and the resistant strain through time. The bottom panel shows the change through time in the fraction of the pathogen population resistant to the fungicide.
The dose rate debate 599
Tab le 1 A su mmar y of th e e xp e ri m en ta le vi de nc e p re sen ted in p u b lish e d m a ter ia l. Th e re a re some fu rt he r p ap e rs th a t s tu d y c o mb in a tio ns of d iff e re n t d o se ra te s a nd nu mbe r of tr ea tmen ts, w her e o ften th e nu mbe r of tr ea tm en ts is in cr e a se d w he n d ose is d ec re ase d (e .g . S ch ul tz , 1 99 4; E n g e ls et a l. , 1 99 6) . It is n ot p o ssib le in the se p u b lic at io n s to d ise nt a n g le th e e ff e c ts o f d o se a n d of nu mbe r of tr ea tm en ts , a nd th ese p ub lic a tio ns ar e n ot co nsid er ed fur the r h ere Pathogen a Fungicide Type of experiment Number of site-years Applied dosage b Effect of dose c Ref. Publications in internationally refereed journals M. graminicola Fluquiconazole (triazole) Field 1 Exp.1: 1 ⁄ 2, 1 ⁄ 4, 1 ⁄ 8 Exp.2: 1 ⁄ 2, 1 ⁄ 4, 1 ⁄ 8, 1 ⁄ 16, 1 ⁄ 32 Increase Mavroeidi & Shaw (2006) P. viticola Famoxadone (QoI), azoxystrobin (QoI) Controlled environment – 1 and 4 l gm L ) 1 Increase Genet et al. (2006) B. graminis f.sp. hordei Azoxystrobin (QoI) Field 5 Total dose: 0, 1, 2, 3, in 1, 2 and 3 spray programmes Increase Fraaije et al. (2006), see analysis in Hobbelen et al. (2010) M. graminicola Pyraclostrobin (QoI) Field 4 Total dose: 0, 1, 2, 3, in 1, 2 and 3 spray programmes Increase Fraaije et al. (2006) M. graminicola Flutriafol (triazole), fluquiconazole (triazole), prochloraz (imidazole) Field 1 One spray 1 ⁄ 4, 1 ⁄ 8. Two sprays each 1 ⁄ 8. Increase Metcalfe et al. (2000) B. graminis f.sp. hordei Fenpropimorph (morpholine) Lab 31 Generation 0 Æ 31 and 5 m g L ) 1 Increase O’Hara et al. (2000) M. graminicola Flutriafol (triazole) Field 6 0 , ¼ , 1 No selection at any dosage Pijls & Shaw (1997) and Shaw & Pijls (1994) P. aphanidermatum Metalaxyl (acylamino acid fungicide) Green house 5–8 Cycles 1 ⁄ 2, 1 Increase Sanders et al. (1985) Non-peer reviewed publications from experimental studies U. necator Triadimenol (triazole) Field 2 0 , 3 7 Æ 5 g AI ha ) 1 in 6 sprays Decrease d Steva (1994) B. graminis f.sp. hordei Cyproconazole (triazole) Lab 5 Generation – Increase e Porras et al. (1990) B. graminis f.sp. hordei Triadimefon (triazole) Field 1 ¼ , ½ , 1 Increase f Hunter et al. (1984) Non-peer reviewed discussion papers based on observational data M. graminicola The DMIs Concludes that low dosage may have contributed to the evolution of insensitivity g Russell (2009) aMycosphaerella graminicola on wheat, Plasmopara vitricola on grape, Blumeria graminis f. sp. hordei on barley, Pythium aphanidermatum on turfgrass, Uncinula necator on grapevine. bApplied doses are expressed either in SI units or as proportions of the recommended labelled dose for a single application. c‘Increase’ indicates that the experiment found an increased selection for fungicide resistance with increasing dose; ‘decrease’ indicates that th e experiment found a decreasing selection for fungicide resistance with increasing dose. dOnly limited data are presented and the data do not provide compelling evidence to support the stated conclusion. eNo statistical analysis is presented and conclusion is based on visual inspection of graphs. fLimited data are presented, with a limited statistical analysis. gArgues that a shift in dose rate coincided with a shift in sensitivity and speculates that there may be a causal relation.
number of offspring. The rate of increase is (approxi-mately) proportional to the logarithm of the basic repro-ductive number,rln(R0).
In the literature on fungicide resistance development it is common to introduce a final phase relating to the long term dynamics of the resistant strain. However, the dose-rate debate is primarily concerned with the effect of dose on emergence and selection, so this paper deals exclu-sively with these two aspects.
Experimental evidence
In all the published experimental work we have been able to find, the subject of study was the selection phase.
Ele-ven papers are relevant to the dose debate and the findings are summarized in Table 1. The table shows that one (non-peer reviewed) field study (Steva, 1994) infers greater selection for resistance against DMI fungicides at low doses. All other studies on a range of pathosystem-fungicide combinations find that increased dose increases selection for fungicide resistance, except for the study by Pijls & Shaw (1997) who did not detect any significant shift in resistance irrespective of dose.
Evidence from mathematical models
Van den Bosch & Gilligan (2008) reviewed all published models of fungicide resistance and we refer readers to this publication for details and a reference list. The review shows that model predictions can be different for density independent (where host density is not limiting) and den-sity dependent (where host denden-sity is limiting) models. The review also shows that the effect of dose on resistance dynamics depends on whether we consider (i) the ‘take-over-time’ (Ttakeover, the time from introduction of the
fungicide to the moment that the fraction of the pathogen population resistant to the fungicide passes a given level, Fig. 4a) or (ii) the Healthy Area Duration gain (HAD gain, the total additional healthy leaf area duration gained by a given resistance management method, Fig. 4b) which is a measure closely correlated with yield (Waggoner & Berger, 1987; Brysonet al., 1997; Paveley, 1999).
Figure 5 summarizes the effect of dose in density independent (DI) and density dependent (DD) models onTtakeoverand on HAD gain. The figure shows that a
decrease in fungicide dose increases the take-over time. Taking it to the extreme, the take-over time is infinite if zero fungicide dose is applied; but in that case the fungicide is of no use. Hence disease control and conse-quent yield gain (the reasons for fungicide treatment) are not accounted for in the take-over time. HAD gain does include a measure related to disease control and yield gain, and Figure 5 shows that in density depen-dent models there is no relation between dose⁄efficacy
(a)
Fraction resistant
0·0 0·2 0·4 0·6 0·8 1·0
Time
HAD
0 20 40 60 80 100 120
Ttakeoverat high dose Ttakeoverat low dose Time
Introduction of the fungicide
(b)
Figure 4(a) The fraction of the pathogen population resistant to the fungicide as function of time since the introduction of the fungicide. In this specific model the fraction resistant increases faster at higher application rate. Each triangle represents the fraction resistant at the start of a growing season, the lines connecting the triangles are only to guide the eye. Closed circles are for the high dose and open triangles for the low dose. In this specific case the threshold is set to 60% resistance, so the take-over time,Ttakeover, is the time from introduction of the fungicide to the moment where the fraction resistance passes the 60% threshold. (b) The gain in healthy area duration (HAD) during the growing season caused by fungicide treatment, as a function of time. Each triangle represents a year. After 2 years the fungicide is introduced. The closed circles are where a high dose of the fungicide is used. The healthy leaf area increases markedly, but due to the selective pressure of the fungicide the healthy leaf area gain due to the use of the fungicide decreases relatively quickly. The closed triangles are where a lower dose is applied. The healthy leaf area increases initially to a lesser extent, but the selection pressure is smaller resulting in a slower decrease in healthy leaf area gain. The Healthy Area Duration gain is calculated as HAD when using the fungicide minus the HAD before introduction of the fungicide, accumulated over time.
Takeover time
DI
DD HAD Gain
Ttakeover HAD
Fungicide efficacy
Figure 5The effect of fungicide efficacy on the take-over time, Ttakeover, as defined in Figure 4a, and the HAD gained by using the fungicide, as defined in Figure 4b. The top row is for a density independent (DI) model, and the bottom row for a density dependent (DD) model (see van den Bosch & Gilligan 2008 for details).
The dose rate debate 601
and the HAD gain, and in the density independent models HAD gain decreases with increasing dose⁄
efficacy.
Seasonal dynamics of the leaf area in a crop might cause a density independent phase during spring (when pathogen density is low and leaf area is expanding rap-idly) and a density dependent phase later in the season (when pathogen density is higher and leaves are fully emerged) and should thus be incorporated in models so that no artificial choice between density independent or density dependent models needs to be made (van den Bosch & Gilligan, 2008). We have recently published such a model, which we tested against experimental data (Hobbelenet al., 2010). This model can be used to further study the effect of dose onTtakeoverand HAD
gain. The model was parameterized for, and tested on, data on the selection for azoxystrobin [a Quinone out-side inhibitor, (QoI)] resistance in Blumeria graminis
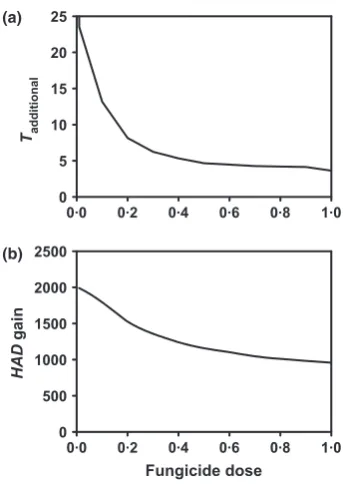
f.sp. hordeion spring barley. Figure 6 presents a short summary of the model structure and assumptions, but we refer to Hobbelenet al. (2010) for further details. Figure 7 shows that both Tadditional and HAD gain
decrease with increasing fungicide dose. Clearly the density independent phase in the early stages of the growing season are influential making HAD gain
decrease with dose. We also parameterized the model for the selection of pyraclostrobin (a QoI) resistance in
Mycosphaerella graminicola on wheat and found for this pathosystem that HAD gain and Tadditional also
decrease with dose (results not shown).
The models for fungicide resistance published so far and the new calculations with the tested model of Hobbe-lenet al. (2010) therefore suggest that, independent of model type or model output quantity considered, an increased dose does not decrease the risk of fungicide resistance. In the most extreme case, the risk of fungicide resistance is independent of dose, but in most cases increased dose increases the risk of fungicide resistance. However, all this work assumes that the pathogen evolves complete resistance to the fungicide. Very little work has been done on the emergence and selection of pathogen strains with partial resistance to the fungicide (see the next section).
Current research into the dose debate Not all aspects of the effect of dose on the risk of fungicide resistance have been adequately investigated. We have identified four mechanisms that need to be considered further in the dose rate debate. Each of these could, in principle, lead to increased risk of fungicide resistance with decreased dosage. The key question is whether these hypothetical mechanisms operate in real cropping sys-tems.
Green leaf area
Dead leaf area
Latent
Infectious
Sensitive strain
Latent
Infectious
Resistant strain Infection
Infection Leaf growth
Senescence
Sporulation Sporulation
Figure 6A schematic representation of the model developed and tested in Hobbelenet al.(2010). The model describes the seasonal dynamics of healthy, green leaf area, consisting of leaf growth, a plateau with no leaf growth and senescence. The end of the growth, plateau and senescence phases are GS39, GS61 and GS87 (Zadokset al., 1974), respectively. The pathogen population consists of two strains, one sensitive and one resistant to the fungicide. The life-cycle of each strain is divided into a latent stage followed by an infectious stage. The infectious stage produces spores causing new healthy leaf area to become infected. The fungicide is modelled such that it can affect one or more of the infection rate, the latent period and the infectious period depending on the fungicide under consideration. Fungicides are applied at discrete times during the season. The dose decays according to an exponential curve.
0·0 0·2 0·4 0·6 0·8 1·0 Tadditional
0 5 10 15 20 25
Fungicide dose
0·0 0·2 0·4 0·6 0·8 1·0
HAD
gain
0 500 1000 1500 2000 2500
(a)
(b)
Figure 7The model from Figure 6 was parameterized for azoxystrobin sensitive and resistant strains ofBlumeria graminis f.sp.hordeion barley. (a)Ttakeover, as defined in Figure 4a, as a function of azoxistrobin dose. (b) The HAD gain, as defined in Figure 4b, as a function of dose.
Stress-induced fungicide resistance mutations
Fungicide resistance generally emerges through muta-tions in the nuclear or mitochondrial genome. Several experiments have shown that environmental stress (caused for example by nutrient limitation, UV light, oxi-dative stress, antibiotic exposure or acid exposure) can increase the mutation rate in bacteria (Bjedov et al., 2003; Tenaillonet al., 2004; Kanget al., 2006; Galhardo
et al., 2007). This raises the possibility that eukaryotic (for example, fungal and oomycete) mutation rates might also be increased by stress, such as exposure to fungicide. No research has been done into this area. If fungicides do increase mutation rates in the target organism, the rela-tive effect of dose on stress induced mutation rate and on pathogen density will determine whether the probability of fungicide resistance emerging increases or decreases with dose.
During the fungicide registration process each fungi-cide is rigorously tested for any possible mutagenic⁄ car-cinogenic effects on non target organisms, and we are not suggesting here that any registered fungicide has any such effect. However, it could be that for the target organism the fungicide presents a stress factor, which could lead to, for example, the suppression of proof-reading during copying of the genome.
Mutation limitation
Mutations occur during the replication of the genome and can occur during any cell division in a cell lineage leading to spore formation. Although there will be spatial and temporal variation in the frequency of mutant spores, the process can be summarized as a probability that a ran-dom spore contains a new mutation contributing to fun-gicide resistance. The absolute number of mutant
fungicide resistant spores occurring per time unit in a fun-gal population is thus the product of the number of spores produced in the population per time unit and the muta-tion probability. The number of spores produced in the population, in turn, is the product of the spore production rate per lesion and the number of lesions in the popula-tion. Population size is thus a key component in the num-ber of fungicide resistance mutations occurring per time unit.
In the emergence phase, a mutant individual is unlikely to leave descendants, due to random chance. Only a small fraction of spores land on susceptible tissue and of those that do, only a small fraction infect and reproduce. In a few cases a founder population of resistant individuals will build up in sufficient numbers for selection to be as important as chance in population change. During this stochastic phase the mutant type has to build up a popula-tion in an environment occupied by the sensitive type. If the density of the sensitive type is high it is unlikely that the mutant will increase greatly in numbers, because much of the host tissue is occupied by the sensitive type. At low density of the sensitive type it will be more proba-ble that the mutant population will develop.
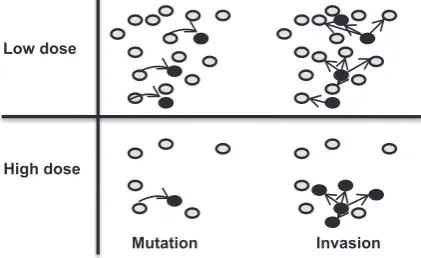
Now consider the contrasting situations of fungal pop-ulations affected by low or high doses of fungicide (Fig. 8). At low dose the density of the sensitive strain is relatively high. This implies a relatively high number of fungicide resistance mutations occurring per time unit. It also implies a low probability that a mutant will be able to build up a population and survive through the emer-gence phase because of the presence of a relatively high density of the sensitive strain taking up leaf area. In the high dose case, the density of the sensitive strain is rela-tively low, implying a relarela-tively small number of muta-tions arising in the population. However, in the high dose
Low dose
High dose
Mutation Invasion
Figure 8Visualization of the two steps of emergence, the mutation step and the invasion step. In the mutation step one or more mutant spores are formed (shown as dark circles). In the invasion step the mutant does or does not build up a population. At low dose more mutations arise than at high dose due to the larger size of the sensitive pathogen population. In the invasion step it is easier for the resistant strain to build up a population at high dose due to the reduced competition with the resident sensitive strain for host tissue.
Fungicide dose Sensitive population density
Probability a mutant invades
Dose
Dose
Dose
Time to resistance emergence
Figure 9The effect of dose on the time between introduction of the fungicide and the emergence of fungicide resistance. In the left-hand graph the density of the sensitive population is plotted as a function of the dose applied. At lower dose this population is larger than at higher dose. The other line is the probability that a mutant spore will produce a viable population. See Figure 6 for further explanation. The time until fungicide resistance emerges in the pathogen population is a combined effect of dose on pathogen population density, mutation rate and the probability to invade. The three figures on the right hand side show the possible outcome of these combined effects. Each figure shows a possible shape of the relation between fungicide dose and time until resistance emergence.
The dose rate debate 603
case the probability that a mutant builds up a founder population is relatively large due to the relatively small competition for host space from the small density of the sensitive strain.
The two mechanisms (number of mutations per time unit, and probability to build up a population) have opposite effects on the time until emergence of fungicide resistance. This can, in theory, result in a decreasing time to the emergence of fungicide resistance with increasing dose, an increasing time to fungicide resistance emerging with dose, or a decreasing time at low dose and an increasing time at high dose (Fig. 9). The outcome depends on the parameter values describing any particu-lar pathogen-fungicide combination. We are developing branching process models to study mutation-limited emergence, and parameterizing these for a range of path-ogen-fungicide combinations. Our first parameteriza-tion, for the pathogenMycosphaerella graminicolaand the fungicide epoxiconazole, suggests that at low dose (below 0Æ4 of the label recommended dose), the time to emergence of fungicide resistance decreases with dose. Above 0Æ4 of the label recommended dose, the time to fungicide resistance emerging is virtually constant with dose.
During the selection phase is it unlikely that further mutations occurring in the population have a quantita-tive effect on the course of selection. The population of the resistant strain is beyond the phase where extinction is likely and is thus relatively large. Further mutations emerging during the selection phase are unlikely to affect the dynamics of the system to such an extent that an increased dose will reduce selection.
Refugia
The reasoning behind the high dose plus refugia strategy, that has led to resistance management in insecticide and herbicide resistance, does not apply to most fungal plant pathogens since the argument is based on the target organism reproducing sexually, being diploid (or of higher ploidy) and the heterozygote being partially sensi-tive to the chemical control. Nevertheless the high dose plus refugia strategy is also discussed in the fungicide resistance literature (e.g. Kable & Jeffery, 1980). It has been argued that in a situation where the majority of the fungal population lives in the refugia (=untreated) area and the resistant strain is partially sensitive to the fungi-cide, there may be cases where the high dose plus refugia strategy works. Shaw (2009) presents a numerical exam-ple to show how the idea could work. However, the example presented there was not intended to show the generic situation and relies on very specific choices for the numerical values used.
A more general model has been developed to study the interaction between refugia and fungicide dose (F. van den Bosch, Rothamsted Research, UK & M. Shaw, Read-ing University, UK, unpublished data). The model describes the dynamics of a fungicide sensitive and a fun-gicide resistant strain in an assemblage of fields. Each field
goes through the usual seasonality of planting, canopy growth and senescence, and harvest. During senescence and harvest most of the pathogen is removed. At the start of the next growing season the epidemic starts with pri-mary inoculum, and it is assumed that the fraction of the resistant strain in the initial inoculum is the same as the fraction of the resistant strain in the pathogen population at the end of the previous season. The spores of the initial inoculum are well mixed throughout the area of interest. A fraction of the fields is treated with a fungicide. The remaining fields are untreated and thus are the refugium. In the refugium no selection takes place.
Some of the relevant conclusions from the model analy-sis so far are that: (i) a refugium plus high dose strategy does not prevent the invasion of a fungicide resistant strain, and (ii) a greater fungicide dose usually leads to a faster increase in the density of the resistant strain, and a faster increase in the fraction of the pathogen population resistant to the fungicide. These conclusions are indepen-dent of parameter values. Further work is needed before definitive conclusions can be drawn, but current evidence suggests that the presence of refugia does not result in a higher dose reducing the development and invasion of fungicide resistance.
Partial resistance
Published experimental evidence on the selection of fun-gicide resistance suggests that increased dose increases selection. This also holds for the experiments involving pathogen-fungicide combinations where the pathogen evolves partial resistance to the fungicide. However, the number of experiments is small. Model studies often assume either (i) the presence of absolute resistance to the fungicide, or (ii) assume increased dosage to result in a larger difference in fitness between the sensitive and the resistant strain. The authors believe that the effect of dose on the emergence and selection of partial resistance needs further study because there are possible scenarios where partial resistance can lead to situations where increased dose can decrease the risk of fungicide resistance.
Herbicide dose (g ha–1)
100 1000
Shoot biomass (% of the control)
0 20 40 60 80 100
Resistant strain
Sensitive strain
Figure 10The dose response curve of the plant speciesLolium rigidumto treatment with the herbicide diclofop-methyl. They-axis represents the biomass of the shoot relative to the shoot size of the resistant plant that is not treated with the herbicide. Dose is given as grams of active ingredient per hectare.
One example where this may happen has been intro-duced for herbicide resistance by Neve & Powles (2005). They measured dose response curves for sensitive and resistant strains of the weedLolium rigidum. The dose of the herbicide diclofop-methyl was varied and the shoot biomass of the plants was measured. One of their results is reproduced in Figure 10, showing that the dose response curves converge at higher doses. Assuming that plant biomass is correlated with seed production (which is a reasonable assumption for many plant species), they -axis of the graph can be interpreted as being correlated to the basic reproduction number,R0, of the sensitive and of
the resistant plant strains. As discussed earlier, the selec-tion phase is governed by the natural rate of increase,r, which is proportional to ln(R0). The selection coefficient
is calculated from rS)rR which is thus equal to
ln(R0S))ln(R0R), where the subscriptsSandRrefer to the
sensitive and resistant strain, respectively. If, when plot-ted on a log-scale, the dose response curves of the resistant and the sensitive strain converge, it follows that selection rates are lower at increased dose. As the emergence phase is governed byR0, if the dose response curves converge at
a linear-scale, emergence rates are lower at increased dose.
The key question is whether for a specific pathogen-fungicide combination, the dose response curves converge either on a linear or on a log-scale. As Neve & Powles (2005) discuss, the dose response curve of a popu-lation consisting of the sensitive strain and the dose response curve of a population consisting of the resistant strain will not converge within the legal range of doses when there is a genetic change conferring a high level of resistance. The resistance developing against single-site fungicides is usually of this type. It is thus unlikely that the dose-response curve convergence mechanism will be relevant to most single-site fungicides. The ‘gradual shift’ resistance of some pathogens against azole fungicides may be an exception. If resistance develops by successive mutations each adding a small contribution to the level of resistance of the pathogen to the fungicide, the dose-response curve convergence mechanism might operate – resulting in an increased risk of fungicide resistance when dose is decreased.
There are no data sets available to test this hypothesis for fungal crop pathogens. Dose response curves can be found in the literature, but these are from field popula-tions consisting of mixtures of a range of strains confer-ring different levels of resistance to the fungicide. Dose response curves measured for pure populations of each of the genotypes involved are needed to develop models to test whether the curve convergence mechanism might be important under practical field conditions.
Discussion and conclusions
Resistance management strategies should be based on evidence interpreted within a sound experimental and theoretical framework. Industry and regulatory decisions about fungicide resistance management often cannot
wait for the accumulation of new evidence, so decisions should be taken by weighing the existing evidence and making judgments about the consequences should deci-sions prove to be wrong. The development of policy should be clear about the relative certainty of the argu-ments put forward in favour of one policy or another, and be explicit about the extent to which arguments have been critically challenged.
There are still substantial gaps in knowledge about the effect of dose on fungicide resistance risk, hence we iden-tified where future research should be focussed. As described in this paper, there are two phases to be consid-ered, the emergence phase and the selection phase. There are no experimental studies on the effect of dose on resis-tance emergence. Field experiments may be difficult, as they would involve spraying a completely sensitive popu-lation, and observing the mutation and invasion events of resistant genotypes. Attempts to do this have demon-strated only that very large scale experiments would be needed (Metcalfeet al., 2001). It is likely that we will have to rely on model calculations to explore the possible mechanisms operating in the emergence phase. Experi-mental verification may be possible at laboratory scale or may be indirect.
For the selection phase the situation is different. There are a few thorough field studies on the effect of dose on the selection of fungicide resistant strains, and a range of models that consider dose as an input parameter and study the effect of dose on selection. In all models, selec-tion of resistant types increases with dose and all the experimental studies published in peer reviewed journals come to the same conclusion, except for one paper where no selection was found for any dose. However, for some evaluation criteria, the deleterious effect of a high dose on selection is counter-balanced by the benefit to efficacy. In some circumstances, the greater efficacy at high dose may decrease the number of sprays required to achieve com-mercially acceptable control. The net effect on resistance will depend on: (i) the relationship between dose per treatment and the number of treatments required, and (ii) the relative size of the effects of dose and number of treat-ments on emergence and selection. These relationships are currently under investigation by the authors.
Further work is needed especially in the area of partial resistance where there are theoretical situations possible where a higher dose may lead to a lower risk of fungicide resistance. Whether this may happen for model parame-ter values that are of relevance to real pathogen-fungicide combinations needs to be explored using mathematical models. After the theoretical exploration a phase of test-ing the hypotheses generated by the modelltest-ing studies will help understand if and when partial resistance may or may not cause higher dosage to reduce resistance risks.
In conclusion, a high dose may be required to obtain effective control – particularly on susceptible cultivars under high disease pressure, or where a sensitivity shift has eroded efficacy and dose has to be increased to main-tain effective control (i.e. in the adjustment phase). How-ever, current evidence and analysis suggests that, in most
The dose rate debate 605
circumstances, a high fungicide dose will increase the speed at which fungicide resistance develops.
Acknowledgements
We thank Professor Phil Russell for the many useful dis-cussions on fungicide resistance. Rothamsted receives support from the Biological and Biotechnological Research Council, UK (BBSRC). This work was partly funded by the UK Chemicals Regulation Directorate, CRD, and the Australian Grains Research and Develop-ment Corporation, GRDC.
References
Andow DA, Zwahlen C, 2006. Assessing environmental risks of transgenic plants.Ecology Letters9, 196–214.
Bjedov I, Tenaillon O, Gerard Bet al., 2003. Stress-induced mutagenesis in bacteria.Science300, 1404–9.
van den Bosch F, Gilligan CA, 2008. Models of fungicide resistance dynamics.Annual Review of Phytopathology46, 123–47. Bryson RJ, Paveley ND, Clark WS, Sylvester-Bradley R, Scott RK,
1997. Use of in-field measurements of green leaf area and incident radiation to estimate the effects of yellow rust epidemics on the yield of winter wheat.European Journal of Agronomy
7, 53–62.
Cerda H, Paoletti MG, 2004. Genetical engineering withBacillus
thuringiensisand conventional approaches for insect resistance in
crops.Critical Reviews in Plant Sciences23, 317–23. Diekmann O, Heesterbeek JAP, Metz JAJ, 1990. On the definition
and the computation of the basic reproduction ratioR0in models for infectious-diseases in heterogeneous populations.
Journal of Mathematical Biology28, 365–82.
Engels AJG, Mantel BC, De Waard MA, 1996. Effect of split applications of fenpropimorph-containing fungicides on sensitivity ofErysiphe graminisf.sp.tritici.Plant Pathology45, 636–43.
Fraaije BA, Burnett FJ, Clark WS, Lucas JA, 2006.Development and Field Testing of Fungicide Anti-resistance Strategies, with Particular Reference to Strobilurin QoI Group of Fungicides. London, UK: Home-Grown Cereals Authority.
Galhardo RS, Hastings PJ, Rosenberg SM, 2007. Mutation as a stress response and the regulation of evolvability.Critical
Reviews in Biochemistry and Molecular Biology42, 399–435.
Genet J-L, Jaworska G, Deparis F, 2006. Effect of dose rate and mixtures of fungicides on selection for QoI resistance in populations ofPlasmopara viticola.Pest Management Science
62, 188–94.
Hobbelen PHF, Fraaije B, Lucas JA, Paveley ND, van den Bosch F, 2010. Derivation and testing of a model to predict selection for fungicide resistance.Plant Pathology, in press. doi: 10.1111/ j.1365-3059.2010.02380.x
Hunter T, Brent KJ, Carter GA, 1984. Effects of fungicide regimes on sensitivity and control of barley mildew.British Crop
Protection Conference, Pests & Diseases2, 471–6.
Kable PF, Jeffery H, 1980. Selection for tolerance in organisms exposed to sprays of biocide mixtures: a theoretical model.
Phytopathology70, 8–12.
Kang JM, Iovine NM, Blaser MJ, 2006. A paradigm for direct stress-induced mutation in prokaryotes.The FASEB Journal
20, 2476–85.
Mavroeidi VI, Shaw MW, 2006. Effects of fungicide dose and mixtures on selection for triazole resistance inMycosphaerella
graminicolaunder field conditions.Plant Pathology55,
715–25.
Metcalfe RJ, Shaw MW, Russell PE, 2000. The effect of dose and mobility on the strength of selection for DMI fungicide resistance in inoculated field experiments.Plant Pathology49, 546–57.
Metcalfe RA, Heaney SP, Shaw MW, Davies S, 2001. Selection for Resistance to QoI Fungicides in a Model System.Ramularia agrestis on Viola (abstract) Resistance 2001, Harpenden, 9-11 Sept 2001.
Neve P, Powles S, 2005. High survival frequencies at low herbicide use rates in populations ofLolium rigidumresult in rapid evolution of herbicide resistance.Heredity 95, 485–92.
O’Hara RB, Nielsen BJ, Østerga˚rd H, 2000. The effect of fungicide dose on the composition of laboratory populations of barley powdery mildew.Plant Pathology49, 558–66.
Paveley ND, 1999. Integrating septoria risk variables. In: Lucas JA, Bowyer P, Anderson HM, eds.Septoria on Cereals: A Study of Pathosystems. Oxford, UK: CABI, 230–50.
Pijls CFN, Shaw MW, 1997. Weak selection by field sprays for flutriafol resistance inSeptoria tritici.Plant Pathology46, 247– 63.
Porras L, Gisi U, Staehle-Csech U, 1990. Selection dynamics in triazole treated populations ofErysiphe graminison barley. Brighton Crop Protection Conference, Pests and Diseases, 1990, Vol. 3. Farnham, UK: BCPC, 1163–8.
Russell PE, 2009. Fungicide dose rates and resistance development
inMycosphaerella graminicola: a spurious correlation or
reasonable hypothesis?Outlooks on Pest Management20, 194–6.
Sanders PL, Houser WJ, Parish PJ, Cole H Jr, 1985. Reduced-rate fungicide mixtures to delay fungicide resistance and to control selected turfgrass diseases.Plant Disease69, 939– 43.
Schultz U, 1994. Evaluating anti-resistance strategies for control of
Erysiphe graminisf.sp.tritici. In: Heaney SP, Slawson D,
Hollomon DW, Smith M, Russell PE, Parry DW, eds.Fungicide Resistance. Farnham, UK: British Crop Protection Council, 47–54.
Shaw MW, 2009. Fungicide resistance: the dose rate debate.
Outlooks on Pest Management20, 100–3.
Shaw MW, Pijls CFN, 1994. The effect of reduced dose on the evolution of fungicide resistance inSeptoria tritici. In: Heaney SP, Slawson D, Hollomon DW, Smith M, Russell PE, Parry DW,
eds.Fungicide Resistance. Farnham, UK: British Crop Protection
Council, 47–54.
Steva H, 1994. Evaluating anti-resistance strategies for control
ofUncinula nector. In: Heaney SP, Slawson D, Hollomon
DW, Smith M, Russell PE, Parry DW, eds.Fungicide Resistance. Farnham, UK: British Crop Protection Council, 59–66.
Tenaillon O, Denamur E, Matic I, 2004. Evolutionary significance of stress-induced mutagenesis in bacteria.Trends in
Microbiology12, 264–70.
Waggoner PE, Berger RD, 1987. Defoliation, disease and growth.
Phytopathology77, 393–8.
Zadoks JC, Chang TT, Konzak CF, 1974. A decimal code for the growth stages of cereals.Weed Research14, 415–21.