R E S E A R C H A R T I C L E
Open Access
A combined linkage, microarray and exome
analysis suggests
MAP3K11
as a candidate
gene for left ventricular hypertrophy
Claudia Tamar Silva
1,2,3, Irina V. Zorkoltseva
4, Maartje N. Niemeijer
5, Marten E. van den Berg
5, Najaf Amin
1,
Ay
ş
e Demirkan
1, Elisa van Leeuwen
1, Adriana I. Iglesias
1,7, Laura B. Piñeros-Hernández
2, Carlos M. Restrepo
2,
Jan A. Kors
6, Anatoly V. Kirichenko
4, Rob Willemsen
7, Ben A. Oostra
1,8, Bruno H. Stricker
5,9,10,
André G. Uitterlinden
5,9, Tatiana I. Axenovich
4, Cornelia M. van Duijn
1,8and Aaron Isaacs
1,11*Abstract
Background:Electrocardiographic measures of left ventricular hypertrophy (LVH) are used as predictors of cardiovascular risk. We combined linkage and association analyses to discover novel rare genetic variants involved in three such measures and two principal components derived from them.
Methods: The study was conducted among participants from the Erasmus Rucphen Family Study (ERF), a Dutch family-based sample from the southwestern Netherlands. Variance components linkage analyses were performed using Merlin. Regions of interest (LOD > 1.9) were fine-mapped using microarray and exome sequence data.
Results:We observed one significant LOD score for the second principal component on chromosome 15 (LOD score = 3.01) and 12 suggestive LOD scores. Several loci contained variants identified in GWAS for these traits; however, these did not explain the linkage peaks, nor did other common variants. Exome sequence data identified two associated variants after multiple testing corrections were applied.
Conclusions:We did not find common SNPs explaining these linkage signals. Exome sequencing uncovered a relatively rare variant inMAPK3K11on chromosome 11 (MAF = 0.01) that helped account for the suggestive linkage peak observed for the first principal component. Conditional analysis revealed a drop in LOD from 2.01 to 0.88 forMAP3K11,suggesting that this variant may partially explain the linkage signal at this chromosomal location. MAP3K11 is related to the JNK pathway and is a pro-apoptotic kinase that plays an important role in the induction of cardiomyocyte apoptosis in various pathologies, including LVH.
Background
Left ventricular hypertrophy (LVH) is a predictor of in-creased cardiovascular morbidity and mortality [1]. Those with LVH have a 2-fold increased risk of adverse events, particularly ischemic heart disease and chronic heart fail-ure [2,3]. Increased left ventricular mass maintains cardiac pump performance in response to cardiovascular insults, such as coronary heart disease [3,4]. Risk factors for LVH
are elevated systolic blood pressure, obesity, hypertension, insulin resistance, valvular heart disease and advanced age, among others [2,5, 6]. LVH proxy measurements can be assessed through noninvasive methods, such as echocardi-ography and magnetic resonance imaging, however, elec-trocardiographic measurements are the most used worldwide [7]. LVH proxy measurements include calcula-tions of the Sokolow-Lyon index (SL), the Cornell voltage product (CV) and the 12-lead sum QRS product (12LS). Several studies have demonstrated that genetic factors in-fluence electrocardiographic and echocardiographic mea-sures of LVH [2,4,5,8,9]. We recently demonstrated that these measures contain a substantial heritable component (SL = 0.46, 12LS = 0.49 and CV = 0.34) [10].
* Correspondence:[email protected]
1Genetic Epidemiology Unit, Department of Epidemiology, Erasmus University Medical Center, Rotterdam, the Netherlands
11CARIM School for Cardiovascular Diseases, Maastricht Centre for Systems Biology (MaCSBio), and Department of Biochemistry, Maastricht University, Maastricht, the Netherlands
Full list of author information is available at the end of the article
Genome-wide linkage analyses, candidate gene associ-ation studies, genome-wide associassoci-ation studies (GWAS) and gene mapping have been conducted to identify genes influencing LVH. In the first GWAS of these traits, two loci, PTGES3 and NMB, reached genome-wide significance.IGF1RandSCN5Awere identified and replicated without reaching genome-wide significance [5]. Recently, an expanded GWAS detected a number of novel loci influencing CV, SL, and 12LS [11]. Among these were 32 loci containing genes with known cardiac function, coding for cardiac sarcomere components or related to cardiac myocyte function. Evidence for linkage of echocardiographic LV mass to chromosome 5 (LOD score = 1.6) and electrocardiographic LV mass to chromosome 7 (LOD score = 1.67) [8] and chromosome 12 (LOD score = 2.19 and 3.11) [8, 12] were reported in linkage studies, with the strongest evidence for chromo-some 12 [3]. As is the case for other complex outcomes, most candidate genes studies have not been replicated and do not reach genome-wide significance [3].
Exome sequencing has been successfully used for Mendelian disorders [13]. More recently, this technology has been extended to the analysis of non-Mendelian diseases and complex traits, as rare variants with large effects can contribute to the heritability of common traits. The aim of this study was to discover rare variants by linkage analysis in a large family-based study, the Erasmus Rucphen Family (ERF) study. Linked regions were fine-mapped in detail using microarray data and exome sequencing.
Methods
Study population
The ERF study is a family-based study including over 3000 participants descendant from 22 couples that lived in the Rucphen region in the southwest Netherlands in the nineteenth century [14]. All descendants of those couples were invited to visit the clinical research center in the region where they were examined in person [15]. Interviews at the time of blood sampling were per-formed by medical practitioners and included questions on current medication use and medical history [16]. Additionally, participants were asked to bring their current medications with them to the study center; these were cross-referenced with general practitioner and pharmacy records. Height and weight were measured with the participant in light underclothing and body mass index (kg/m2) was computed. Blood pressure was measured twice on the right arm in a sitting position after at least 5 min rest, using an automated device (OMRON 711, Omron Healthcare, Bannockburn, IL, USA). The average of the two measures was used for analysis. Hypertension status was identified through the use of antihypertensive medication and/or through the
assessment of blood pressure measurements according to the guidelines of the World Health Organization [17]. The Medical Ethics Committee of the Erasmus University Medical Center approved the ERF study protocol and all participants, or their legal representatives, provided written informed consent.
ECG interpretation and measurements
Examinations included 12-lead ECG measurements. A 10 s 12-lead ECG (on average, 8 to 10 beats) was recorded with an ACTA-ECG electrocardiograph (Esaote, Florence, Italy) with a sampling frequency of 500 Hz. Digital mea-surements of the ECG parameters were made using the Modular ECG Analysis System (MEANS) [18,19]. Briefly, MEANS operates on multiple simultaneously recorded leads, which are transformed to a detection function that brings out the QRS complex and the other parts of the signal. MEANS determines common onsets and offsets for all 12 leads together on one representative averaged beat, with the use of template matching techniques. The measurement and diagnostic performance of MEANS has been extensively evaluated, both by the developers and by others [19–22]. The MEANS criteria for MI are mainly based on pathological Q waves, QR ratio, and R-wave pro-gression [20]. A cardiologist, specialized in ECG method-ology, ascertained the final diagnosis of MI.
MEANS was used to measure QRS complex duration and the three LVH proxies. Sokolow-Lyon was defined as the sum of the S wave in V1 plus the R wave in V5 or V6, Cornell as the sum of R in aVL and S in V3, and 12-lead as the sum of R to S in all 12 leads; these three voltages were then multiplied by QRS duration to obtain voltage-duration products as an approximation of the area under the QRS complex [21–23]. Principal component (PC) ana-lysis was applied to the three original measurements (SL, 12LS and CV) to capture the correlation structure between traits. Two PCs, PC1 and PC2, captured more than 94% of the total variance and were also assessed as phenotypes in these analyses. All traits were adjusted for sex, age, BMI and height and the residuals were rank transformed prior to analysis.
utilized for the linkage analyses. Among the 2385 indi-viduals who were phenotyped for LVH measures, 1860 people also had genotype data and were included in the linkage study. Variance component multipoint linkage was performed using the –vc option in MERLIN v.1.0.1 [25,26]. This program calculates exact IBD sharing prob-abilities using the Lander-Green algorithm, requiring restrictions on pedigree size. Because of this, the single ERF pedigree with multiple loops was split into non-overlapping fragments of no more than 18 bits with the help of the PedSTR program [27].
Regions of interest with LOD > 1.9 were selected for fur-ther analysis. Borders of the linkage areas were defined as LOD score minus 2 support intervals (LOD-2 SI) around the linkage peaks. Genes within the LOD-2 SI were anno-tated using SCAN (SNP and CNV Annotation Database).
Genotyping and statistical analysis of the association study
Of 2385 phenotyped people, dense genotypes were avail-able for 2128 subjects, typed on 3 different genotyping platforms (Illumina 318 K, Illumina 370 K and Affyme-trix 250 K), which were merged first (median number of quality controlled SNPs per individual = 325,500) and then ~ 2.54 million SNPs were imputed using MACH (v1.0.16) [28,29], with the HapMap build 36 (release 22) CEU population as reference. Within each genotyping batch, only SNPs with a call rate > 98%, MAF > 1% and Hardy-Weinberg Equilibrium P-value > 10−6 were used for imputations. To account for relatedness, a genomic kinship matrix was computed in GenABEL [30]. This matrix was then incorporated into linear mixed-effects regression models, as implemented in ProbABEL [31], which were used to assess the association of variants in the LOD-2 SI with the LVH phenotypes. P-values were adjusted with the FDR-based q-value technique [32].
Exome sequencing
The exomes of 1336 individual from the ERF population were sequenced “in-house” at the Center for Biomics of the Department of Cell Biology of the Erasmus MC, the Netherlands, using the Agilent version V4 capture kit on an Illumina HiSeq 2000 sequencer using the TruSeq Ver-sion 3 protocol. Mean depth base was 74.23× (median = 57×) and mean depth region was 65.26× (median = 52.87×). The sequence reads were aligned to the human genome build 19 (hg19) using BWA and the NARWHAL pipeline [33,34]. The aligned reads were processed further using the IndelRealigner, MarkDuplicates and TableRecali-bration tools from the Genome Analysis Toolkit (GATK) and Picard (http://broadinstitute.github.io/picard/) to re-move systematic biases and to recalibrate the PHRED qual-ity scores in the alignments. Genetic variants were called using the Unified Genotyper tool of the GATK. About
1.4 million Single Nucleotide Variants (SNVs) were called and, after removing the low quality variants (QUAL < 150), we retrieved 577,703 SNVs in 1309 in-dividuals. ECG and covariate data were available for 1072 of these samples. Further, for comparison and to predict the functionality of the variants, annotations were also performed using the dbNSFP (database of human non-synonymous SNPs and their functional predictions, http://varianttools.sourceforge.net/Annota-tion/DbNSFP) and Seattle (http://snp.gs.washington.edu/ SeattleSeqAnnotation138/) databases. These databases gave functional prediction results from four different pro-grams, PolyPhen-2, SIFT, MutationTaster and LRT, apart from gene and variant annotations.
We employed a Bonferroni correction for the number of deleterious mutations selected for each trait to correct for multiple comparisons in the exome data: 101 for SL (P-value = 4.9 × 10⁻⁴), 98 for CV (P-value = 5.1 × 10⁻⁴) and 60 for 12 LS (P-value = 8.3 × 10⁻⁴). For the PCs, the numbers were 141 for PC1 (P-value = 3.5 × 10⁻⁴) and 71 for PC2 (P-value = 7.0 × 10⁻⁴).
Replication
Four SNPs (rs139580877, rs138968470, rs35996030 and rs142551296) were selected for replication in the Rotter-dam Study (RS). The RotterRotter-dam Study is a prospective cohort study ongoing since 1990 in the city of Rotter-dam in the Netherlands [35].
Exomes from 1764 individuals from the RS population were sequenced at an average depth of 20× using the Nimblegen SeqCap EZ V2 capture kit on an Illumina HiSeq 2000 sequencer and the TrueSeq Version 3 proto-col. The sequence reads were aligned to hg19 using BWA. Subsequently, the aligned reads were processed further using Picard, SAMtools and GATK. Genetic vari-ants were called using the Unified Genotyper Tool from GATK. Samples with low concordance to genotyping array (< 95%), low transition/transversion ratio (< 2.3), high heterozygote to homozygote ratio (> 2.0) and low call rate (< 80%) were removed from the data. SNVs with a low call rate (< 90%) and out of HWE (P-value < 10−6) were also removed from the data. The final dataset con-sisted of 635,814 SNVs in 1450 individuals with complete phenotype and covariate data.
One SNP, rs139580877, was not available in the Rotterdam Study exome data. This variant was imputed using the GIANT 1000 Genomes Phase I Version 3 All reference panel, as previously described [36]. In brief, after filtering SNPs genotyped with the Illumina v3 Infinium II HumanHap550 microarray for deviations from Hardy-Weinberg proportions (P< 1 × 10−)6, call
Results
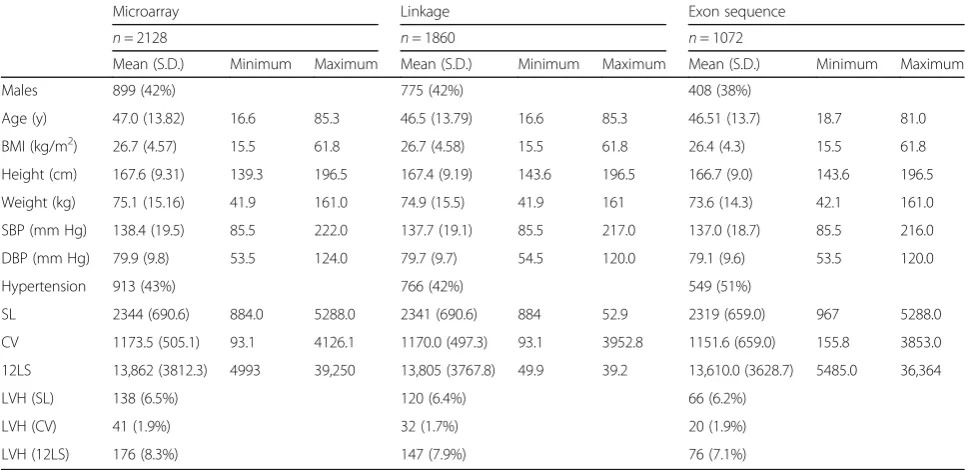
Table 1 shows characteristics of the participants in the LVH linkage, microarray, and exome sequence analyses. The proportion of LVH cases for each proxy measure was determined using published cut-off values [37, 38]. There were no significant differences between these overlapping groups. Table 2 shows the correlation be-tween the traits (r = 0.76 in the adjusted model for SL and 12LS, 0.17 between SL and CV, and 0.48 for CV and 12LS). Table 3 shows the loadings of the three LVH proxies (SL, CV, 12LS) to the two PCs that were con-structed. PC1 predominantly captured SL and 12LS, while PC2 correlated strongly with CV and moderately with SL. Table 4 shows the linkage results for the LVH proxy measures, which yielded a total of seven regions with suggestive LOD scores (LOD > 1.9). SL was linked to three regions, with the highest LOD score for chromosome 20 (LOD = 2.64) and two additional regions on chromosomes 4 (LOD = 2.14) and 15 (LOD = 1.92). Suggestive LOD scores for CV were seen on chromo-somes 1 (LOD = 2.4) and 6 (LOD = 2.17). There was sug-gestive linkage of 12LS to chromosomes 5 (LOD = 2.18) and 20 (LOD = 2.12). Linkage results for the principal component analysis of the LVH measures showed one significant LOD score for PC2 on 15q11.2 (LOD = 3.01). This region was also linked to SL (LOD = 1.92). Two regions were suggestively linked to PC1: 11q13.4 (LOD = 2.01) and 20p12.1 (LOD = 2.83), which was also linked to SL and 12LS. For PC2, there were three suggestive linkage results, for chromosomes 6 (LOD = 2.09), 9 (LOD = 2.35) and 22 (LOD = 1.99).
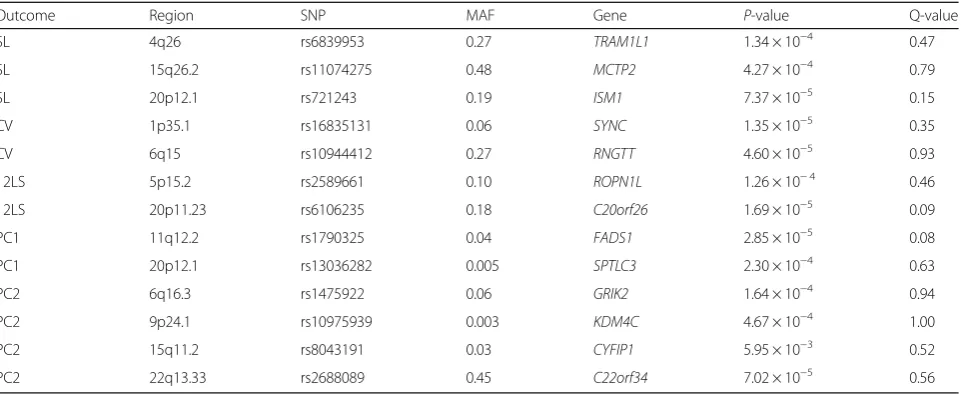
The chromosome 6 region was also linked to CV. Plots showing the linked regions by chromosome are provided in Fig. 1. Table 5 shows the top common variant microarray-based association signals under the LVH trait linkage peaks, including P-values and MAF for each SNP. None achieved statistical significance after correction for multiple comparisons.
Variants in the coding sequence
The results of the search for less frequent exonic variants are summarized in Additional file1: Table S1. We focused on relatively rare (frequency < 5%) missense variants pre-dicted to be deleterious by at least two of the prediction algorithms used and non-sense variants. This selection yielded 471 variants in 356 genes in the 13 linkage inter-vals (LOD-2 SI), which we analysed with respect to the LVH proxy measures and PCs. Additional file1: Table S2 shows the results with a nominal P-value ≤0.05 after regressing out the effects of age, BMI, height and sex. This effort uncovered an A > G variation (rs139580877) in the SPEF2 gene on 5p13.2, which was significantly associated
Table 1Descriptive statistics of the Erasmus Rucphen Family (ERF) study population
Microarray Linkage Exon sequence
n= 2128 n= 1860 n= 1072
Mean (S.D.) Minimum Maximum Mean (S.D.) Minimum Maximum Mean (S.D.) Minimum Maximum
Males 899 (42%) 775 (42%) 408 (38%)
Age (y) 47.0 (13.82) 16.6 85.3 46.5 (13.79) 16.6 85.3 46.51 (13.7) 18.7 81.0
BMI (kg/m2) 26.7 (4.57) 15.5 61.8 26.7 (4.58) 15.5 61.8 26.4 (4.3) 15.5 61.8
Height (cm) 167.6 (9.31) 139.3 196.5 167.4 (9.19) 143.6 196.5 166.7 (9.0) 143.6 196.5
Weight (kg) 75.1 (15.16) 41.9 161.0 74.9 (15.5) 41.9 161 73.6 (14.3) 42.1 161.0
SBP (mm Hg) 138.4 (19.5) 85.5 222.0 137.7 (19.1) 85.5 217.0 137.0 (18.7) 85.5 216.0
DBP (mm Hg) 79.9 (9.8) 53.5 124.0 79.7 (9.7) 54.5 120.0 79.1 (9.6) 53.5 120.0
Hypertension 913 (43%) 766 (42%) 549 (51%)
SL 2344 (690.6) 884.0 5288.0 2341 (690.6) 884 52.9 2319 (659.0) 967 5288.0
CV 1173.5 (505.1) 93.1 4126.1 1170.0 (497.3) 93.1 3952.8 1151.6 (659.0) 155.8 3853.0
12LS 13,862 (3812.3) 4993 39,250 13,805 (3767.8) 49.9 39.2 13,610.0 (3628.7) 5485.0 36,364
LVH (SL) 138 (6.5%) 120 (6.4%) 66 (6.2%)
LVH (CV) 41 (1.9%) 32 (1.7%) 20 (1.9%)
LVH (12LS) 176 (8.3%) 147 (7.9%) 76 (7.1%)
Values presented are mean (standard deviation) or n (%)
BMIbody mass index,SBPsystolic blood pressure,DBPdiastolic blood pressure,SLSokolow-Lyon index,CVCornell product,12LS12-lead sum product Table 2Pearson’s correlations between LVH proxy measures
Unadjusted Adjusted
SL–12LS 0.80 0.76
SL–CV 0.29 0.17
CV–12LS 0.56 0.48
Adjusted model included age, sex, body-mass index, and height
with 12LS when adjusted for multiple testing (P-value = 4.2 × 10⁻⁴). This variant, with 108 carriers in ERF, is pre-dicted to be probably damaging by PolyPhen-2 with a score of 0.972 and as deleterious by SIFT with a score ran-ging between 0.02 and 0.03. It is a missense variant, among more than 2000 described for this gene. In the principal components analysis, rs138968470, on 11q13.1 in theMAP3K11gene, was associated with PC1 adjusted for multiple testing (P-value = 3.5 × 10⁻⁴). SKAT-O and burden tests provided some supporting evidence for the association of this gene with LVH proxy measures (Additional file 1: Table S3). Additionally, at the SL chromosome 4 locus, we identified a C > G variation (rs142551296) in PRSS12 that approached significance (P-value = 8.4 × 10⁻⁴). A second, more common intragenic variant insidePRSS12was nom-inally associated (rs35996030; P-value = 0.04). We re-ran the linkage analyses conditioning on these variants to see if they explained the observed linkage signals. For PC1, the LOD score in the 11q13.4 linkage region dropped in the conditional analysis (from 2.01 to 0.88), suggesting that the associated variant (rs138968470), or neighbouring
variants in linkage disequilibrium (LD), explained the link-age signal. This variant also showed evidence of associ-ation with the two traits (12LS and SL) underlying PC1 (P-value = 3.0 × 10⁻⁴ and P-value = 1.2 × 10⁻³, respect-ively). Using Gene Network (http://genenetwork.nl/gene/ ENSG00000173327), to perform in-depth analyses of the expression ofMAP3K11, demonstrated that its expression is strongly linked to rho signalling (ARGHGEF15, ARHG-DIA) (Fig.2).
Five of the linkage peaks contained loci recently identified in GWAS studies [5, 11]. To determine if the linkage signals were a result of those common variants, linkage was performed a second time, conditioned on the GWAS index SNPs. These analyses demonstrated that the observed peaks were not explained by the GWAS SNPs, although the estimates fluctuated some-what, likely as a result of smaller sample sizes (Additional file1: Table S4).
Replication
Summary statistics for the Rotterdam Study sample are provided in Additional file 1: Table S5. The vari-ant rs139580877 was imputed, using the 1000 Genomes reference panel; the imputation quality score (MACH RSQ) for this variant was 0.65, with a minor allele frequency of 0.008. The effect estimate for 12LS was essentially zero, and therefore, did not replicate the ERF findings (Additional file 1: Table S6). The other variants of interest, rs35996030, rs138968470 and rs142551296, were directly genotyped in a subset of the Rotterdam Study cohort (n= 1450). There was no
Table 4Results of the linkage analyses
Trait N Chr. SNP LOD-2 SI Lower LOD-2 SI Upper Position (cM) LODMAX
SL 1860 4 rs1032328 90,166,159 157,272,456 144.46 2.14
SL 1860 15 rs290370 88,026,435 102,212,431 112.3 1.92
SL 1860 20 rs204115 11,094,951 23,352,685 38.11 2.64
CV 1860 1 rs6619 12,296,232 53,396,842 59.63 2.40
CV 1860 6 rs2040431 72,253,060 117,799,468 108.31 2.17
12LS 1860 5 rs1442470 7,205,420 25,399,905 42.3 2.18
12LS 1860 20 rs466243 11,017,796 23,352,685 40.7 2.12
PC1 1860 11 rs1530354 33,896,047 78,743,080 65.21 2.01
PC1 1860 20 rs2077147 11,990,037 38,247,165 45.09 2.83
PC2 1860 6 rs1391503 87,511,828 105,402,837 99.69 2.09
PC2 1860 9 rs748530 8,378,662 25,788,723 40.22 2.35
PC2 1860 15 rs1562203 – 23,707,591 0 3.01
PC2 1860 22 rs138383 35,687,558 44,707,606 46.89 1.99
Model adjusted for age, sex, body-mass index, and height
SLSokolow-Lyon,CVCornell Voltage product,12LStwelve-lead sum product,PC1first principal component,PC2second principal component,Nsample size,Chr. chromosome,LOD-2 SI Lowerposition of lower boundary of support interval in base pairs,LOD-2 SI Upperposition of upper boundary of support interval in base pairs,LODMAXLOD score at SNP
Table 3PC loadings for LVH proxies
Principal Component
PC1 PC2
SL 0.84 −0.48
CV 0.61 0.78
12LS 0.95 −0.08
evidence of association for any of these variants in the Rotterdam Study.
Discussion
We performed a linkage study on LVH proxy measure-ments, and PCs, and identified one significant locus (15q11.2) and 10 suggestive regions (1p34, 4q31, 5p14, 6q15, 6q21, 9p21, 11q13.4, 15q25, 20p12, 22q13). Exome variant analysis in these regions uncovered a missense coding variation in MAP3K11 on 11q134 for PC1; the MAP3K11variant substantially decreased the LOD score for this peak. The 24 carriers of this missense mutation clustered into five pedigrees in the ERF population (Additional file1: Figure S2).
Genetic variants discovered by GWAS, based on indi-vidual single-nucleotide polymorphisms (SNPs), explain only a small proportion of the heritability of complex traits [10, 39, 40]; we found variants with larger effect sizes compared to the ones found with GWAS. Our ana-lysis of rare coding variants in these linkage regions re-vealed a variant, rs138968470 on 11q13.1 in the MAP3K11 gene, associated with PC1. Conditional link-age analysis, including the MAP3K11 variant, reduced the LOD score (from 2.01 to 0.88), suggesting that this variant largely explained the linkage signal at this chromosomal location. The SNP is located in the first exon of a gene encoding a protein that belongs to the serine/threonine kinase family of mitogen-activated pro-tein kinases. MAP3K11 (also known as Mixed Lineage Kinase 3 (MLK3)) [34], works as a positive regulator of the c-Jun N-terminal kinase (JNK) signalling pathway [41]. MAP3K11 has a CDC42 and Rac interacting pro-teins binding domain (CRIB); autophosphorylation of
MAP3K11 and the induction of JNK is mediated through this CRIB domain bound to Cdc42/Rac/GTP [42]. JNK, an important member of the mitogen-activated protein kinase family (MAPK), is a pro-apoptotic kinase that plays an important role in the induction of cardiomyocyte apop-tosis in various pathologies [43]. Apoptosis increases with LVH, a critical mechanism that mediates the transition from compensated hypertrophy to heart failure [44]. In this way, a damaging mutation in MAP3K11 may be related to regulation of JNK and the subsequent JNK con-trolled pathway.
The other significant missense variant was rs139580877, located on 5p14. This variant is in exon 9 of the gene that encodes the sperm flagellar protein (SPEF2), which has been postulated to play an important role in spermatogen-esis and flagellar assembly [45]. This SNP was not found to be responsible for the linkage signal in the region, des-pite its strong association. The association with this rela-tively common variant (MAF = 0.015) could not be confirmed in the Rotterdam Study. One additional finding was studied further: a C/G variant (rs142551296) in the PRSS12gene, underlying the SL locus on chromosome 4, which approached significance (P-value = 8.4 × 10⁻⁴), but did not replicate in the Rotterdam Study. Absence of repli-cation could be related to imputation quality for rs139580877 and the low number of carriers for the other SNPs (Additional file1: Table S4).
A number of the linkage peaks contained SNPs identi-fied in a large GWAS of these traits. Linkage analysis, conditioned on the index SNPs from the GWAS, did not significantly alter the linkage results. This suggests that the linkage peaks were not driven by the common vari-ants identified in the GWAS.
Table 5Top association signals from the microarray data under the LVH trait linkage peaks
Outcome Region SNP MAF Gene P-value Q-value
SL 4q26 rs6839953 0.27 TRAM1L1 1.34 × 10⁻⁴ 0.47
SL 15q26.2 rs11074275 0.48 MCTP2 4.27 × 10⁻⁴ 0.79
SL 20p12.1 rs721243 0.19 ISM1 7.37 × 10⁻⁵ 0.15
CV 1p35.1 rs16835131 0.06 SYNC 1.35 × 10⁻⁵ 0.35
CV 6q15 rs10944412 0.27 RNGTT 4.60 × 10⁻⁵ 0.93
12LS 5p15.2 rs2589661 0.10 ROPN1L 1.26 × 10⁻⁴ 0.46
12LS 20p11.23 rs6106235 0.18 C20orf26 1.69 × 10⁻⁵ 0.09
PC1 11q12.2 rs1790325 0.04 FADS1 2.85 × 10⁻⁵ 0.08
PC1 20p12.1 rs13036282 0.005 SPTLC3 2.30 × 10⁻⁴ 0.63
PC2 6q16.3 rs1475922 0.06 GRIK2 1.64 × 10⁻⁴ 0.94
PC2 9p24.1 rs10975939 0.003 KDM4C 4.67 × 10⁻⁴ 1.00
PC2 15q11.2 rs8043191 0.03 CYFIP1 5.95 × 10⁻³ 0.52
PC2 22q13.33 rs2688089 0.45 C22orf34 7.02 × 10⁻⁵ 0.56
No explanatory variants were found for most of the loci (suggestively) linked to LVH, for which there are a number of potential explanations. Linkage peaks are not precise in highlighting the location of the causal variant; even the region of interest cannot be easily pinpointed. Additionally, we did not take into account alternative mechanisms, such as structural and copy number var-iations (CNVs) or repeats in the linkage regions. Lastly, causal rare variants may be located outside the coding sequence, which we did not include in our sequencing analyses.
Conclusions
In conclusion, 13 loci were identified for ECG LVH proxy measures and PCs using linkage analysis in a large pedigree; these were subsequently fine-mapped with microarray and exome sequence data. Common variation from the micro-arrays did not explain these peaks. The exome data, though, suggested the involvement of MAP3K11 (11q13) in LVH through the regulation of JNK. However, we cannot exclude the presence of other variants that are in linkage disequilib-rium with theMAP3K11variant (rs138968470) that might explain the observed association.
Further analysis will need to be performed to demon-strate the involvement of this protein in LVH. A number of other suggestively linked peaks were determined. We could not explain these with microarray or exonic se-quence variants at present, asking for more extensive follow-up outside the coding regions.
Additional file
Additional file 1:Table S1.Coding variants under the linkage peaks for LVH proxy measurements.Table S2.Selected damaging variants in the coding regions contained in the linkage regions.Table S3.SKAT and burden tests for genes of interest.Table S4.Results of linkage analyses before (LOD1) and after (LOD2) regression on GWAS SNPs under the linkage peaks.Table S5.Descriptive statistics of the Rotterdam study population.Table S6.Replications results in the Rotterdam Study.
Figure S1.Venn diagram showing the overlap between the different ERF
genotyping experiments.Figure S2.Pedigrees segregating rs138968470. (DOCX 119 kb)
Abbreviations
12LS:12-lead sum QRS product; BMI: Body mass index; CRIB: CDC42 and Rac interacting proteins binding domain; CV: Cornell voltage product; ECG: Electrocardiogram; ERF: Erasmus Rucphen Family Study; GATK: Genome Analysis Toolkit; GWAS: Genome Wide Association Studies; HWE: Hardy Weinberg Equilibrium; JNK: c-Jun N-terminal kinase; LD: Linkage disequilibrium; LVH: Left ventricular hypertrophy; MAF: Minor allele frequency; MEANS: Modular ECG Analysis System; MI: Myocardial infarction; PC: Principal component; SL: Sokolow-Lyon index; SNP: Single-nucleotide polymporphisms; SNVs: Single nucleotide variants; MAPK: Mitogen activated protein kinase family; SPEF2: Sperm flagellar protein; CNV: Copy number variations; SBP: Systolic blood pressure; DBP: Diastolic blood pressure; dbNSFP: Database of human non-synonymous SNPs and their functional predictions
Acknowledgements
We are grateful to all study participants and their relatives, general practitioners and neurologists for their contributions and to P. Veraart for her help in genealogy, J. Vergeer for the supervision of the laboratory work and P. Snijders for his help in data collection. Najaf Amin is supported by the Hersenstichting Nederland (the Netherlands Brain Foundation) (Project Number F2013(1)-28).
Rotterdam study: We are grateful to the study participants, the staff from the Rotterdam Study and the participating general practitioners and pharmacists. We thank Mr. Pascal Arp, Ms. Mila Jhamai and Mr. Marijn Verkerk for their help in creating the RS-Exome-Sequencing database.
Funding
The Erasmus Rucphen Family (ERF) study as a part of EUROSPAN (European Special Populations Research Network) was supported by European Commission FP6 STRP Grant No. 018947 (LSHG-CT-2006- 01947) and also received funding from the European Community’s Seventh Framework Programme (FP7/2007– 2013)/Grant Agreement HEALTH-F4–2007-201413 by the European Commission under the programme“Quality of Life and Management of the Living Resources” of 5th Framework Programme (No. QLG2-CT-2002-01254). High-throughput analysis of the ERF data was supported by joint grant from Netherlands Organization for Scientific Research and the Russian Foundation for Basic Research (NWO- RFBR 047.017.043), and Russian Federal Agency of Scientific Organizations projects VI.53.2.2 and 0324–2015-0003. Exome sequencing analysis in ERF was supported by the Netherlands Organization for the Health Research and Development grant for Project No. 91111025. This work was also supported by the Federal Agency of Scientific Organizations #0324–2015-0003 (IZ, AK and TA). Fi-nally, this work was further funded by the European Union's Horizon 2020 re-search and innovation programme as part of the Common mechanisms and pathways in Stroke and Alzheimer's disease (CoSTREAM) project ( www.costrea-m.eu, grant agreement No 667375) and the European Union’s Horizon 2020 re-search and innovation programme Marie Skłodowska-Curie Research and
Innovation Staff Exchange (RISE) under the grant agreement No 645740 as part of the Personalized pREvention of Chronic DIseases (PRECeDI) project.
The Rotterdam Study is funded by Erasmus Medical Center (MC) and Erasmus University, Rotterdam; Netherlands Organization for the Health Research and Development; the Research Institute for Diseases in the Elderly; the Ministry of Education, Culture and Science; the Ministry for Health, Welfare and Sports; the European Commission; and the Municipality of Rotterdam. The Exome-Sequencing dataset was funded by the Netherlands Genomics Initiative (NGI)/Netherlands Organisation for Scientific Research (NWO) sponsored Netherlands Consortium for Healthy Aging (NCHA; Project No. 050–060-810), by the Genetic Laboratory of the Department of Internal Medicine, Erasmus MC, and by the and by a Complementation Project of the Biobanking and Biomolecular Research Infrastructure Netherlands (BBMRI-NL;
www.bbmri.nl; Project Number CP2010–41).
Availability of data and materials
The data that support the findings of this study are available on request from the corresponding author. The data are not publicly available due to them containing information that could compromise research participant privacy/consent.
Authors’contributions
Formal Analysis: CTS, IVZ, MN, MEvdB, NA, AD, EvL, AIG, LBP, JAK, AVK, TIA, CMvD, AI. Writing–Original Draft Preparation: CTS, RW, CMvD, AI. Investigation and Resources: CMR, BAO, BHS, AGU, CMvD. Software: AVK. Supervision: CMR, RW, TIA, CMvD, AI. Conceptualization: CMvD, AI. Writing–Review & Editing: ALL AUTHORS. All authors read and approved the final manuscript.
Ethics approval and consent to participate
The Medical Ethics Committee of the Erasmus University Medical Center approved the ERF study protocol and all participants, or their legal representatives, provided written informed consent. Approval MEC 213.57512002.
Consent for publication
Not applicable.
Competing interests
The authors declare that the research was conducted in the absence of any commercial or financial relationships that could be construed as a potential conflict of interest.
Publisher’s Note
Springer Nature remains neutral with regard to jurisdictional claims in published maps and institutional affiliations.
Author details
1Genetic Epidemiology Unit, Department of Epidemiology, Erasmus University Medical Center, Rotterdam, the Netherlands.2Center for Research in Genetics and Genomics (CIGGUR), Institute of Translational Medicine (IMT), GENIUROS Research group, School of Medicine and Health Science, Universidad del Rosario, Bogotá, Colombia.3Doctoral Program in Biomedical Sciences, Universidad del Rosario, Bogotá, Colombia.4Institute of Cytology and Genetics SD RAS, Novosibirsk, Russia.5Department of Epidemiology, Erasmus University Medical Center, Rotterdam, the Netherlands.6Department of Medical Informatics, Erasmus University Medical Center, Rotterdam, the Netherlands.7Department of Clinical Genetics, Erasmus University Medical Center, Rotterdam, the Netherlands.8Center for Medical Systems Biology, Leiden, the Netherlands.9Department of Internal Medicine, Erasmus University Medical Center, Rotterdam, the Netherlands.10Inspectorate of Health care, The Hague, the Netherlands.11CARIM School for Cardiovascular Diseases, Maastricht Centre for Systems Biology (MaCSBio), and Department of Biochemistry, Maastricht University, Maastricht, the Netherlands.
Received: 9 May 2017 Accepted: 21 February 2018
References
2. Arnett DK, de las Fuentes L, Broeckel U. Genes for left ventricular hypertrophy. Curr Hypertens Rep. 2004;6(1):36–41.
3. Bella JN, Goring HH. Genetic epidemiology of left ventricular hypertrophy. Am J Cardiovasc Dis. 2012;2(4):267–78.
4. Arnett DK, Devereux RB, Rao DC, Li N, Tang W, Kraemer R, Claas SA, Leon JM, Broeckel U. Novel genetic variants contributing to left ventricular hypertrophy: the HyperGEN study. J Hypertens. 2009;27(8):1585–93. 5. Shah S, Nelson CP, Gaunt TR, van der Harst P, Barnes T, Braund PS, Lawlor
DA, Casas JP, Padmanabhan S, Drenos F, et al. Four genetic loci influencing electrocardiographic indices of left ventricular hypertrophy. Circ Cardiovasc Genet. 2011;4(6):626–35.
6. Post WS, Larson MG, Myers RH, Galderisi M, Levy D. Heritability of left ventricular mass: the Framingham heart study. Hypertension. 1997;30(5):1025–8. 7. Foppa M, Duncan BB, Rohde LE. Echocardiography-based left ventricular
mass estimation. How should we define hypertrophy? Cardiovasc Ultrasound. 2005;3:17.
8. Mayosi BM, Avery PJ, Farrall M, Keavney B, Watkins H. Genome-wide linkage analysis of electrocardiographic and echocardiographic left ventricular hypertrophy in families with hypertension. Eur Heart J. 2008;29(4):525–30. 9. Mutikainen S, Ortega-Alonso A, Alen M, Kaprio J, Karjalainen J, Rantanen T,
Kujala UM. Genetic influences on resting electrocardiographic variables in older women: a twin study. Ann Noninvasive Electrocardiol. 2009;14(1):57–64. 10. Silva CT, Kors JA, Amin N, Dehghan A, Witteman JC, Willemsen R, Oostra BA,
van Duijn CM, Isaacs A. Heritabilities, proportions of heritabilities explained by GWAS findings, and implications of cross-phenotype effects on PR interval. Hum Genet. 2015;134:1211–9.
11. van der Harst P, van Setten J, Verweij N, Vogler G, Franke L, Maurano MT, Wang X, Mateo Leach I, Eijgelsheim M, Sotoodehnia N, et al. 52 genetic loci influencing myocardial mass. J Am Coll Cardiol. 2016;68(13):1435–48. 12. Wang L, Beecham A, Di Tullio MR, Slifer S, Blanton SH, Rundek T, Sacco RL.
Novel quantitative trait locus is mapped to chromosome 12p11 for left ventricular mass in Dominican families: the family study of stroke risk and carotid atherosclerosis. BMC Med Genet. 2009;10:74.
13. Zhi D, Irvin MR, Gu CC, Stoddard AJ, Lorier R, Matter A, Rao DC,
Srinivasasainagendra V, Tiwari HK, Turner A, et al. Whole-exome sequencing and an iPSC-derived cardiomyocyte model provides a powerful platform for gene discovery in left ventricular hypertrophy. Front Genet. 2012;3:92. 14. Pardo LM, MacKay I, Oostra B, van Duijn CM, Aulchenko YS. The effect of
genetic drift in a young genetically isolated population. Ann Hum Genet. 2005;69(Pt 3):288–95.
15. Aulchenko YS, Heutink P, Mackay I, Bertoli-Avella AM, Pullen J, Vaessen N, Rademaker TA, Sandkuijl LA, Cardon L, Oostra B, et al. Linkage
disequilibrium in young genetically isolated Dutch population. Eur J Hum Genet. 2004;12(7):527–34.
16. Sayed-Tabatabaei FA, van Rijn MJ, Schut AF, Aulchenko YS, Croes EA, Zillikens MC, Pols HA, Witteman JC, Oostra BA, van Duijn CM. Heritability of the function and structure of the arterial wall: findings of the Erasmus Rucphen family (ERF) study. Stroke. 2005;36(11):2351–6.
17. 1999 World Health Organization-International Society of Hypertension Guidelines for the Management of Hypertension. Guidelines subcommittee. J Hypertens. 1999;17(2):151–83.
18. Eijgelsheim M, Aarnoudse AL, Rivadeneira F, Kors JA, Witteman JC, Hofman A, van Duijn CM, Uitterlinden AG, Stricker BH. Identification of a common variant at the NOS1AP locus strongly associated to QT-interval duration. Hum Mol Genet. 2009;18(2):347–57.
19. van Bemmel JH, Kors JA, van Herpen G. Methodology of the modular ECG analysis system MEANS. Methods Inf Med. 1990;29(4):346–53.
20. Willems JL, Abreu-Lima C, Arnaud P, van Bemmel JH, Brohet C, Degani R, Denis B, Gehring J, Graham I, van Herpen G, et al. The diagnostic performance of computer programs for the interpretation of electrocardiograms. N Engl J Med. 1991;325(25):1767–73.
21. Willems JL, Arnaud P, van Bemmel JH, Bourdillon PJ, Degani R, Denis B, Graham I, Harms FM, Macfarlane PW, Mazzocca G, et al. A reference data base for multilead electrocardiographic computer measurement programs. J Am Coll Cardiol. 1987;10(6):1313–21.
22. de Bruyne MC, Kors JA, Hoes AW, Kruijssen DA, Deckers JW, Grosfeld M, van Herpen G, Grobbee DE, van Bemmel JH. Diagnostic interpretation of electrocardiograms in population-based research: computer program research physicians, or cardiologists? J Clin Epidemiol. 1997;50(8):947–52.
23. Leening MJ, Elias-Smale SE, Felix JF, Kors JA, Deckers JW, Hofman A, Stricker BH, Witteman JC. Unrecognised myocardial infarction and long-term risk of heart failure in the elderly: the Rotterdam study. Heart. 2010;96(18):1458–62. 24. O'Connell JR, Weeks DE. PedCheck: a program for identification of genotype
incompatibilities in linkage analysis. Am J Hum Genet. 1998;63(1):259–66. 25. Abecasis GR, Cherny SS, Cookson WO, Cardon LR. Merlin–rapid analysis of dense
genetic maps using sparse gene flow trees. Nat Genet. 2002;30(1):97–101. 26. Gudbjartsson DF, Jonasson K, Frigge ML, Kong A. Allegro, a new computer
program for multipoint linkage analysis. Nat Genet. 2000;25(1):12–3. 27. Kirichenko AV, Belonogova NM, Aulchenko YS, Axenovich TI. PedStr
software for cutting large pedigrees for haplotyping, IBD computation and multipoint linkage analysis. Ann Hum Genet. 2009;73(Pt 5):527–31. 28. Nothnagel M, Ellinghaus D, Schreiber S, Krawczak M, Franke A. A
comprehensive evaluation of SNP genotype imputation. Hum Genet. 2009; 125(2):163–71.
29. Li Y, Willer CJ, Ding J, Scheet P, Abecasis GR. MaCH: using sequence and genotype data to estimate haplotypes and unobserved genotypes. Genet Epidemiol. 2010;34(8):816–34.
30. Aulchenko YS, Ripke S, Isaacs A, van Duijn CM. GenABEL: an R library for genome-wide association analysis. Bioinformatics. 2007;23(10):1294–6. 31. Aulchenko YS, Struchalin MV, van Duijn CM. ProbABEL package for
genome-wide association analysis of imputed data. BMC Bioinformatics. 2010;11:134. 32. Storey JD, Tibshirani R. Statistical significance for genomewide studies. Proc
Natl Acad Sci U S A. 2003;100(16):9440–5.
33. Brouwer RW, van den Hout MC, Grosveld FG, van Ijcken WF. NARWHAL, a primary analysis pipeline for NGS data. Bioinformatics. 2012;28(2):284–5. 34. Li H, Durbin R. Fast and accurate short read alignment with
burrows-wheeler transform. Bioinformatics. 2009;25(14):1754–60.
35. Hofman A, Darwish Murad S, van Duijn CM, Franco OH, Goedegebure A, Ikram MA, Klaver CC, Nijsten TE, Peeters RP, Stricker BH, et al. The Rotterdam study: 2014 objectives and design update. Eur J Epidemiol. 2013;28(11):889–926. 36. Gorski M, van der Most PJ, Teumer A, Chu AY, Li M, Mijatovic V, Nolte IM,
Cocca M, Taliun D, Gomez F, et al. 1000 genomes-based meta-analysis identifies 10 novel loci for kidney function. Sci Rep. 2017;7:45040. 37. Barrios V, Calderon A, Coca A, Gonzalez-Juanatey JR, Sarria A,
Rodriguez-Padial L. Computerized interpretation of the electrocardiogram in the diagnosis of left ventricular hypertrophy. The ELECTROPRES project. Rev Clin Esp. 2011;211(8):391–9.
38. Schillaci G, Battista F, Pucci G. A review of the role of electrocardiography in the diagnosis of left ventricular hypertrophy in hypertension. J
Electrocardiol. 2012;45(6):617–23.
39. Fridley BL, Biernacka JM. Gene set analysis of SNP data: benefits, challenges, and future directions. Eur J Hum Genet. 2011;19(8):837–43.
40. Eichler EE, Flint J, Gibson G, Kong A, Leal SM, Moore JH, Nadeau JH. Missing heritability and strategies for finding the underlying causes of complex disease. Nat Rev Genet. 2010;11(6):446–50.
41. Chadee DN, Kyriakis JM. MLK3 is required for mitogen activation of B-Raf, ERK and cell proliferation. Nat Cell Biol. 2004;6(8):770–6.
42. Du Y, Bock BC, Schachter KA, Chao M, Gallo KA. Cdc42 induces activation loop phosphorylation and membrane targeting of mixed lineage kinase 3. J Biol Chem. 2005;280(52):42984–93.
43. Rui T, Tang Q. IL-33 attenuates anoxia/reoxygenation-induced cardiomyocyte apoptosis by inhibition of PKCbeta/JNK pathway. PLoS One. 2013;8(2):e56089. 44. Gelpi RJ, Park M, Gao S, Dhar S, Vatner DE, Vatner SF. Apoptosis in severe,
compensated pressure overload predominates in nonmyocytes and is related to the hypertrophy but not function. Am J Physiol Heart Circ Physiol. 2011;300(3):H1062–8.