Power Flow Simulation of a 6-Bus Wind
Connected System and Voltage Stability
Analysis by Using STATCOM
Shaila Arif1
Lecturer, Dept. of EEE, Ahsanullah University of Science & Technology, Tejgaon, Dhaka, Bangladesh1
ABSTRACT: FACTS devices have become significant tools for power flow study now-a-days. It has widely improved the power system reliability, operation capability and safety. It has also improved the robust control of power system. FACTS devices are generally made of power electronics devices and circuits. That’s why FACTS devices have appeared as the most outstanding innovation in the era of power electronics and power system. FACTS devices are of many types: TCSC, SVC, UPFC, IPFC, STATCOM etc. Among all the devices STATCOM has become one of the most important power system components for reactive compensation of power and Voltage stabilizing capability. In this paper we have a 6 BUS power system with a variable speed wind generator connected to a BUS. For the stochastic nature of the wind the BUS voltage becomes degraded. With the help of STATCOM, corresponding BUS voltage has been improved significantly which has been studied and simulated in our paper. We have simulated the whole system with MATLAB PSAT environment and analyzed the voltage response, rotor angle response, eigen values, participation factor etc.
KEYWORDS:Flexible AC Transmission System Device (FACTS); Participation Factor; Static Synchronous Compensator (STATCOM); Eigen Values.
I. INTRODUCTION
At present the robust control of power system is the most significant issues to be concerned with. Day by days the system is becoming complex and stability issues are becoming vulnerable. This power system issues must have to be combated with the most reliable devices or equipment. For that reasons FACTS devices have appeared as the most reliable sources of fighting against instability issues of power system. Among all the stabilities such as frequency stability and voltage stability, voltage stability is the most vital one for the power system. Voltage instability issues generally increase as the various stochastic energy sources like solar, wind etc are incorporated to the system. These types of contingencies can easily be solved by the efficient use of FACTS devices. Due to the advancements of power electronics, robust control of FACTS devices and thus power system automation have become immensely outstanding. For our research purpose we have taken IEEE 6 BUS system with a wind generator connected to BUS number 3. Due to connection of wind voltage at bus 3 has been degraded. So we have incorporated a STATCOM (Static Synchronous Compensator) to the bus to improve voltage profile at that bus. The whole system has been simulated using MATLAB Simulink software PSAT (Power System Analysis Toolbox). PSAT has the building block of all FACTs devices. We have taken the STATCOM model from that window. PSAT also has the building block of wind turbine model and wind model. It have constant speed Induction generator, variable speed wind turbine with doubly-fed induction generator and direct drive synchronous generator.
II. POWER SYSTEM STABILITY
instability occurs in it. If proper measures are not taken timely then all the machines can be negatively affected. In that case generator’s cascaded failure can be occurred which lead to devastating blackout. Another important criterion to be considered is the low frequency oscillations. We know that, power system encounters generally four types of low frequency oscillations [1]. These are called electromechanical modes of oscillations. These oscillations can be inherent to the power system and create significant havoc to the power system if it is not properly handled. Those are below:
Local mode oscillation Inter area mode of oscillation Control mode oscillation Torsional mode oscillation
III. FACTSDEVICES
For AC transmission of electrical energy FACTS are generally composed of some static power electronics devices. There are a lot of FACTS devices to be used in practical. They are STATCOM, SVC, UPFC, IPFC, TCSC etc.At present technology to control the system has been developed. Actually these have become possible due tothe emergence and advancement of modern power electronics [2]. FACTS devices are the major contribution of that power electronics. FACTS devices can easily be controlled due to power electronics which have significantly improved its power transfer capability and the stability of the system. Some of the advantages are illustrated below:
Transient Stability and dynamic stability can be enhanced
No environmental hazards are observed due to the installation of FACTS devices.
Power transmission capability can be enhanced and also dependability and availability are ensured.
Power quality can be ensured for the large and enormous industrial application where power quality is one of the major issues.
Power system transmission can be utilized more.
IV. FACTS DEVICES FEATURES
There are a lot of criteria to be considered during installing FACTS devices. Among them the following three factors imperative.
Device type
Requirement of capacity.
Suitable location for the optimization of device function.
Voltage limiting problems can be easily be solved by incorporating FACTS devices [2]. Problems can be addressed for the following cases:
Applications of steady state system should be addressed Addressing short circuit leveling problems.
Addressing thermal limiting problems.
Problems regarding sub-synchronous resonance type should be addressed.
V. MATLAB PSAT FEATURES
PSAT (Power System Analysis Toolbox) is incorporated in MATLAB as a toolbox. It is a Graphical User Interface (GUI) where every kind of power system analysis can be performed. PSAT has the excellent features to simulate in GUI. It can perform the following analysis [3,6]. These are as follows.
Apart from the above analysis PSAT can perform participation factor and eigen value analysis. PSAT Graphical User Interface (GUI)is completely user friendly. Power system single line diagram can easily be drawn through this. The Data file can be converted from one form to another.
VI. STATIC SYNCHRONOUS COMPENSATOR (STATCOM)
STATCOM is known as the static synchronous compensator which is one of the most important FACTS devices to be mentioned. It is used on AC circuits for power transmission network. STATCOM is generally voltage source converter type source or sink. It is generally used for improvement of power factor and voltage regulation. It is a significant device for voltage stability issues. Capacitor connected to STATCOM acts as the DC source, so STATCOM can provide reactive power as per requirement and can also provide reactive power when needed. That’s how STATCOM compensate the reactive or voltage dip in the power system. Both STATCOM and SVC are suitable for reactive power compensation. Generally wind, solar etc. various types of renewable energy sources show stochastic nature. When these sources are connected to the grid, due to environmental problem these sources can severely degrade the voltage profile of the grid causing impairment of power quality and voltage dip. In those cases, STATCOM can play vital role to compensate for the voltage stability problem.
VII. PSAT SIMULATION
The following table is about the PV generators’ data which are connected to Bus 2 and Bus 4. In Bus 1 the slack bus or swing bus is connected.
Table-1: PV generator data
Bus MVA Voltage (KV)
2 50 11
3 30 11
4 100 11
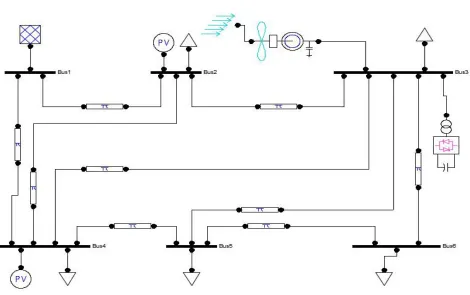
In MATLAB PSAT simulation environment, we have taken IEEE 6 BUS system. In which one slack bus, two PV generators connected in Bus2 and Bus4. One wind turbine which has constant speed synchronous generator output is connected in Bus3. The four loads are connected in buses 2,3, 4, 5 and 6.
Table-2:The following table is about the Load data:
Bus MVA Voltage Real power(p.u) Reactive power(p.u)
2 400 11 0.8 0.6
3 100 11 0.8 0.6
4 200 11 0.8 0.6
5 100 11 0.8 0.6
6 300 11 0.8 0.6
Wind Generator Data:
We have used 20MVA, 11KV, 50HZ for wind turbine which is connected to Bus 3. It has the following specifications: Nominal wind speed=15 m/s
Blade length =17m Blade numbers =3
After simulation we have got the following results:Voltage at different bus:
Table-3: Voltage output before STATCOM using
Bus No. Voltage in per unit
1 1
2 1
3 0.8647
4 1
5 0.81299
6 0.67769
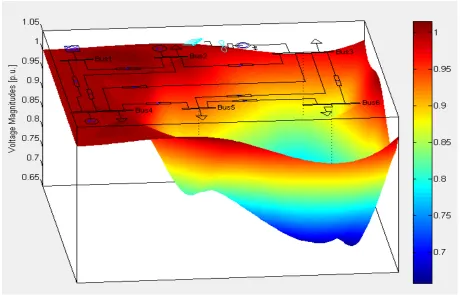
Voltage Profile:
Three dimensional voltage profiles has been shown in Fig. 1
Fig. 1: Three dimensional voltage profile before adding STATCOM
Simulation after Adding STATCOM
Fig. 2: One line diagram after connecting STATCOM
STATCOM Data:
MVA rating=2MVA
Voltage rating =11KV, Frequency = 50Hz Gain, Kr=50
Time constant, Tr=0.1
The following voltages have been obtained after adding STATCOM.
Table-4: Bus Voltage after adding STATCOM
Bus No. Voltage in per unit
1 1
2 1
3 0.99882
4 1
5 0.99705
6 0.9945
Fig.3: Three dimensional view of the system after adding STATCOM
VIII.CONCLUSION
If we carefully scrutinize the scenario, we can easily presume that the bus voltages have been significantly improved due to incorporating STATCOM in Bus 3. Not only the voltage magnitude in Bus 3 has been improved, but also in all three buses the voltage magnitudes have been improved. Through the above discussion we easily understand the contribution and significance of FACTS devices specially STATCOM in power system voltage stability improvement.
REFERENCES
[1] P. Kundur, “Power System Stability and Control”, New York: McGraw-Hill, 1994.
[2] Grillage, J., Arnold, C.P., Harker, B.J.: Computer Modeling of Electric Power Systems. John Wiley and Sons, Chichester (1983).
[3] Bhakti Nitve, Rajani Naik, “Steady state analysis of IEEE-6 Bus System Using PSAT power toolbox”,International Journal of Engineering Science and Innovative Technology (IJESIT)Volume 3, Issue 3, May 2014.
[4] “Modeling of STATCOM and SVC for Power System Steady State Operation and Enhancement of Transient Stability of A Multimachine Power System by Statcom.”- M.Sc. thesis report of Department of EEE, National Institute of Technology, Rouklee, INDIA
[5] T.Renuka, P.Chandhrasekhar, “Modeling of STATCOM with Six Pulse SPWM based VSC and its PowerFlow Study.” International Journal of Engineering and Technology Volume 2; Issue 7, July, 2012.
[6] J. H. Chow and K. W. Cheung, ―A toolbox for power system dynamics and control engineering education and research, IEEE Trans. Power Syst., vol. 7, no. 4, pp. 1559–1564, Nov. 1992.
BIOGRAPHY