‡Department for Functional Diagnostics of the Nervous System, University Hospital of
Strasbourg, France
§Intensive Care Unit, University Hospital of Strasbourg, France
¶Center for Cognitive Neuroscience, University of Trento, Italy
Corresponding address: B Kotchoubey, Institute of Medical Psychology and Behavioral Neurobiology, Gartenstrasse 29, 72074 T¨ubingen, Germany. Tel.: +49 7071 29 74221;
fax: +49 7071 29 5956; E-mail:[email protected]
Date accepted for publication 29 June 2005
Abstract
Electrical brain responses to words semantically related versus unrelated to their context were recorded in a coma patient on days 6 (Glasgow Coma Scale, GCS=6) and 22(GCS=9). Significant differences between related and unrelated words (which were completely matched in their physical features) were consistently observed in both examinations. This is the first evidence for semantic stimulus processing in coma.
Keywords
Coma; consciousness; event-related potentials (ERP); late positive complex; N400; language.
Introduction
The opinion, that patients in acute coma may understand speech, is based on very indirect and thus disputable data from subjective reports obtained after patients’ awakening from coma[1]. At the same time, event-related brain potential (ERP) studies obtained during coma demonstrated that about 30% of coma patients can differentiate auditory stimuli according to their physical features[2, 3]. There are data indicating that some patients with severe disorders of consciousness can process stimulus meaning (e.g., patients in persistent vegetative state[4, 5], minimally conscious state[6], akinetic mutism[7]). Such indications of semantic processing have, however, never been obtained in coma.
Case history
The patient, a native French speaking 74-year-old male who was right-handed and a heavy smoker, underwent a left lower pulmonary lobectomy for removal of a malignant epithelioma. Four weeks after discharge he was found unconscious in his flat. On admission to the intensive care unit he did not respond either to speech or to tactile stimuli, but showed withdrawal responses to pain. The right pupil was fixed and dilated. Corneal reflexes were present. There was a left-sided hemiplegia
38 B. Kotchoubey et al.
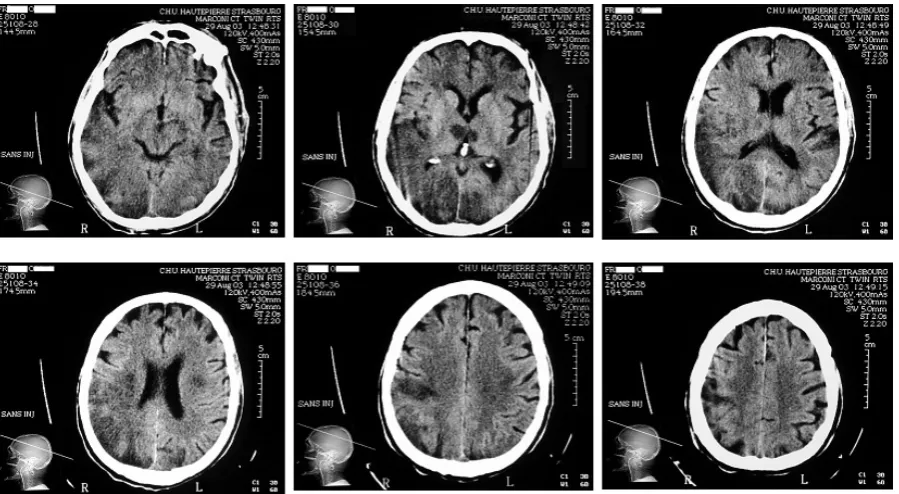
Fig. 1.Structural MRI of the patient (day 4) demonstrates multiple hypodense areas in the right perisylvian region, additional smaller bilateral ischaemic areas in the parietal and occipital lobes, as well as bithalamic lesions. No substantial changes were found in subsequent MR recordings.
with hyperreflexia, increased muscle tone, and a positive Babinski sign. A CT scan revealed several ischaemic areas in the lower arm of the internal capsule and the temporo-parietal junction of the right hemisphere, and in both thalami, but no haemorrhage. The EEG on day 2 (with maximum amplitudes below 10 µV) mostly contained α- and β-activity, which did not change with visual stimulation. No visual evoked potentials (EPs) and very low somatosensory EPs were recorded, but auditory EPs were normal. An MRI scan on day 4 is shown in Fig. 1.
During the first ERP recording session (day 6) the patient’s state did not substantially differ from that on admission and was rated as Glasgow Coma Scale (GCS) of 6 and Ramsay Scale of 5. During the second session (day 22) the patient remained confused and severely paralysed, but could open his eyes to instruction and pronounced some speech-like sounds. His state was scored as GCS 9, Ramsay 4. The somatic condition remained severe, and later he became completely unresponsive again. He died on day 45.
ERP examinations
ERP examinations were approved by the Ethical Committee of the University of Strasbourg. Informed consent was obtained from the patient’s wife.
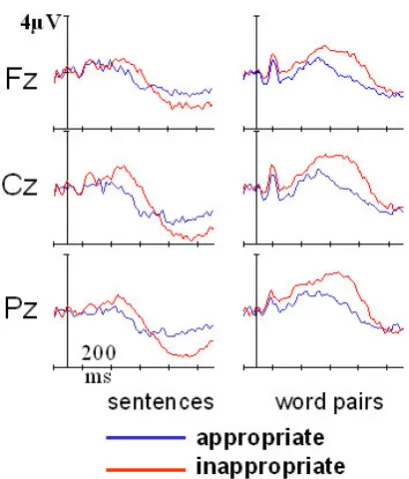
The ability to process semantic information was tested in two experimental paradigms, Word pairs (WP) and Sentences. In the former, 240 word pairs were presented, 50% of which were strongly semantically associated, and the rest were completely unrelated. In the latter, 200 short sentences were used, in 100 of which the last word was highly related to the context of the sentence. Their cloze probability, i.e., the probability that a native speaker would finish the sentence exactly with this particular word, was very high (>0.2). The other 100 sentences, in contrast, ended with a completely inappropriate word. All stimuli were French words pronounced by a female voice. Peak sound intensity ranged from 57 to 69 dB (A) as measured using a Voltcraft 329 Conrad Electronic sound level meter. The stimulus material had been validated on 20 control native speakers, resulting in a clear ERP difference according to the semantic stimulus features (Fig. 2).
Fig. 2.Event-related potentials at midline electrode sites, averaged over 20 French-speaking healthy control subjects, for the same stimuli as used in the patient. Negativity is plotted upwards. Note a prominent late positive complex in the sentence task.
The EEG (resolution 0.1678 µV/step; digitalisation rate 500 Hz; band pass 0.3–25 Hz) was recorded using 11 Ag/AgCl EEG electrodes, referred to the nose. Two pairs of electrodes recorded eye movements and allowed for the correction of eye artefacts using a regression technique. Finally, all trials with EEG amplitudes> ±100µV were ignored. ERPs were averaged over epochs of 1 s (oddball) or 1.1 s (semantic paradigms), including 100 ms prestimulus baseline.
Establishment of the statistical significance in ERP data of an individual patient remains an unsolved problem. We used several complementary techniques, each having its own advantages and disadvantages: (1) measuring an area under the curve in an appropriate time window in each single trial, with a subsequent ANOVA across trials; (2) running Student’s t-tests for between-condition differences[8]; (3) principal component analysis (PCA) with varimax rotation, in which all components with eigenvalues >1 were selected; and (4) a continuous wavelet transformation (CWT) based on Student between-condition differences. The last two techniques are multivariate, so Hotelling’sT2-test was applied to compare congruent versus incongruent stimuli.
Note that the PCA is not biased by the selection of the suitable time window, but performed over the entire waveforms. It can, therefore, only underestimate, but not overestimate, the between-condition difference[9]. The CWT, in contrast, being based on Student’s t-test, is biased towards overestimation. To compensate for this, a randomisation test was used: 1000 pairs of random ‘pseudoconditions’ were built and statistically compared. The percentage of p-values obtained in these pseudoconditions, which were equal to or smaller than the original p-value obtained in the true conditions, is an unbiased estimate for the significance of the difference between the two waveforms.
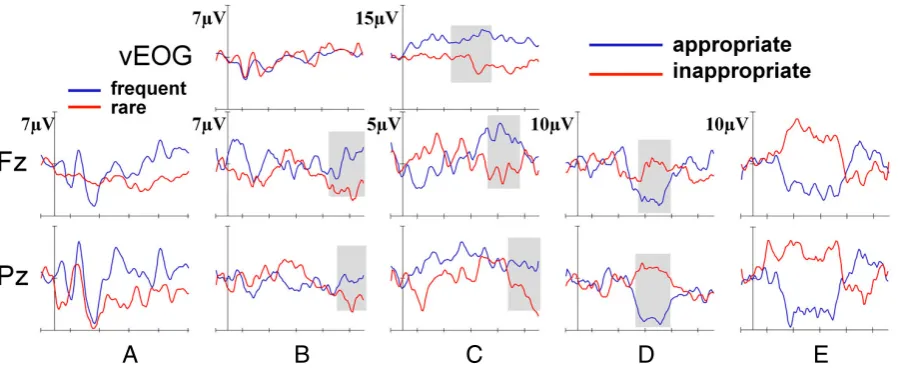
As can be seen in Fig. 3, tones elicited a cortical response P1-N1-P2, but without a differentiation between standards and deviants. The waveforms recorded in both semantic tasks appear to differ between the conditions. In WP, the PCA data approached significance (p = 0.14), and most importantly, randomisation confirmed that the difference was not due to chance(p = 0.013). In sentences, even the PCA showed a significant result(p=0.014).
A similar pattern of results was obtained 2 weeks later. In WP all tests revealed a highly significant difference between the ERPs to semantically related and unrelated words (allp values≤0.01). In the sentence paradigm, thep-values approached the significance level (p-values between 0.06 and 0.08).
40 B. Kotchoubey et al.
A
B
C
D
E
Fig. 3.Event-related potentials of the patient. (A) Oddball (day 6) shows a P1-N1-P2 complex, but the P3-like shift at Pz is not significant. (B) Word pairs, day 6. (C) Sentences, day 6. (D) Word pairs, day 22. (E) Sentences, day 22. In oddball, the blue and red lines indicate frequent and rare stimuli, respectively. In word pairs and sentences, the blue and red lines indicate semantically related and unrelated words, respectively. Each tick on the time axis stands for 200 ms. Negativity is plotted upwards. Only Fz and Pz leads are shown for the sake of simplicity, although the analysis took into account all 11 recording sites. Grey rectangles indicate intervals with long runs of significant(p <0.05) t-values (12–25 in a row). In the two critical conditions (responses to semantic stimuli in coma) vertical EOG traces are also presented for comparison with ERP waveforms. Note the lack of significant differences in the EOG during the intervals in which the differences in ERPs were significant.
strings of 10 or more consecutive significantt-values were located between 600 and 1000 ms. On day 22 these runs of significantt-values appeared only in the WP task between 450 and 700 ms. Thus, the significant difference on day 6 can be attributed to the LPC rather than earlier processes. On day 22, in contrast, the effects appear in the domain of the N400.
Discussion
The most typical response to semantically inappropriate words in healthy subjects is the centro-parietal N400. However, LPC responses in such conditions have also been described frequently[10, 11]. In the paper by McCallum et al.[10], this positive shift started at about 600 ms and its peak lay outside the recording epoch of 700 ms. All these results were presented in the form of group averages. Nothing is known of how the ratio between the N400 and the LPC may vary in individual subjects. It should not be surprising, therefore, that the difference between ERPs to semantically related and unrelated words in an aged coma patient deviates from the difference typical for a group of university students. Importantly, however, the effect was obtained using very conservative statistical techniques such as the PCA-basedT2-test, which always underestimates the existing difference, and the distribution-free randomisation test. This makes obtaining consistent significant effects by chance extremely unlikely[9].
In different studies, Glasgow coma scores between 8 and 10 are regarded as the threshold for the diagnosis of coma. During the second examination, the patient’s GCS was 9, he remained extremely disabled and could only follow the simplest instructions. His ERP responses, compared with the first examination, were of a shorter latency and appeared more like the responses of healthy individuals, but they were also noisier.
Thus it is possible that a patient in coma (day 6) or in a near-coma state (day 22) can process information of word meanings. This possibility may in the present case be explained by the fact that the main lesion was localised in the non-verbal hemisphere. Ischaemic strokes like that seen in Fig. 1 rarely result in such a severe disorder of consciousness, but the patient’s condition may be complicated, not only by the secondary oedema of the brain stem structures but also by brain hypoxia related to his background pulmonary disease.
The study was supported by the German Research Society (DFG), SFB 550, grant for BK. We are indebted to V. Bostanov for his help with the statistical analysis.
References
1. van Lommel P, van Wees R, Meyers V, Elfferich I. Near-death experience in survivors of cardiac arrest: a prospective study in the Netherlands. Lancet 2001; 358: 2039–45.
2. Fischer C, Morlet D, Bouchet P, Luaute J, Jourdan C, Salord F. Mismatch negativity and late auditory evoked potentials in comatose patients. Clin Neurophysiol 1999; 110: 1601–10. 3. Kane NM, Butler SR, Simpson T. Coma outcome prediction using event-related potentials: P3
and mismatch negativity. Audiol Neurootol 2000; 5: 186–91.
4. Kotchoubey B, Lang S, Bostanov V, Birbaumer N. Is there a mind? Psychophysiology of unconscious patients. News Physiol Sci 2002; 17: 38–42.
5. Neumann N, Kotchoubey B. Assessment of cognitive functions in severely paralysed and severely brain-damaged patients: neuropsychological and electrophysiological techniques. Brain Res Protoc 2004; 14: 25–36.
6. Schiff ND, Rodriguez-Moreno D, Kamal A et al. fMRI reveals large-scale network activation in minimally conscious patients. Neurology 2005; 64: 514–23.
7. Kotchoubey B, Schneck M, Lang S, Birbaumer N. Event-related potentials in a patient with akinetic mutism. Neurophysiol Clin 2003; 33: 23–30.
8. Guthrie D, Buchwald JS. Significance testing of difference potentials. Psychophysiology 1991; 28: 240–4.
9. Das Gupta S, Perlman MD. Power of the noncentral F-test: effect of additional variates on Hotelling’sT2-test. J Am Statist Assoc 1974; 69: 174–80.
10. McCallum WC, Farmer SF, Pocock PV. The effects of physical and semantic incongruities on auditory event-related potentials. Electroencephalogr Clin Neurophysiol 1984; 59: 477–88. 11. M¨unte TF, Heinze HJ, Matzke M, Wieringa BM, Johannes S. Brain potentials and syntactic
violations revisited: No evidence for specificity of the syntactic positive shift. Neuropsychologia 1998; 36: 217–26.
12. Kiefer M. The N400 is modulated by unconsciously perceived masked words: further evidence for an automatic spreading activation account of N400 priming effects. Cognit Brain Res 2002; 13: 27–39.
13. Schwender D, Kunze-Kronawitter H, Dietrich P, Klasing S, Forst H, Madler C. Conscious awareness during general anaesthesia: patients’ perceptions, emotions, cognition and reactions. Br J Anaesth 1998; 80: 133–9.