R E S E A R C H
Open Access
Microarray-based identification of genes
associated with cancer progression and
prognosis in hepatocellular carcinoma
Fuqiang Yin
1,2†, Lipei Shu
3†, Xia Liu
4†, Ting Li
1, Tao Peng
3, Yueli Nan
5, Shu Li
5, Xiaoyun Zeng
2,5*and Xiaoqiang Qiu
5*Abstract
Background:Hepatocellular carcinoma (HCC) is the third leading cause of cancer-related deaths. The average survival and 5-year survival rates of HCC patients still remains poor. Thus, there is an urgent need to better understand the mechanisms of cancer progression in HCC and to identify useful biomarkers to predict prognosis. Methods:Public data portals including Oncomine, The Cancer Genome Atlas (TCGA) and Gene Expression Omnibus (GEO) profiles were used to retrieve the HCC-related microarrays and to identify potential genes contributed to cancer progression. Bioinformatics analyses including pathway enrichment, protein/gene interaction and text mining were used to explain the potential roles of the identified genes in HCC. Quantitative real-time polymerase chain reaction analysis and Western blotting were used to measure the expression of the targets. The data were analysed by SPSS 20. 0 software.
Results:We identified 80 genes that were significantly dysregulated in HCC according to four independent microarrays covering 386 cases of HCC and 327 normal liver tissues. Twenty genes were consistently and stably dysregulated in the four microarrays by at least 2-fold and detection of gene expression by RT-qPCR and western blotting showed consistent expression profiles in 11 HCC tissues compared with corresponding paracancerous tissues. Eleven of these 20 genes were associated with disease-free survival (DFS) or overall survival (OS) in a cohort of 157 HCC patients, and eight genes were associated with tumour pathologic PT, tumour stage or vital status. Potential roles of those 20 genes in regulation of HCC progression were predicted, primarily in association with metastasis.INTS8was specifically correlated with most clinical characteristics including DFS, OS, stage, metastasis, invasiveness, diagnosis, and age.
Conclusion:The significantly dysregulated genes identified in this study were associated with cancer progression and prognosis in HCC, and might be potential therapeutic targets for HCC treatment or potential biomarkers for diagnosis and prognosis.
Keywords:Hepatocellular carcinoma, Microarray, Progression, Prognosis
* Correspondence:[email protected];[email protected]
Fuqiang Yin, Lipei Shu and Xia Liu are co-first authors. †Equal contributors
2
Key Laboratory of High-Incidence-Tumor Prevention and Treatment (Guangxi Medical University), Ministry of Education, 22 Shuangyong Rd, Nanning, Guangxi 530021, People’s Republic of China
5School of Public Health, Guangxi Medical University, 22 Shuangyong Rd,
Nanning, Guangxi 530021, People’s Republic of China
Full list of author information is available at the end of the article
Background
Hepatocellular carcinoma (HCC) is the third leading cause of cancer-related deaths [1]. There are 750,000 new cases of HCC and nearly 700,000 deaths each year, making this a particularly lethal form of cancer [2]. Over the past decade major progress has been made in our understanding of the risk factors and molecular path-ways driving liver carcinogenesis, and these advances have led to substantial opportunities for HCC preven-tion, surveillance, early diagnosis, prediction of progno-sis, and therapy [1]. However, the average survival of HCC patients is normally between 6 and 20 months [3], and long-term prognosis is poor with reported 5-year survival rates ranging from 17 to 53 % [4]. Thus, there is an urgent need to better understand the mechanism of cancer progression and development in HCC and to identify useful biomarkers for diagnosis and prognosis.
High-throughput profiling technologies such as micro-arrays and, more recently, next-generation sequencing have become invaluable tools for biomedical research, and large amounts of data generated by those tools, including mRNA expression, DNA methylation, and microRNA expression, are collected in public archives such as the major public projects The Cancer Genome Atlas (TCGA) [5] and the International Cancer Genome Consortium [6], and the most prominent primary data archives, ArrayExpress [7], Gene Expression Omnibus (GEO) [8], Oncomine [9] and the databases of the Inter-national Nucleotide Sequence Database Collaboration [10]. The wide range of those databases, the various ways in which publicly archived gene expression data are being used in support of new studies, and reuse of these public data can be very powerful [11]. In particular, reusing of the data has the potential to predict treatment response and disease progression and was advantageous to develop precision therapies [12]. For example, based on data retrieved from Oncomine, TCGA, and GEO, Liu et al. identified several genes associated with ovarian cancer progression [13] and drug resistance [14]. In a similar manner, we identified that upregulation of E2F transcription factor 3 is associated with poor prognosis in HCC [15]. In the present study, using data of mRNA expression, DNA methylation, and clinical data retrieved from Oncomine, GEO, and the TCGA cohort, we identi-fied a group of genes associated with cancer progression and prognosis in HCC.
Methods Samples
All patients who underwent curative hepatectomy for primary HCC at the First Affiliated Hospital of Guangxi Medical University between March 2015 and September 2015 were eligible for inclusion in this study. Total of
11 HCCs and the matched paracancerous tissues were collected during surgery and stored in a liquid nitrogen tank until use for mRNA isolation and protein extraction. The study was endorsed by the Ethics Committee of Guangxi Medical University and was performed according to the Declaration of Helsinki, 2013 edition. All patients received an explanation of the aims of the study and signed informed consent.
mRNA isolation and quantitative real-time polymerase chain reaction (RT-qPCR) analysis
Total RNA from 11 HCC and their matched paracan-cerous tissues was isolated using a miRNeasy Mini Kit (Qiagen, Hilden, Germany). RNA was quantified by spec-trophotometry on a NanoDrop 2000 (Thermo Scientific, DE, USA). A total of 2μg RNA was subjected to cDNA synthesis using the miScript II RT Kit (Qiagen, Hilden, Germany). RT-qPCR was performed with the QuantiFast SYBR Green PCR Kit (Qiagen, Hilden, Germany). Data were collected with the StepOnePlus Real-Time PCR System (ABI, CA, USA) according to the manufacturer’s instructions. The gene expression was compared in each HCC sample and the matched paracancerous tissue, and then the homogeneity of variance in all samples was ana-lysed using the t-test. The RT-qPCR gene-specific primers were as follows: TBCE: forward primer, 5′-AGGCCAACA GATGTTCTCCAG-3′, reverse primer, 5′-CAGGGGGTT TCTTAGGCAGG-3′; INTS8: forward primer, 5′-AACT GAGAGTTCTACTGCTGGA-3′, reverse primer, 5′-GC TGCGCCCAAATCATAGC-3′; VIPR1: forward primer, 5′-TGCTGGGACACCATCAACTC-3′, reverse primer, 5′-TTGTCCGGAAAGAAGGCGAA-3′; CLEC4M: for-ward primer, 5′-TACTTCATGTCTAACTCCCAGCG-3′, reverse primer, 5′-GCTCCTCAGCAGTTTTGATTACG-3′; MARCO: forward primer, 5′-GGGGACACAGGACT TCAAGG-3′, reverse primer, 5′-CCCTGTTCTCCCTT CACACC-3′; DNASE1L3: forward primer, 5′-AGCCCT TTGTGGTCTGGTTC-3′, reverse primer, 5′-CGTCCG TGTAGACCTCAACC-3′; CRHBP: forward primer, 5′-AAATCCTCAGCAGGTTGCGA-3′, reverse primer, 5′-AAGGCGTCATCTTGGAAGGG-3′; FCN2: forward primer, 5′-CTGCAAGGACCTGCTAGACC-3′, reverse primer, 5′-TGTCATTCCCCAGCCAGAAC-3′; GAPDH (used as the control): forward primer, 5′-GAAGGTGAA GGTCGGAGT-3′, reverse primer, 5′-GAAGATGGTGA TGGGATTT-3′.
Protein extraction and western blotting
Fisher Scientific, MA, USA) and were transferred to the PVDF membrane using the Bio-Rad Criterion System (Bio-Rad, CA, USA). Membranes were blocked with 8 % non-fat dry milk in PBS containing 0.1 % Tween-20 (0.1 % TBST, pH7.4) for 1 h. Membranes were incu-bated with antibodies specific for human INTS8 (rabbit polyclonal antibody, 1:750 dilutions; Proteintech, Hubei, China) and GAPDH (rabbit polyclonal antibody, 1:1,000 dilution; Boster, Hubei, China) overnight at 4 °C. After 3 washings with 0.1 % TBST for 5 min, horseradish peroxidase-conjugated goat rabbit secondary anti-bodies (1:5,000 dilution; Bioss, Beijing, China) were applied, followed by washings with 0.1 % TBST for 5 min each at room temperature (RT). The bound immuno-complexes were detected using ECL+ reagent (GE Healthcare Bio-Sciences, NJ, USA) with a FluorChem M system (Proteinsimple, CA, USA).
Gene expression profiles
The genes significantly dysregulated in HCC were identi-fied based on the 4 microarrays, Chen Liver microarray (104 HCCs vs. 76 liver tissues), Roessler Liver micro-array (22 HCCs vs. 21 liver tissues), Roessler Liver 2 microarray (225 HCCs vs. 220 liver tissues) and Wurm-bach Liver microarray (35 HCCs vs. 10 liver tissues), which are all deposited in Oncomine database (https:// www.oncomine.org/resource/login.html) [9]. The 4 mi-croarrays together covering total of 386 cases of HCCs and 327 cases of normal liver tissues. The rank for a gene is the median rank for that gene across each of the analyses. DNA methylation, mRNA expression, and clinical data of 379 HCC patients in a TCGA cohort were retrieved from cBioPortal for Cancer Genomics (http://cbioportal.org) [16, 17], but only 157 samples with matched gene expression data, prognosis data and most of the other clinical data were used to analyze the clinical importance of the target genes. mRNA expression data associated with HCC metastasis were retrieved from microarray GDS3091 [18] and GDS274 [19], which were deposited in the GEO profiles databases (http:// www.ncbi.nlm.nih.gov/geoprofiles/) [8].
Bioinformatics analyses
Enrichment of the biological process and cellular component of a group of genes was determined using the DAVID online tool (http://david.abcc.ncifcrf.gov/) [20, 21]. Protein/gene-protein/gene interaction analysis was performed using the GeneMANIA online tool (http://www.genemania.org/) [22, 23]. Function prediction based on text mining was performed using the Coremine Medical online database (http://www.coremine.com/ medical/) [24].
Data analysis
The data were analysed by SPSS 20.0 software. The mRNA expression of a gene is presented as the mean ± SD. Homogeneity of variance was analysed using the t-test. Expression values of a gene were dichotomised into high and low expression using the median as a cutoff for analysis of clinical importance in a TCGA cohort, as described in a previous study [25]. The probability of survival and its significance was calculated using the Kaplan-Meier method and log-rank test, respectively. A Cox proportional hazard model was performed for multi-variate analysis of prognosis. The correlation between gene expression and clinicopathologic characteristics was evaluated by Pearson’sχ2
test (two-sided). The correlation between DNA methylation and gene expression was analysed using bivariate correlations.P values < 0.05 were considered to indicate statistically significant differences.
Results
Retrieval of significantly dysregulated genes in HCC
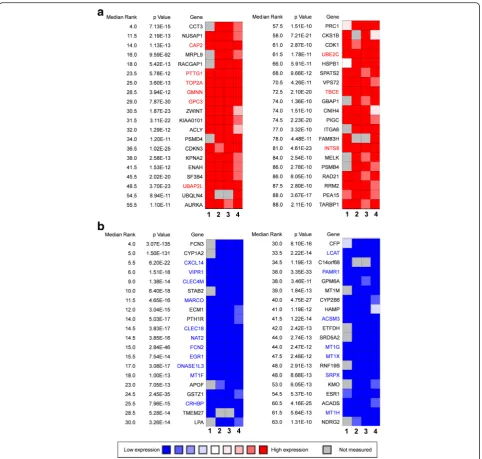
Four independent microarrays deposited in the Oncomine database were selected to identify genes associated with cancer development and progression in HCC. These microarrays were Chen Liver Statistics covering 104 cases of HCC and 76 cases of liver tissue, Roessler Liver Statistics covering 22 cases of HCC and 21 cases of liver tissue, Roessler Liver 2 Statistics covering 225 cases of HCC and 220 cases of liver tissue, and Wurm-bach Liver Statistics covering 35 cases of HCC and 10 cases of liver tissues. Based on analysis of these four in-dependent microarrays, 40 genes that were significantly upregulated (P< 1.36E-10) and 40 genes that were significantly downregulated (P< 1.31E-10) in HCC were retrieved (Fig. 1). Analysis of the 80 genes by the DAVID online tool indicated that cell cycle was the top biological process, covering 17 genes, and microtubule cytoskeleton was the top cellular component, covering 14 genes (Additional file 1: Table S1).
Among the 80 genes that were dysregulated in HCCs according to four independent microarrays covering a total of 386 cases of HCC and 327 cases of normal liver tissues, nine genes (CAP2, PTTG1, TOP2A,
GMNN, GPC3, UBE2C, UBAP2L, TBCE, and INTS8)
were consistently and stably upregulated and 18 genes (CXCL14,VIPR1, CLEC4M, MARCO, CLEC1B, NAT2,
FCN2, EGR1, DNASE1L3, MT1F, CRHBP, LCAT,
PAMR1, ACSM3, MT1G, MT1X, SRPX, and MT1H)
were consistently and stably downregulated in HCC, by least 2-fold (Fig. 1; Table 1). Among the above 27 genes, seven genes—CAP2, GMNN, PTTG1, TBCE,
TOP2A, UBE2C, and FCN2—encode proteins
interaction analysis was performed to further explain the interrelationships of these genes in HCC. As shown in Additional file 2: Figure S2, the 27 proteins/genes directly/ indirectly interacted with each other via co-localisation, genetic interactions, shared common pathways, and protein domains, and, in particular, co-expression, and 10
of them—VIPR1, DNASE1L3, SRPX, MT1H, CXCL14, CLEC4M,CRHBP,GPC3,NAT2, andMARCO—interacted with at least 14 other genes, more than half of all the genes in the interaction network (Additional file 2: Figure S2). Moreover, these genes were also those that were dysregulated at least 4-fold in HCC (Table 1).
Measurement of gene expression at mRNA and protein level
Among the 27 genes, the associations of seven with HCC are relatively well studied and described in published pa-pers. However, the relationship of the remaining 20 genes
with HCC was poorly understood, and these genes were selected for further analyses (Table 1). The expression of eight genes that were randomly selected from the 20 genes was measured by RT-qPCR in 11 tissues of HCC patients
Table 1Genes that were stably and consistently dysregulated in 386 cases of hepatocellular carcinoma compared with 327 cases of normal liver tissues according to four independent microarrays retrieved from the Oncomine database, and their associations with hepatocellular carcinoma
Gene Independent microarray data (Fold change) No. of
articlesa Associations with hepatocellular carcinoma
Direction of regulation
Chen Liver
Roessler Liver
Roessler Liver 2
Wurmbach Liver
TBCEb Up 2.125 2.403 2.822 2.419 -
-INTS8b Up 2.393 3.102 2.340 2.115 -
-UBAP2Lb Up 2.108 2.959 2.819 2.742 -
-GMNNb Up 3.362 7.340 4.696 3.394 1 Potential oncogene [38]
UBE2C Up 4.733 3.661 3.422 5.113 4 Cancer progression and poor prognosis [39]
PTTG1 Up 4.688 4.741 5.773 10.622 9 Angiogenesis, progression, and poor prognosis
[40,41], therapeutic target [42]
CAP2 Up 3.526 4.254 5.790 8.569 10 Multistage hepatocarcinogenesis [43], early detection [44]
TOP2A Up 2.663 11.236 8.292 13.321 11 Early age onset, shorter patient survival and
chemoresistance [45]
GPC3 Up 16.826 26.693 28.236 76.162 199 Diagnosis [29], cell proliferation and invasion [28]; prediction of recurrence [30]
VIPR1b Down 9.979 5.310 7.202 4.855 -
-CLEC4Mb Down 28.107 9.276 4.361 36.431 -
-MARCOb Down 11.333 6.107 3.984 20.154 -
-DNASE1L3b Down 8.386 12.378 7.653 10.303 -
-PAMR1b Down 2.726 2.381 2.473 2.917 -
-ACSM3b Down 2.902 6.135 4.836 11.262 -
-CLEC1Bb Down 6.600 6.605 4.748 36.770 1 Downregulated in a cohort of 65 pairs of human
HCCs [46]
MT1Fb Down 14.107 18.140 15.749 9.680 1 Inhibition of cancer growth [47]
CRHBPb Down 16.565 7.020 4.822 46.837 1 Downregulated in a cohort of 65 pairs of human
HCCs [46]
LCATb Down 4.917 8.507 8.064 7.435 1 LCAT activity correlated with serum albumin and
serum bilirubin level [48]
MT1Xb Down 10.812 11.558 8.227 6.903 1 HCC-related [49]
SRPXb Down 4.929 5.104 5.879 7.202 1 Proliferation, migration and invasiveness [50]
MT1Hb Down 13.846 9.037 8.473 7.723 1 Potential tumour suppressor [51]
FCN2b Down 10.881 9.089 6.299 44.688 2 HBV- and HCV-related HCC [52], FCN2 haplotypes associate with HCC [53]
CXCL14b Down 12.903 9.667 10.940 13.977 4 Potential diagnostic marker [54]; rs2237062
polymorphism influences HBV-related HCC
progression [52,55]; potential tumour suppressor [56]
MT1Gb Down 13.065 11.134 11.160 11.187 4 Tumour suppressor gene [51,57], biomarker [58]
EGR1 Down 3.541 10.547 6.769 9.241 12 Critical for hepatocarcinogenesis [59]
NAT2 Down 8.024 16.088 13.999 36.890 14 NAT2 polymorphism is risk factor for developing HCC [60], NAT2 activity is critical in smoking-related hepatocarcinogenesis [61]
a
No. of articles was based on a search in the PubMed database b
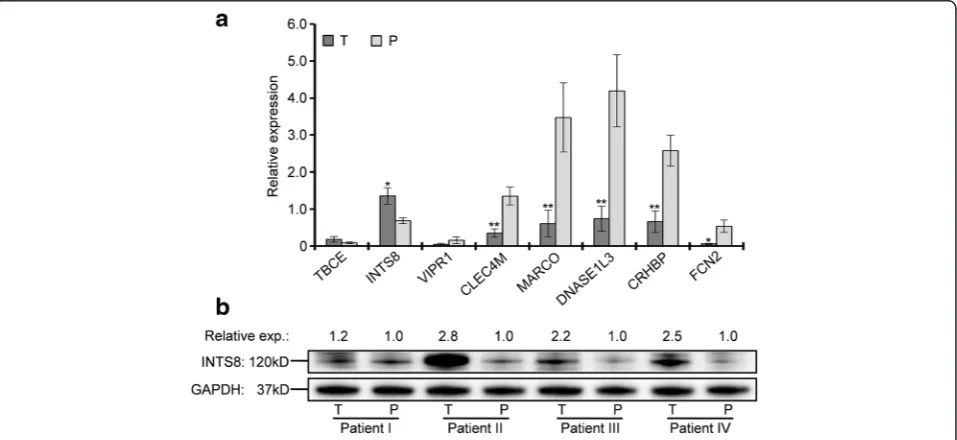
compared with matched paracancerous tissues. As shown in Fig. 2a, the expression of TBCE and INTS8 was increased, whereas that of VIPR1, CLEC4M, MARCO,DNASE1L3,CRHBP, andFCN2was decreased in HCC tissues, although the changes in TBCE and VIPR1 expression were not statistically significant. Compared with the average expression in paracancer-ous tissues, the expression of INTS8 in HCC was upregulated with 2.06-fold and the expression of
CLEC4M,MARCO,DNASE1L3,CRHBP, andFCN2was
downregulated with 3.83-, 5.70-, 5.63-, 3.87-, and 8.94-fold, respectively. All results of gene expression deter-mined by RT-qPCR were completely consistent with their expression identified by the four independent mi-croarrays (Fig. 1; Table 1). Furthermore, a significant increase at the protein level of INTS8 was observed in HCC tissues compared with corresponding paracancer-ous tissues (Fig. 2b), which was consistent with its expression at the mRNA level.
Analysis of clinical importance
The clinical importance in HCC of the 20 selected genes (Table 1) was evaluated on the basis of TCGA clinical data. A total of 379 HCC patient samples with clinical data in a cohort of TCGA were retrieved. Among these, 157 samples with mRNA expression values were selected for analysis of the relationship between genes and clin-ical characteristics. The expression values of a gene were categorised as high or low according to the median value in accordance with a previous study [25].
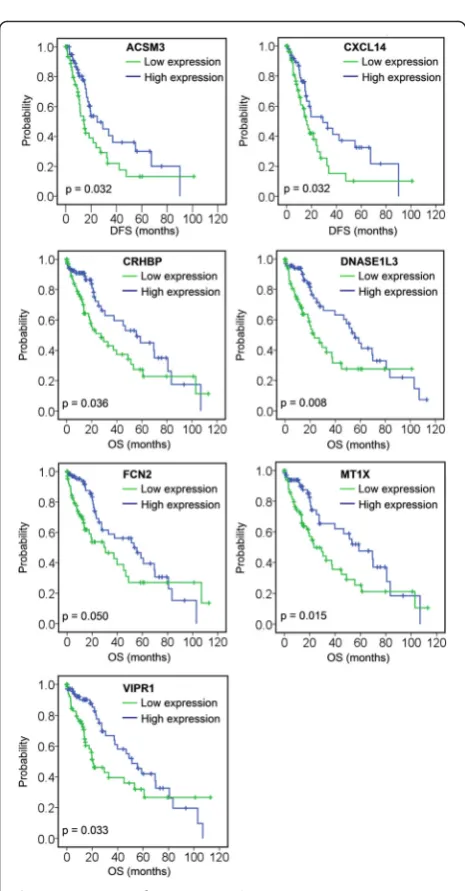
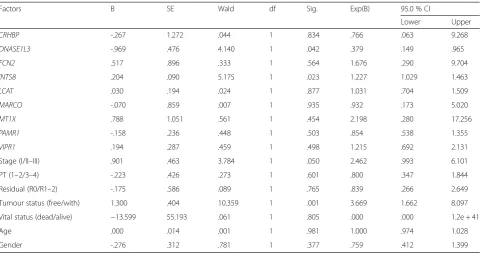
A total of 11 genes were associated with DFS and/or OS (Table 2); among those, low expression of ACSM3 and CXCL14 was associated with poor DFS, and low expression of CRHBP, DNASE1L3, FCN2, MT1X, and VIPR1 was associated with poor OS (Fig. 3, Table 2). Four genes were associated with both DFS and OS: high expression of INTS8 in HCC patients, and low expres-sion ofLCAT,MARCO, andPAMR1, was associated with poor DFS and OS (Fig. 4, Table 2). To elucidate whether any of the above genes was an independent factor for predicting patient survival, we performed multivariate analyses of tumour stage, tumour pathologic PT, tumour residual, tumour status, vital status, age, gen-der, and the 11 genes by a Cox proportional hazards model (Table 3). We found that stage (P= 0.050), tumour status (P= 0.001), DNASE1L3 expression (P= 0.042), and INTS8 expression (P= 0.023) were inde-pendent risk prognostic factors for OS in HCC patients, although no gene was found to be an independent prognostic factor for DFS (data not shown).
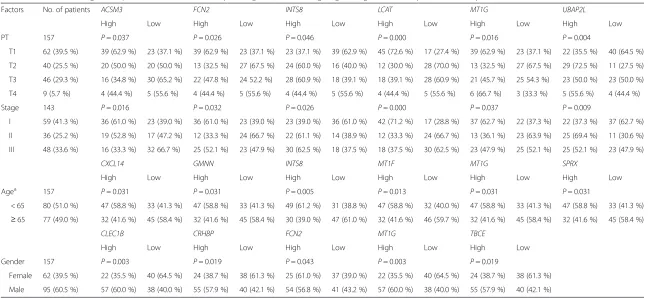
Six genes were associated with tumour pathologic PT and tumour stage (Table 4); among these, high expres-sion of INTS8 and UBAP2L, and low expression of ACSM3,FCN2, LCAT, andMT1G, was significantly asso-ciated with metastatic tumour and late stage (P≤0.05). In particular,UBAP2Lwas markedly and highly expressed in T2 tumours (72.5 % vs. 27.5 %) and LCAT was lowly expressed in T2 tumours (30.0 % vs. 70.0 %) and highly expressed in T1 tumours (72.6 % vs. 27.4 %). In addition, LCATwas highly expressed in stage I tumours (71.2 % vs. 28.8 %).
Ten genes were associated with age and gender. As shown in Table 4, we found that six genes—CXCL14,
GMNN, INTS8, MT1F, MT1G, and SPRX—were
expressed at low levels in HCC patients aged≥65 years. Expression of five genes was related to the gender of HCC patients. Except for FCN2, which is lowly expressed in male HCC patients, the other four genes,
CLEC1B, CRHBP, MT1G, and TBCE, were all lowly
expressed in female HCC patients. In addition, PAMR1 and MT1X were closely related to the vital status; both showed low expression in 60.3 % (38/63) of HCC patients with dead status, compared with high expression in 57.4 % (54/94) of patients with alive sta-tus (P= 0.022).
Table 2The associations of 11 genes with disease-free survival (DFS) and/or overall survival (OS) of patients with hepatocellular carcinoma in a TCGA cohort, analysed using Kaplan-Meier survival plots
DFS (Median) OS (Median)
95 % Confidence Interval 95 % Confidence Interval
Estimate Std. Error Lower Boundary Upper Boundary Estimate Std. Error Lower Boundary Upper Boundary
ACSM3 H 24.800 7.587 9.930 39.670
L 14.400 2.391 9.714 19.086
Overall 19.300 3.428 12.581 26.019
CXCL14 H 29.300 10.355 9.004 49.596
L 16.400 2.222 12.045 20.755
Overall 19.300 3.428 12.581 26.019
INTS8 H 14.400 2.408 9.681 19.119 21.700 5.048 11.805 31.595
L 27.200 4.266 18.839 35.561 53.300 10.531 32.659 73.941
Overall 19.300 3.428 12.581 26.019 37.800 8.792 20.568 55.032
LCAT H 29.300 5.287 18.937 39.663 55.600 13.029 30.063 81.137
L 14.800 2.129 10.628 18.972 21.700 5.133 11.640 31.760
Overall 19.300 3.428 12.581 26.019 37.800 8.792 20.568 55.032
MARCO H 24.800 6.094 12.856 36.744 53.300 16.525 20.911 85.689
L 15.600 1.710 12.248 18.952 23.300 5.664 12.199 34.401
Overall 19.300 3.428 12.581 26.019 37.800 8.792 20.568 55.032
PAMR1 H 29.300 7.881 13.853 44.747 69.500 7.445 54.908 84.092
L 16.400 3.616 9.312 23.488 21.100 1.762 17.647 24.553
Overall 19.300 3.428 12.581 26.019 37.800 8.792 20.568 55.032
CRHBP H 55.600 13.080 29.964 81.236
L 27.500 7.523 12.754 42.246
Overall 37.800 8.792 20.568 55.032
DNASE1L3 H 55.600 6.310 43.232 67.968
L 23.300 5.103 13.298 33.302
Overall 37.800 8.792 20.568 55.032
FCN2 H 53.300 12.677 28.453 78.147
L 30.600 10.341 10.331 50.869
Overall 37.800 8.792 20.568 55.032
MT1X H 58.800 12.301 34.690 82.910
L 23.300 5.997 11.546 35.054
Overall 37.800 8.792 20.568 55.032
VIPR1 H 51.300 7.615 36.374 66.226
L 20.600 5.643 9.540 31.660
Overall 37.800 8.792 20.568 55.032
The gene expression and survival data of 157 HCC patients in a TCGA cohort were used for the analysis. Expression values of a gene were dichotomised into high and low expression using the median as a cutoff
Potential roles of the genes in HCC progression
The potential roles of the 20 genes in HCC were predicted on the basis of Coremine Medical mining. As shown in Fig. 5, the associations of the genes with diag-nosis, progdiag-nosis, drug resistance, recurrence, metastasis, and invasiveness of HCC was comprehensively analysed. The results indicated that, with the exception ofPAMR1, the other 19 genes were all associated with at least one factor contributing to cancer progression, and many of the genes, for example GMNN,CXCL14,MT1G,MT1X, SPRX, and VIPR1, were closely associated with almost
all of the factors included in this analysis. Most of the genes were extensively associated with several factors. For example, 15 genes (including INTS8, LCAT, MARCO, andDANSE1L3) were associated with diagno-sis, 14 genes (including INTS8, MARCO, CRHBP, and VIPR1) were associated with metastasis, and 13 genes (including LCAT, MARCO, FCN2, and CXCL14) were associated with prognosis.
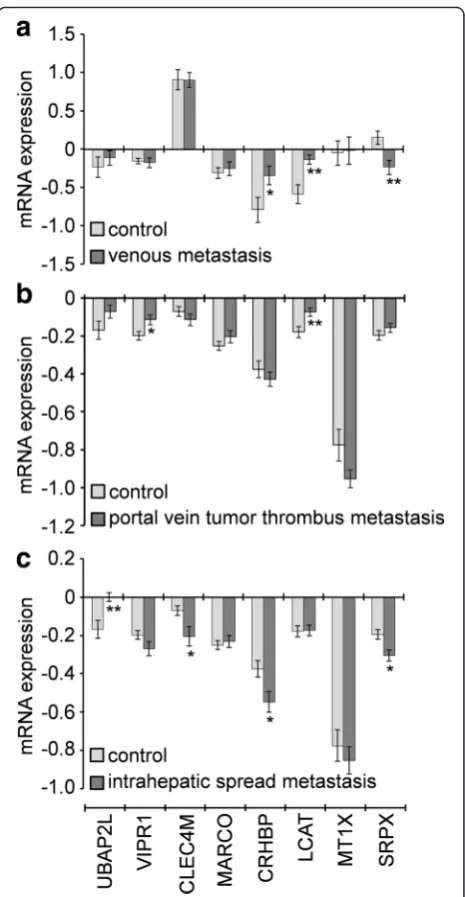
Based on the gene expression in two independent GEO microarrays corresponding to HCC metastasis, the association of the genes CLEC4M, CRHBP, MARCO, MT1X, SRPX, UBAP2L, andVIPR1 with metastasis was
Fig. 3Association of seven genes (ACSM3,CXCL14,CRHBP,
DNASE1L3,FCN2,MT1X, andVIPR1) with DFS or OS, analysed using Kaplan-Meier survival plots. The survival data of 157 HCC patients in a TCGA cohort were used for the analysis. Expression values of a gene were dichotomised into high expression (blueline) and low expression (greenline) using the median as a cutoff
further analysed; unfortunately, data for the other genes were unavailable. The expression of CRHBP, LCAT, and SPRX was significantly dysregulated in nine HCCs with venous metastasis compared with 11 HCC without (Fig. 6a). GenesVIPR1,LCAT,BAP2L,CLEC4M,CRHBP, and SRPX were significantly dysregulated in 32 HCCs with portal vein tumour thrombus metastasis and 33 HCCs with intrahepatic spread metastasis compared with 22 HCCs with no metastasis (Fig. 6b&c). In particu-lar, LCAT was highly expressed in HCC patients with venous metastasis and patients with portal vein tumour thrombus metastasis, and SRPXwas lowly expressed in HCC patients with venous metastasis and patients with intrahepatic spread metastasis (Fig. 6).
Correlation of DNA methylation with mRNA expression of the target genes
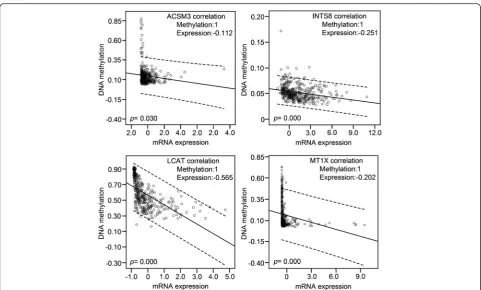
DNA methylation and mRNA expression data from 379 HCC patients in a TCGA cohort were retrieved and the correlations between them were analysed using bivariate correlations. Among the 20 genes that are poorly studied in HCC (Table 1), DNA methylation data of CLEC1B and SRPX were not available. DNA methylation was negatively correlated with the mRNA expression for eight genes, ACSM3, INTS8, LCAT, MT1X, CRHBP, MARCO,PAMR1, andVIPR1. In particular, high methy-lation of the first four genes was significantly correlated with lower mRNA expression (Fig. 7), indicating that the expression of these genes in HCC might be regulated by DNA methylation.
Discussion
Cancer is frequently considered to be a disease of the cell cycle because alterations in different families of cell cycle regulators cooperate in tumour development. Molecular analysis of human tumours has shown that cell cycle regulators are frequently mutated in human neoplasms, underscoring the importance of maintain-ing cell cycle commitment in the prevention of human cancer [26]. Abnormal expression of cell cycle control-lers, particularly G1/S-phase transition, is often impli-cated in the pathogenesis of most human cancers, including HCC. For example, vaccinia-related kinase 1 promotes HCC by controlling the levels of cell cycle regulators associated with G1/S transition [27]. In this study, 80 genes that were significantly dysregulated in HCC were identified based on four independent microar-rays covering a total of 386 cases of hepatocellular carcin-oma and 327 cases of normal liver tissues (Fig. 1), and biological process annotation of these genes revealed that 17 of these genes were implicated in cell cycle functions (Additional file 1: Table S1). These results suggested that these genes might contribute to cancer progression and development in HCC at least in part through regulation of the cell cycle.
Twenty-seven genes were further identified to be con-sistently dysregulated in all four microarrays by at least 2-fold (Table 1). The expression of eight of these genes (TBCE, INTS8,VIPR1, CLEC4M, MARCO, DNASE1L3, CRHBP, andFCN2) was confirmed in 11 tissues of HCC patients compared with matched paracancerous tissues
Table 3Multivariate analysis of prognosis of 157 HCC patients in a TCGA cohort using Cox proportional hazard model
Factors B SE Wald df Sig. Exp(B) 95.0 % CI
Lower Upper
CRHBP -.267 1.272 .044 1 .834 .766 .063 9.268
DNASE1L3 -.969 .476 4.140 1 .042 .379 .149 .965
FCN2 .517 .896 .333 1 .564 1.676 .290 9.704
INTS8 .204 .090 5.175 1 .023 1.227 1.029 1.463
LCAT .030 .194 .024 1 .877 1.031 .704 1.509
MARCO -.070 .859 .007 1 .935 .932 .173 5.020
MT1X .788 1.051 .561 1 .454 2.198 .280 17.256
PAMR1 -.158 .236 .448 1 .503 .854 .538 1.355
VIPR1 .194 .287 .459 1 .498 1.215 .692 2.131
Stage (I/II–III) .901 .463 3.784 1 .050 2.462 .993 6.101
PT (1–2/3–4) -.223 .426 .273 1 .601 .800 .347 1.844
Residual (R0/R1–2) -.175 .586 .089 1 .765 .839 .266 2.649
Tumour status (free/with) 1.300 .404 10.359 1 .001 3.669 1.662 8.097
Vital status (dead/alive) −13.599 55.193 .061 1 .805 .000 .000 1.2e + 41
Age .000 .014 .001 1 .981 1.000 .974 1.028
Gender -.276 .312 .781 1 .377 .759 .412 1.399
Table 4Associations of genes expression with AJCC tumour pathologic PT, tumour stage, age and gender in 157 patients with hepatocellular carcinoma
Factors No. of patients ACSM3 FCN2 INTS8 LCAT MT1G UBAP2L
High Low High Low High Low High Low High Low High Low
PT 157 P= 0.037 P= 0.026 P= 0.046 P= 0.000 P= 0.016 P= 0.004
T1 62 (39.5 %) 39 (62.9 %) 23 (37.1 %) 39 (62.9 %) 23 (37.1 %) 23 (37.1 %) 39 (62.9 %) 45 (72.6 %) 17 (27.4 %) 39 (62.9 %) 23 (37.1 %) 22 (35.5 %) 40 (64.5 %)
T2 40 (25.5 %) 20 (50.0 %) 20 (50.0 %) 13 (32.5 %) 27 (67.5 %) 24 (60.0 %) 16 (40.0 %) 12 (30.0 %) 28 (70.0 %) 13 (32.5 %) 27 (67.5 %) 29 (72.5 %) 11 (27.5 %)
T3 46 (29.3 %) 16 (34.8 %) 30 (65.2 %) 22 (47.8 %) 24 52.2 %) 28 (60.9 %) 18 (39.1 %) 18 (39.1 %) 28 (60.9 %) 21 (45.7 %) 25 54.3 %) 23 (50.0 %) 23 (50.0 %)
T4 9 (5.7 %) 4 (44.4 %) 5 (55.6 %) 4 (44.4 %) 5 (55.6 %) 4 (44.4 %) 5 (55.6 %) 4 (44.4 %) 5 (55.6 %) 6 (66.7 %) 3 (33.3 %) 5 (55.6 %) 4 (44.4 %)
Stage 143 P= 0.016 P= 0.032 P= 0.026 P= 0.000 P= 0.037 P= 0.009
I 59 (41.3 %) 36 (61.0 %) 23 (39.0 %) 36 (61.0 %) 23 (39.0 %) 23 (39.0 %) 36 (61.0 %) 42 (71.2 %) 17 (28.8 %) 37 (62.7 %) 22 (37.3 %) 22 (37.3 %) 37 (62.7 %)
II 36 (25.2 %) 19 (52.8 %) 17 (47.2 %) 12 (33.3 %) 24 (66.7 %) 22 (61.1 %) 14 (38.9 %) 12 (33.3 %) 24 (66.7 %) 13 (36.1 %) 23 (63.9 %) 25 (69.4 %) 11 (30.6 %)
III 48 (33.6 %) 16 (33.3 %) 32 66.7 %) 25 (52.1 %) 23 (47.9 %) 30 (62.5 %) 18 (37.5 %) 18 (37.5 %) 30 (62.5 %) 23 (47.9 %) 25 (52.1 %) 25 (52.1 %) 23 (47.9 %)
CXCL14 GMNN INTS8 MT1F MT1G SPRX
High Low High Low High Low High Low High Low High Low
Agea 157 P= 0.031 P= 0.031 P= 0.005 P= 0.013 P= 0.031 P= 0.031
< 65 80 (51.0 %) 47 (58.8 %) 33 (41.3 %) 47 (58.8 %) 33 (41.3 %) 49 (61.2 %) 31 (38.8 %) 47 (58.8 %) 32 (40.0 %) 47 (58.8 %) 33 (41.3 %) 47 (58.8 %) 33 (41.3 %)
≥65 77 (49.0 %) 32 (41.6 %) 45 (58.4 %) 32 (41.6 %) 45 (58.4 %) 30 (39.0 %) 47 (61.0 %) 32 (41.6 %) 46 (59.7 %) 32 (41.6 %) 45 (58.4 %) 32 (41.6 %) 45 (58.4 %)
CLEC1B CRHBP FCN2 MT1G TBCE
High Low High Low High Low High Low High Low
Gender 157 P= 0.003 P= 0.019 P= 0.043 P= 0.003 P= 0.019
Female 62 (39.5 %) 22 (35.5 %) 40 (64.5 %) 24 (38.7 %) 38 (61.3 %) 25 (61.0 %) 37 (39.0 %) 22 (35.5 %) 40 (64.5 %) 24 (38.7 %) 38 (61.3 %)
Male 95 (60.5 %) 57 (60.0 %) 38 (40.0 %) 55 (57.9 %) 40 (42.1 %) 54 (56.8 %) 41 (43.2 %) 57 (60.0 %) 38 (40.0 %) 55 (57.9 %) 40 (42.1 %)
a
Age was dichotomised into < 65 and≥65 using the median as a cutoff. PT, AJCC Tumour Pathologic PT. Expression values of a gene were dichotomised into high and low expression using the median as a cutoff. P value determined using Pearson’sχ2
test (2-sided)
of
Experimental
&
Clinical
Cancer
Research
(2016) 35:127
Page
10
of
by RT-qPCR (Fig. 2a). Seven of the 27 genes (UBE2C,
PTTG1, CAP2,TOP2A, GPC3, EGR1, and NAT2) have
been well studied in HCC (Table 1). For example, GPC3 plays critical roles in cell proliferation and inva-sion through the induction of apoptosis [28] and is a biomarker for diagnosis [29] and recurrence [30]. Pro-tein/gene-protein/gene interaction analyses indicated that these 27 proteins/genes strongly interacted with each other, and 10 of them interacted with at least half of all the genes (Additional file 2: Figure S2). Moreover, six of these genes were related to the cell cycle in HCC (Additional file 1: Table S1). Together, these results indicate that the genes identified in this study might play crucial roles in HCC progression, probably function-ing as a group.
Biomarkers not only have prognostic implications, but are also helpful for measurement of treatment responses and surveillance for tumour recurrence and for guiding clinical decisions [31]. Thus, prognostic biomarkers for HCC patients are necessary and crucial, and there is an ongoing search for predictive biomarkers. In this study, a group of genes associated with DFS and OS (Table 2) were identified in 157 HCC patients. Among these genes, low expression of ACSM3 and CXCL14 was associated with poor DFS, low expression of CRHBP,
DNASE1L3, FCN2, MT1X, and VIPR1 was associated
with poor OS (Fig. 3, Table 2), high expression of INTS8was associated with poor DFS and OS, and low expression ofLCAT,MARCO, andPAMR1was associated with poor DFS and OS (Fig. 4, Table 2). Furthermore, DNASE1L3andINTS8were identified as independent risk prognostic factors for OS (Table 3). There are few reports of the association of these genes with prognosis in HCC or in other cancers. Previous studies indicate that
downregulation ofCXCL14is associated with prognosis in gastric cancer patients [32], MT1X may aid in the prognostic discrimination of oral squamous cell carcin-oma cases [33], and MARCO expression is associated with breast cancer survival and risk of recurrence [34].
Twenty genes that have been less studied in HCC (Table 1) were further evaluated to predict their poten-tial roles in HCC progression. Coremine medical mining suggested that most of those genes were associated with
Fig. 5Association of the genes with HCC characteristics was determined by text mining using Coremine Medical and probabilistic scoring (P< 0.05). HCC: hepatocellular carcinoma, DR: drug resistance
diagnosis, prognosis, drug resistance, recurrence, metas-tasis, and invasiveness. In particular, 13, 14, and 15 genes were potentially associated with prognosis, metastasis, and diagnosis in HCC, respectively (Fig. 5). The associ-ation of these genes with prognosis appears to have clinical importance, as 11 genes were shown to be asso-ciated with DFS or/and OS (Table 2, Fig. 3 & 4). The role of these genes in metastasis was further confirmed by gene expression analysis, which showed that five genes were significantly dysregulated in HCC with ven-ous metastasis, portal vein tumour thrombus metastasis, or intrahepatic spread metastasis, compared with the appropriate controls. Specifically, LCAT was highly expressed in HCC patients with venous metastasis and patients with portal vein tumour thrombus metastasis, and SRPX was lowly expressed in HCC patients with venous metastasis and patients with intrahepatic spread metastasis (Fig. 6), suggesting that these two genes might be closely related to HCC metastasis. There are few studies on LCAT and SRPX in cancer metastasis, with only one reported thatSRPXis upregulated in gastric cancer cells after depletion of TWIST, which promoted the epithelial-mesenchymal transition that occurs during the initial steps of tumour metastasis [35].
INTS8 encodes a subunit of the integrator complex that is involved in the cleavage of small nuclear RNAs, and its association with cancer is poorly understood. Limited studies indicate thatINTS8contains mutations in peripheral T cell lymphoma compared with non-malignant samples from 12 patients [36], and a combin-ation of INTS8 with SULF1, ATP6V1C1, and GPR172A can be used to discriminate gastric carcinomas from adja-cent noncancerous tissues [37]. In this study, we found that, potentially regulated by demethylation (Fig. 7), INTS8 was significantly and consistently upregulated at least 2.115-fold in HCC according to four independent microarrays (Fig. 1; Table 1) and that INTS8mRNA was upregulated 2.06-fold on average in 11 tissues of HCC patients compared with corresponding paracancerous tis-sues, with a similar expression profile at the protein level (Fig. 2). Based on the clinical importance analysis of 157 HCC patients in a TCGA cohort, we found that high expression of INTS8 was associated with poor DFS and OS (Fig. 4, Table 2), and was an independent risk prognos-tic factor for OS (Table 3). Moreover, high expression of INTS8 was associated with metastatic tumours and late stage (Table 4), and with younger HCC patients (<65 years old) (Table 4). In addition, text mining indicated that
INTS8 was closely related with metastasis, invasiveness, and diagnosis (Fig. 5). The above results strongly indicate that this gene is indeed upregulated in HCC, where it might play crucial roles in HCC cancer progression and development, and is a potential biomarker for diagnosis and, in particular, prognosis.
Conclusion
In summary, by means of data retrieved from six inde-pendent microarrays, RT-qPCR and western blotting detection in 11 pairs of tissues, clinical importance ana-lyses in a cohort of 157 patients, and bioinformatics analyses including biological process annotation, pro-tein interaction and text mining, we have identified a group of genes that are significantly dysregulated in HCC and might be associated with cancer progression, development, and, in particular, prognosis. These genes could be potential therapeutic targets for HCC treat-ment, and might be useful biomarkers for diagnosis and prognosis.
Additional files
Additional file 1: Table S1.Biological process and cellular component annotation of the 80 genes associated with HCC development and progression by DAVID online tool. (PDF 167 kb)
Additional file 2: Figure S2.Protein/gene-protein/gene interaction network of the 27 genes that were stably and consistently dysregulated in 386 cases of hepatocellular carcinoma compared with 327 cases of normal liver tissue according to the four independent microarrays retrieved from the Oncomine database. (PDF 306 kb)
Acknowledgements
None.
Funding
The present study was supported by the National Natural Science Foundation of China (grant nos. 81360448), the Natural Science Foundation of Guangxi (nos. 2014GXNSFAA118139), Key Laboratory of High-Incidence-Tumor Prevention and Treatment (Guangxi Medical University), Ministry of Education (nos. GK2015-ZZ03 and GK2014-ZZ03) and Guangxi Outstanding Teachers Training Project for Colleges.
Availability of data and materials
None.
Authors’contributions
FY and XL performed most analysis. FY wrote the manuscript. LS provided the clinical samples. TL performed the RT-qPCR and western blotting. TP helped collect samples and revise manuscript. YN and SL performed mRNA and protein isolation. XZ and XQ designed the study and helped draft manuscript. All authors reviewed the manuscript. All authors read and approved the final manuscript.
Competing interests
The authors declare that they have no competing interests.
Consent for publication
None.
Ethics approval and consent to participate
The study was endorsed by the Ethics Committee of Guangxi Medical University and was performed according to the Declaration of Helsinki, 2013
edition. All patients received an explanation of the aims of the study and signed informed consent. We are free to use ovarian cancer data in TCGA by meeting its freedom-to-publish criteria: A marker paper has been published on that tumour type.
Author details
1Medical Scientific Research Centre, Guangxi Medical University, 22
Shuangyong Rd, Nanning, Guangxi 530021, People’s Republic of China.2Key Laboratory of High-Incidence-Tumor Prevention and Treatment (Guangxi Medical University), Ministry of Education, 22 Shuangyong Rd, Nanning, Guangxi 530021, People’s Republic of China.3The First Affiliated Hospital,
Guangxi Medical University, 22 Shuangyong Rd, Nanning, Guangxi 530021, People’s Republic of China.4Centre for Translational Medicine, Guangxi
Medical University, 22 Shuangyong Rd, Nanning, Guangxi 530021, People’s Republic of China.5School of Public Health, Guangxi Medical University, 22
Shuangyong Rd, Nanning, Guangxi 530021, People’s Republic of China.
Received: 19 June 2016 Accepted: 9 August 2016
References
1. Yang JD, Roberts LR. Hepatocellular carcinoma: A global view. Nat Rev Gastroenterol Hepatol. 2010;7:448–58.
2. Miki D, Ochi H, Hayes CN, Aikata H, Chayama K. Hepatocellular carcinoma: towards personalized medicine. Cancer Sci. 2012;103:846–50.
3. Byam J, Renz J, Millis JM. Liver transplantation for hepatocellular carcinoma. Hepatobiliary Surg Nutri. 2013;2:22–30.
4. Singhal A, Jayaraman M, Dhanasekaran DN, Kohli V. Molecular and serum markers in hepatocellular carcinoma: predictive tools for prognosis and recurrence. Crit Rev Oncol Hematol. 2012;82:116–40.
5. Cancer Genome Atlas Research N, Weinstein JN, Collisson EA, Mills GB, Shaw KR, Ozenberger BA, et al. The Cancer Genome Atlas Pan-Cancer analysis project. Nat Genet. 2013;45:1113–20.
6. International Cancer Genome C, Hudson TJ, Anderson W, Artez A, Barker AD, Bell C, et al. International network of cancer genome projects. Nature. 2010;464:993–8.
7. Rustici G, Kolesnikov N, Brandizi M, Burdett T, Dylag M, Emam I, et al. ArrayExpress update–trends in database growth and links to data analysis tools. Nucleic Acids Res. 2013;41:D987–90.
8. Barrett T, Wilhite SE, Ledoux P, Evangelista C, Kim IF, Tomashevsky M, et al. NCBI GEO: archive for functional genomics data sets–update. Nucleic Acids Res. 2013;41:D991–5.
9. Rhodes DR, Yu J, Shanker K, Deshpande N, Varambally R, Ghosh D, et al. ONCOMINE: a cancer microarray database and integrated data-mining platform. Neoplasia. 2004;6:1–6.
10. Coordinators NR. Database resources of the National Center for Biotechnology Information. Nucleic Acids Res. 2015;43:D6–17.
11. Rung J, Brazma A. Reuse of public genome-wide gene expression data. Nat Rev Genet. 2013;14:89–99.
12. Kannan L, Ramos M, Re A, El-Hachem N, Safikhani Z, Gendoo DM, et al. Public data and open source tools for multi-assay genomic investigation of disease. Briefings in bioinformatics. 2016;17:603–15.
13. Liu X, Gao Y, Zhao B, Li X, Lu Y, Zhang J, et al. Discovery of microarray-identified genes associated with ovarian cancer progression. Int J Oncol. 2015;46:2467–78.
14. Liu X, Gao Y, Lu Y, Zhang J, Li L, Yin F. Downregulation of NEK11 is associated with drug resistance in ovarian cancer. Int J Oncol. 2014;45:1266–74. 15. Zeng X, Yin F, Liu X, Xu J, Xu Y, Huang J, et al. Upregulation of E2F
transcription factor 3 is associated with poor prognosis in hepatocellular carcinoma. Oncol Rep. 2014;31:1139–46.
16. Gao J, Aksoy BA, Dogrusoz U, Dresdner G, Gross B, Sumer SO, et al. Integrative analysis of complex cancer genomics and clinical profiles using the cBioPortal. Sci Signal. 2013;6:11.
17. Cerami E, Gao J, Dogrusoz U, Gross BE, Sumer SO, Aksoy BA, et al. The cBio cancer genomics portal: an open platform for exploring multidimensional cancer genomics data. Can Dis. 2012;2:401–4.
18. Budhu A, Forgues M, Ye QH, Jia HL, He P, Zanetti KA, et al. Prediction of venous metastases, recurrence, and prognosis in hepatocellular carcinoma based on a unique immune response signature of the liver
19. Ye QH, Qin LX, Forgues M, He P, Kim JW, Peng AC, et al. Predicting hepatitis B virus-positive metastatic hepatocellular carcinomas using gene expression profiling and supervised machine learning. Nat Med. 2003;9:416–23. 20. da Huang W, Sherman BT, Lempicki RA. Systematic and integrative
analysis of large gene lists using DAVID bioinformatics resources. Nat Protoc. 2009;4:44–57.
21. da Huang W, Sherman BT, Lempicki RA. Bioinformatics enrichment tools: paths toward the comprehensive functional analysis of large gene lists. Nucleic Acids Res. 2009;37:1–13.
22. Mostafavi S, Ray D, Warde-Farley D, Grouios C, Morris Q. GeneMANIA: a real-time multiple association network integration algorithm for predicting gene function. Genome Biol. 2008;9 Suppl 1:S4.
23. Zuberi K, Franz M, Rodriguez H, Montojo J, Lopes CT, Bader GD, et al. GeneMANIA prediction server 2013 update. Nucleic Acids Res. 2013;41: W115–22.
24. de Leeuw N, Dijkhuizen T, Hehir-Kwa JY, Carter NP, Feuk L, Firth HV, et al. Diagnostic interpretation of array data using public databases and internet sources. Hum Mutat. 2012;33:930–40.
25. Hedditch EL, Gao B, Russell AJ, Lu Y, Emmanuel C, Beesley J, et al. ABCA transporter gene expression and poor outcome in epithelial ovarian cancer. J Natl’Cancer Institute. 2014; 106
26. D’Andrilli G, Kumar C, Scambia G, Giordano A. Cell cycle genes in ovarian cancer: steps toward earlier diagnosis and novel therapies. Clin Cancer Res. 2004;10:8132–41.
27. Lee N, Kwon JH, Kim YB, Kim SH, Park SJ, Xu W, et al. Vaccinia-related kinase 1 promotes hepatocellular carcinoma by controlling the levels of cell cycle regulators associated with G1/S transition. Oncotarget. 2015;6:30130–48. 28. Pan Z, Chen C, Long H, Lei C, Tang G, Li L, et al. Overexpression of GPC3
inhibits hepatocellular carcinoma cell proliferation and invasion through induction of apoptosis. Mol Med Rep. 2013;7:969–74.
29. Yu JP, Xu XG, Ma RJ, Qin SN, Wang CR, Wang XB, et al. Development of a Clinical Chemiluminescent Immunoassay for Serum GPC3 and Simultaneous Measurements Alone With AFP and CK19 in Diagnosis of Hepatocellular Carcinoma. J Clin Lab Anal. 2015;29:85–93.
30. Wang Y, Shen Z, Zhu Z, Han R, Huai M. Clinical values of AFP, GPC3 mRNA in peripheral blood for prediction of hepatocellular carcinoma recurrence following OLT: AFP, GPC3 mRNA for prediction of HCC. Hepat Mon. 2011;11:195–9.
31. Wong KF, Xu Z, Chen J, Lee NP, Luk JM. Circulating markers for prognosis of hepatocellular carcinoma. Expert Opinion Med Diagnos. 2013;7:319–29. 32. Hu C, Lin F, Zhu G, Xue X, Ding Y, Zhao Z, et al. Abnormal
hypermethylation of promoter region downregulates chemokine CXC ligand 14 expression in gastric cancer. Int J Oncol. 2013;43:1487–94. 33. Brazao-Silva MT, Rodrigues MF, Eisenberg AL, Dias FL, de Castro LM, Nunes
FD, Faria PR, Cardoso SV, Loyola AM, de Sousa SCOM. Metallothionein gene expression is altered in oral cancer and may predict metastasis and patient outcomes. Histopathology. 2015;67:358–67.
34. Bergamaschi A, Tagliabue E, Sorlie T, Naume B, Triulzi T, Orlandi R, Russnes HG, Nesland JM, Tammi R, Auvinen P, Kosma V-M, Ménard S, Børresen-Dale A-L. Extracellular matrix signature identifies breast cancer subgroups with different clinical outcome. J Pathol. 2008;214:357–67.
35. Feng MY, Wang K, Shi QT, Yu XW, Geng JS. Gene expression profiling in TWIST-depleted gastric cancer cells. Anat Rec. 2009;292:262–70.
36. Simpson HM, Khan RZ, Song C, Sharma D, Sadashivaiah K, Furusawa A, Liu X, Nagaraj S, Sengamalay N, Sadzewicz L, Luke J. Concurrent Mutations in ATM and Genes Associated with Common gamma Chain Signaling in Peripheral T Cell Lymphoma. PLoS One. 2015;10:e0141906.
37. Cheng L, Zhang Q, Yang S, Yang Y, Zhang W, Gao H, Deng X, Zhang Q. A 4-gene panel as a marker at chromosome 8q in Asian gastric cancer patients. Genomics. 2013;102:323–30.
38. Kim HE, Kim DG, Lee KJ, Son JG, Song MY, Park YM, et al. Frequent amplification of CENPF, GMNN and CDK13 genes in hepatocellular carcinomas. PLoS One. 2012;7:e43223.
39. Ieta K, Ojima E, Tanaka F, Nakamura Y, Haraguchi N, Mimori K, et al. Identification of overexpressed genes in hepatocellular carcinoma, with special reference to ubiquitin-conjugating enzyme E2C gene expression. Int J Cancer. 2007;121:33–8.
40. Fujii T, Nomoto S, Koshikawa K, Yatabe Y, Teshigawara O, Mori T, et al. Overexpression of pituitary tumor transforming gene 1 in HCC is associated with angiogenesis and poor prognosis. Hepatology. 2006;43:1267–75.
41. Su MC, Hsu HC, Liu YJ, Jeng YM. Overexpression of pituitary tumor-transforming gene-1 in hepatocellular carcinoma. Hepatogastroenterology. 2006;53:262–5.
42. Liang M, Chen X, Liu W, Li S, Li C, Jiang L, et al. Role of the pituitary tumor transforming gene 1 in the progression of hepatocellular carcinoma. Cancer Biol Ther. 2011;11:337–45.
43. Shibata R, Mori T, Du W, Chuma M, Gotoh M, Shimazu M, et al. Overexpression of cyclase-associated protein 2 in multistage hepatocarcinogenesis. Clin Cancer Res. 2006;12:5363–8.
44. Sakamoto M, Mori T, Masugi Y, Effendi K, Rie I, Du W. Candidate molecular markers for histological diagnosis of early hepatocellular carcinoma. Intervirology. 2008;51 Suppl 1:42–5.
45. Wong N, Yeo W, Wong WL, Wong NL, Chan KY, Mo FK, et al. TOP2A overexpression in hepatocellular carcinoma correlates with early age onset, shorter patients survival and chemoresistance. Int J Cancer. 2009;124:644–52.
46. Ho DW, Kai AK, Ng IO. TCGA whole-transcriptome sequencing data reveals significantly dysregulated genes and signaling pathways in hepatocellular carcinoma. Frontiers Med. 2015;9:322–30.
47. Lu DD, Chen YC, Zhang XR, Cao XR, Jiang HY, Yao L. The relationship between metallothionein-1F (MT1F) gene and hepatocellular carcinoma. Yale J Biol Med. 2003;76:55–62.
48. Tahara D, Nakanishi T, Akazawa S, Yamaguchi Y, Yamamoto H, Akashi M, et al. Lecithin-cholesterol acyltransferase and lipid transfer protein activities in liver disease. Metabolism. 1993;42:19–23.
49. Gui T, Dong X, Li R, Li Y, Wang Z. Identification of hepatocellular carcinoma-related genes with a machine learning and network analysis. J
Computational Biol. 2015;22:63–71.
50. Lin ZY, Chuang WL. Genes responsible for the characteristics of primary cultured invasive phenotype hepatocellular carcinoma cells. Biomed Pharmacother. 2012;66:454–8.
51. Udali S, Guarini P, Ruzzenente A, Ferrarini A, Guglielmi A, Lotto V, et al. DNA methylation and gene expression profiles show novel regulatory pathways in hepatocellular carcinoma. Clin Epigen. 2015;7:43.
52. Zhou X, Zhu HQ, Lu J. Regulation of gene expression in HBV- and HCV-related hepatocellular carcinoma: integrated GWRS and GWGS analyses. Int J Clin Experimental Med. 2014;7:4038–50.
53. Hoang TV, Toan NL, le Song H, Ouf EA, Bock CT, Kremsner PG, et al. Ficolin-2 levels and FCNFicolin-2 haplotypes influence hepatitis B infection outcome in Vietnamese patients. PLoS One. 2011;6:e28113.
54. Sun H, Chua MS, Yang D, Tsalenko A, Peter BJ, So S. Antibody Arrays Identify Potential Diagnostic Markers of Hepatocellular Carcinoma. Biomark Insights. 2008;3:1–18.
55. Gu X, Wang H, Wang A, Dou T, Qi P, Ji Q, et al. An intronic polymorphism rs2237062 in the CXCL14 gene influences HBV-related HCC progression in Chinese population. Mol Biol Rep. 2012;39:797–803.
56. Wang W, Huang P, Zhang L, Wei J, Xie Q, Sun Q, et al. Antitumor efficacy of C-X-C motif chemokine ligand 14 in hepatocellular carcinoma in vitro and in vivo. Cancer Sci. 2013;104:1523–31.
57. Kanda M, Nomoto S, Okamura Y, Nishikawa Y, Sugimoto H, Kanazumi N, et al. Detection of metallothionein 1G as a methylated tumor suppressor gene in human hepatocellular carcinoma using a novel method of double combination array analysis. Int J Oncol. 2009;35:477–83.
58. Ji XF, Fan YC, Gao S, Yang Y, Zhang JJ, Wang K. MT1M and MT1G promoter methylation as biomarkers for hepatocellular carcinoma. World
JGastroenterol. 2014;20:4723–9.
59. Lu D, Han C, Wu T. Microsomal prostaglandin E synthase-1 promotes hepatocarcinogenesis through activation of a novel EGR1/beta-catenin signaling axis. Oncogene. 2012;31:842–57.
60. Agundez JA, Olivera M, Ladero JM, Rodriguez-Lescure A, Ledesma MC, Diaz-Rubio M, et al. Increased risk for hepatocellular carcinoma in NAT2-slow acetylators and CYP2D6-rapid metabolizers. Pharmacogenetics. 1996;6:501–12.