Iranian Rehabilitation Journal, Vol. 11, No. 18, October 2013
Original Article
Knee Kinematic Improvement after Total Knee Replacement Using a
Simplified Quantitative Gait Analysis Method
Hassan Sarailoo
1; Mohammadreza Mallakzadeh
Iran University of Science and Technology, Tehran, Iran
Objective: The aim of this study was to extract suitable spatiotemporal and kinematic parameters to determine how Total Knee Replacement (TKR) alters patients’ knee kinematics during gait, using a rapid and simplified quantitative two-dimensional gait analysis procedure.
Methods: Two-dimensional kinematic gait pattern of 10 participants were collected before and after the TKR surgery, using a 60 Hz camcorder in sagittal plane. Then, the kinematic parameters were extracted using the gait data. A student t-test was used to compare the group-average of spatiotemporal and peak kinematic characteristics in the sagittal plane. The knee condition was also evaluated using the Oxford Knee Score (OKS) Questionnaire to ensure that each subject was placed in the right group.
Results: The results showed a significant improvement in knee flexion during stance and swing phases after TKR surgery. The walking speed was increased as a result of stride length and cadence improvement, but this increment was not statistically significant. Both post-TKR and control groups showed an increment in spatiotemporal and peak kinematic characteristics between comfortable and fast walking speeds.
Conclusion: The objective kinematic parameters extracted from 2D gait data were able to show significant improvements of the knee joint after TKR surgery. The patients with TKR surgery were also able to improve their knee kinematics during fast walking speed equal to the control group. These results provide a good insight into the capabilities of the presented method to evaluate knee functionality before and after TKR surgery and to define a more effective rehabilitation program.
Keywords: Gait analysis, TKR surgery, Knee kinematics, Rehabilitation, Objective parameters
Submitted: 25 April 2013 Accepted: 17 Aug. 2013
Introduction
Total knee replacement (TKR) is commonly performed in patients with severe knee osteoarthritis to improve patients’ functional capabilities (1, 2) and to reduce pain and is usually associated by a high satisfaction rate (3). Over the past decade, the number of TKR surgeries has increased considerably (4), while there is a noticeable decrease in the average age of recipients undergoing TKR surgery (5). The increase in the number of younger recipients of TKR warrants the need for more objective measures to evaluate knee functionality. The results of these evaluations can also be applied to rehabilitation programs of younger patients. A common way to assess the improvements in a post-TKR subject is the use of subjective measures, which have limited sensitivity and mainly reflect the
pain reduction following TKR surgery (6). In more recent studies, researchers tried to improve knee functionality using an accelerated rehabilitation method, which reduced the average time of hospitalization after surgery from 10.5 to 3.6 days (7). In another study the rehabilitation process of a group of TKR patients was improved using visual feedback and enhanced communication (8). Both procedures were based on subjective feedback. Other studies have reported walking velocity (9), knee range of motion (10), functional tests such as 6-minute walk, timed-up-and-go and stair climbing tests (11) for post-TKR subjects.
method is that the knee flexion of post-TKR patients is less than their control counterparts (12, 13). In a more recent study, three-dimensional motion analysis was used to compare spatiotemporal and peak kinematic characteristics between post-TKR and control groups at comfortable and fast walking speeds (14). Their results showed that the post-TKR patients were able to increase their velocity, cadence and stride length by a similar proportion equal to the control ones during the fast walking speed condition. It also showed that at a faster walking speed the kinematic parameters such as maximum knee flexion during stance and swing were altered in a similar manner for both post-TKR and control groups. Consequently they showed the potential of post-TKR patients in restoring their knee range of motion (15). They used kinetic data in addition to kinematic data to investigate the effect of TKR surgery on knee functionality.
Three-dimensional motion analysis is a relatively accurate and reliable method to examine knee functionality in different gait situations, however it is a very time consuming and costly method. Therefore, the aim of this study was to investigate the possibility of extracting reliable objective parameters by using a simplified and rapid two-dimensional gait analysis method for patients following TKR surgery, which only needs preliminary equipment, namely a 60Hz camcorder, three reflective markers and an open source image processing software (16). These results can provide a good insight into the capabilities of the presented method to evaluate knee functionality before and after the TKR surgery and to define a more effective rehabilitation program for the post-TKR patients.
Methods
Participants - The average age of patients
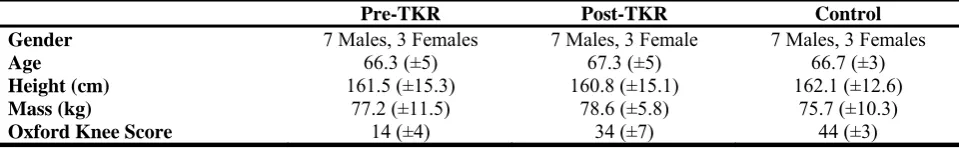
undergoing TKR surgery was between 60 to 70 years and both male and female participants were included (1). So, in this study this age range was one of the inclusion criteria for participation, regardless of their gender. Although hip and ankle joint replacements are common in patients who have had TKR surgery (4), these patients were excluded because these surgeries may alter the lower limb kinematics compared to TKR. Therefore all 23 patients who had undergone TKR surgery by a single experienced knee surgeon at the orthopedic department of Tehran’s ‘Akhtar hospital’ between October and December of 2011 were checked for eligibility to take part in this study. Nineteen of these patients used a specific type of fixed bearing implant. Five of them were excluded from this study because they had an Oxford Knee Score (OKS) lower than 10. Two of the remaining 14 eligible participants had an operation on the contralateral knee, which could have major effects on gait patterns. So, the remaining 12 patients were selected to participate in this study. Two of the selected participants in the pre-TKR group, refused to cooperate during the 1 year follow-up. Therefore the remaining 10 patients comprised the post-TKR group. The TKR participants underwent post-operative rehabilitation treatment for three months (17) after their surgery to regain their knee functionality. The control group was chosen in a way to match the sex, age and BMI of the pre-TKR and post-TKR populations with an OKS in the range of 40 to 48, which shows a well knee condition. Prior to any tests, all subjects were informed of the experimental risks and signed a consent form. The clinical data of the included subjects are given in detail in Table (1). The OKS of participants was determined using a validated questionnaire (18).
Table 1. Clinical characteristics of the included subjects
Pre-TKR Post-TKR Control
Gender 7 Males, 3 Females 7 Males, 3 Female 7 Males, 3 Females
Age 66.3 (±5) 67.3 (±5) 66.7 (±3)
Height (cm) 161.5 (±15.3) 160.8 (±15.1) 162.1 (±12.6)
Mass (kg) 77.2 (±11.5) 78.6 (±5.8) 75.7 (±10.3)
Oxford Knee Score 14 (±4) 34 (±7) 44 (±3)
Equipment - A digital camcorder was used to record
the motion in sagittal plane at a sampling rate of 60 Hz. The camcorder was fixed on a camera base to prevent any disturbance of lens vibration. Three 14mm diameter reflective semi-spherical markers were placed unilaterally on the greater trochanter,
Figure 1. Gait analysis of a full gait cycle with three reflective markers (post-TKR subject)
Gait analysis protocol - The main advantage of
two-dimensional motion analysis using image processing tools is the ability to perform tests in any indoor environment. All tests took place in ‘Akhtar hospital’s rehabilitation center. Each participant attended the rehabilitation center for a single 30-minutes session.
Motion data was recorded over a 7-meter walkway. Before each test, participants were asked to walk along the walkway for several times to adapt to the test environment and to acquire a consistent self-selected walking speed. Three 14mm diameter reflective semi-spherical markers were placed unilaterally on the greater trochanter, lateral femoral epicondyle and lateral malleolus of the affected limb. Data was collected over eight valid trials for each participant. The subjects were not aware that the stride in the middle of the walkway would be used for data analysis. For the post-TKR and control groups, the gait tests were carried out for both comfortable and fast walking speeds. The fast walking speed test was restricted to “as fast as possible but not running” condition.
During the tests, the participants were told to keep their hands close to their chests to make the hip marker observable by the camera lens all the time. This condition definitely has some influence on the gait pattern; however it would not affect the comparative findings because it was applied to all tests.
Data analysis - After recording the motion in
sagittal plane, the markers’ spatial positions were extracted using Kinovea, an open source image processing software package (16). Before this step, each video was trimmed to cover a complete gait cycle, which started with the initial contact and ended with the following initial contact of the same foot. A linear line-based method, which is quite
simple and fast and leads to results with acceptable accuracy (19), was used to calibrate the recorded videos. In this method, a video is calibrated by using the known length of two lines between three points. In this study, the distance between the hip and knee markers, and the knee and ankle markers were used to calibrate each video. This method cannot handle the lens distortion problem, but the accuracy of the results can be improved when gait data are extracted from the central area of a recorded frame. Then, knee flexion during a gait cycle was calculated and presented as a graph, which was normalized in the range of 0 to 100 percent of a gait cycle period using Matlab Software. To reduce the effect of noise in the recorded data, a 2nd order Butterworth low-pass filter was used with a cut-off frequency of 10Hz for the hip marker and 3Hz for the ankle and knee joint markers. Walking velocity, stride length and cadence were extracted directly from the trimmed and calibrated videos using Kinovea software and the peak kinematic parameters were extracted from the knee flexion diagram over a full gait cycle. For each subject and walking condition, eight gait cycles were considered. Then the knee flexion diagrams for all eight trials were plotted against the gait cycle percent from 0 to 100% in 2% steps. To obtain the gait curve reliability for each subject and walking condition, the following steps were performed:
1. Computation of
R-value =
( 1)
MST MSE
MST r MSE
where MST is
between-time mean square and MSE is within-time mean square
Where R is the proportion of variance due to the
time-to-time variability in the total variance; and an
R-value close to 1 indicates an acceptable reliability.
In this repetitive procedure, a minimum value of
Rm=0.85 with at least three trials was used (20). Then the data points from the reliable trials were combined to form the average curve for each subject and walking condition. Individual mean values for these data were combined and averaged to provide group mean values for each cohort. An independent impaired student’s t-test was used for differences in comparisons between experimental conditions of pre and post-TKR groups. The level of significance was set at p < 0.05, and for all comparisons the exact p
value was reported in each case.
Results
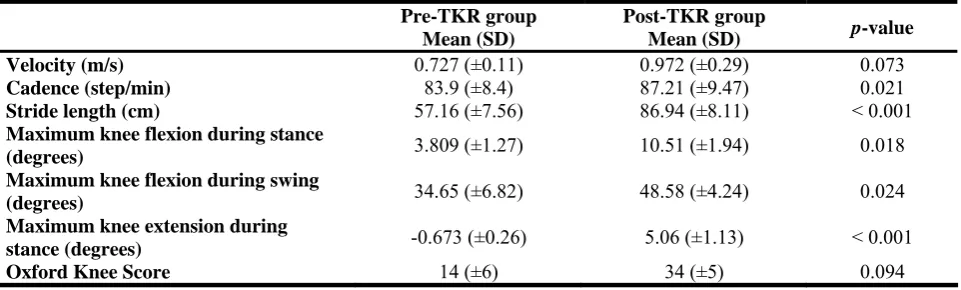
Comparison between pre-TKR and post-TKR groups - Table (2) summarizes the spatiotemporal and
kinematic data for pre-TKR and post-TKR groups at comfortable walking speed. In this diagram, for each data point, an error bar shows the 95% confidence interval indicating the inter-trial and intra-trial errors. Table 2 shows a notable increment in all extracted spatiotemporal parameters in the post-TKR patients in comparison with their impaired pre-TKR ones. Pre-TKR population walked with a reduced stride length (p < 0.001) and cadence (p = 0.021).
The walking speed increased in the post-TKR group by 33.7%, but it was not statistically significant (p =
0.073). For the kinematic parameters, the pre-TKR group walked with less knee flexion during stance (p
= 0.018) and swing (p = 0.024) phases and knee
extension increased in the post-TKR group during stance phase (p < 0.001). The OKS increased
noticeably for the post-TKR group but this parameter was not statistically significant.
Table 2. Spatiotemporal and kinematic comparisons between pre-TKR and post-TKR groups at comfortable walking speed
Pre-TKR group Mean (SD)
Post-TKR group
Mean (SD) p-value
Velocity (m/s) 0.727 (±0.11) 0.972 (±0.29) 0.073
Cadence (step/min) 83.9 (±8.4) 87.21 (±9.47) 0.021
Stride length (cm) 57.16 (±7.56) 86.94 (±8.11) < 0.001 Maximum knee flexion during stance
(degrees) 3.809 (±1.27) 10.51 (±1.94) 0.018
Maximum knee flexion during swing
(degrees) 34.65 (±6.82) 48.58 (±4.24) 0.024
Maximum knee extension during
stance (degrees) -0.673 (±0.26) 5.06 (±1.13) < 0.001
Oxford Knee Score 14 (±6) 34 (±5) 0.094
Comparison between post-TKR and control groups
Table (3) and Table (4) summarize the spatiotemporal and kinematic data for the post-TKR and control groups during comfortable and fast walking speeds, respectively. Sagittal knee flexion angle throughout the gait cycle for both groups under both walking speeds are illustrated in Figure 3. In this diagram, for each data point, an error bar shows the 95% confidence interval, indicating the inter-trial and intra-trial errors. The post-TKR group walked with a reduced stride length (p = 0.004 for
comfortable and p = 0.029 for fast speed) and
cadence (p < 0.001 for both speeds) at both walking
speeds. They also walked with less knee flexion during swing (p = 0.029 for comfortable and p <
0.001 for fast speeds) and stance (p = 0.036 for
comfortable and p = 0.027 for fast speeds) phases.
Table 3. Spatiotemporal and kinematic comparisons between post-TKR and control groups at comfortable walking speed
Post-TKR group Mean (SD)
Control group
Mean (SD) -value
Velocity (m/s) 0.972 (±0.29) 1.248 (±0.18) 0.036
Cadence (step/m) 87.21 (±9.47) 104.53 (±7.41) < 0.001
Stride length (cm) 86.94 (±8.11) 96.28 (±5.88) 0.004
Maximum knee flexion during stance
(degrees) 10.51 (±1.94) 15.61 (±2.74)
Maximum knee flexion during swing
(degrees) 48.58 (±4.24) 59.86 (±7.56)
Maximum knee extension during
stance (degrees) 5.06 (±1.13) 10.36 (±2.75)
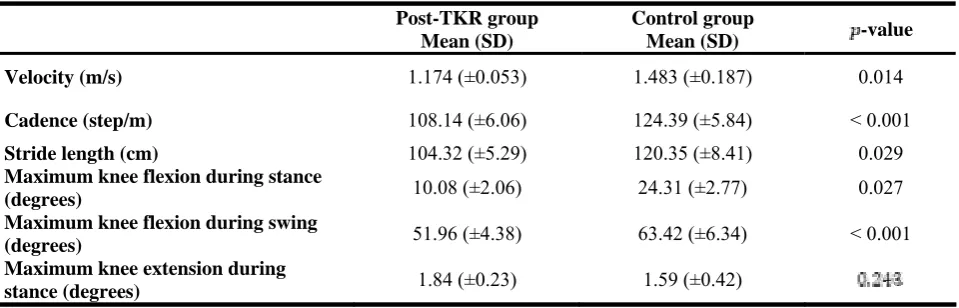
In a comparison between two walking speeds, post-TKR patients increased their stride length by 20% and their cadence by 24% in the fast walking speed condition. Therefore, their velocity during fast walking speed was 20.8% faster than the comfortable condition. For the control group, an 18.9% increment in their walking speed occurred due to 25% and 19% increment in stride length and cadence, respectively. Walking speed also affected the sagittal plane knee kinematics of the post-TKR group. The peak knee flexion during stance phase
was 10.51±1.94o in the post-TKR group and 10.61±2.74o in the control group. This parameter increased by 55% to 24.31±2.77o in the control group, but no significant change was observed in the post-TKR patients. The peak knee flexion during swing was 48.58±4.24o in the post-TKR group and 56.86±7.56o in the control group. This parameter increased by 9% to 51.96±4.38o in the post-TKR
group and 6% to 63.42±6.34o in the control group.
Table 4. Spatiotemporal and kinematic comparisons between post-TKR and control groups at fast walking speed
Post-TKR group Mean (SD)
Control group
Mean (SD) -value
Velocity (m/s) 1.174 (±0.053) 1.483 (±0.187) 0.014
Cadence (step/m) 108.14 (±6.06) 124.39 (±5.84) < 0.001
Stride length (cm) 104.32 (±5.29) 120.35 (±8.41) 0.029
Maximum knee flexion during stance
(degrees) 10.08 (±2.06) 24.31 (±2.77) 0.027
Maximum knee flexion during swing
(degrees) 51.96 (±4.38) 63.42 (±6.34) < 0.001
Maximum knee extension during
stance (degrees) 1.84 (±0.23) 1.59 (±0.42)
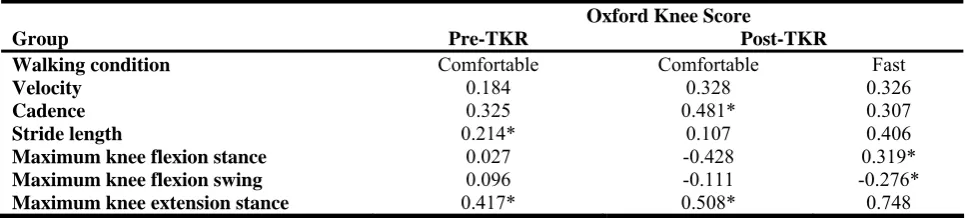
Correlations between objective gait parameters and subjective score - The correlations between
subjective OKS and objective gait parameters for pre and post-surgery groups in both walking conditions are presented in Table (5). There is a moderate correlation (0.4 < r < 0.6) for maximum knee
extension during stance in pre-TKR group (p <
0.05). In post-TKR patients at comfortable walking speed cadence, maximum knee flexion and
extension during stance have a moderate correlation with the subjective OKS; but at fast walking speeds, there is moderate and high (0.6 < r < 0.8) correlation
Table 5: Correlations between Oxford Knee Scores and gait parameters for pre and post-surgery groups and both walking conditions
Oxford Knee Score
Group Pre-TKR Post-TKR
Walking condition Comfortable Comfortable Fast
Velocity 0.184 0.328 0.326
Cadence 0.325 0.481* 0.307
Stride length 0.214* 0.107 0.406
Maximum knee flexion stance 0.027 -0.428 0.319*
Maximum knee flexion swing 0.096 -0.111 -0.276*
Maximum knee extension stance 0.417* 0.508* 0.748
*
Statistically significant results (p < 0.05)
Discussion
In this study, objective spatiotemporal and kinematic parameters for the gait of pre-TKR, post-TKR and control cohorts were extracted using a rapid and simplified quantitative two-dimensional gait analysis method. Outcome measures such as Oxford Knee Score and walking velocity were improved in the post-TKR group, similar to the findings of earlier studies (9, 10). A review of 12 papers reported that the self-selected walking speed for pre-TKR patients was in the range of 0.58 m/s to 1.13 m/s with a mean value of 0.93 m/s (21). In this paper, a mean value of 0.97 m/s was acquired for the walking speed of pre-TKR patients in a comfortable walking condition. Subject to the kinematic parameters, the knee flexion increased significantly for the post-TKR group during stance and swing phases. For the pre-TKR group, the stance phase proportion was about 30% of the gait cycle, which reduced to about 20% for the post-TKR patients. A similar result was reported in (15). The pre-TKR population also walked with a faster swing phase than the post-TKR group, resulting in a 34% reduction in stride length. In a comparison between post-TKR and control groups, there were significant differences in knee kinematics at both comfortable and fast walking speeds, which indicates that the knee kinematics was not restored to normal completely following TKR surgery. The post-TKR group walked with a reduced knee flexion during the stance and swing phases of gait in the sagittal plane. Other studies have reported such results too(10, 12), but comparing these groups at fast walking speed was studied only in one research (14), which yielded similar results to our study’s. In (14), they used a full three-dimensional motion analysis using eight infrared cameras and two force plates. Their results showed that the post-TKR patients could increase their walking speed in the same order of their controls. The average range of motion during stance phase increased by 42% in
the post-TKRs and by 29% in the controls at fast walking speed. In this paper, a rapid and simplified two-dimensional analysis method with the aid of a camcorder and an image processing software package (16) was used to extract knee kinematic parameters. The results showed a 20.8% increment in the post-TKR walking speed in the fast walking condition. This increment was 18.9% in the controls. The post-TKR patients were also able to increase their range of motion during stance phase by 52%. Knee extension during stance is important in the provision of stability during propulsion. In (22), the authors stated that following TKR the patients may tend to walk with less extension in their knees than the healthy individuals but our results for this parameter showed more extension in the post-TKR group than in the control ones. Therefore, one may say that some of the control group participants had some difficulty walking. This finding may also be limited by the small sample size used in this study and/or the differences between the rehabilitation treatments used in these two studies.
The correlation between objective gait parameters and subjective Oxford knee score was also studied in this paper. Other researchers reported a low or moderate correlation between these data (23). Our results showed that OKS was not highly correlated with knee kinematics. Therefore the subjective scores cannot be replaced by the objective parameters.
distortion, the strides of patients which occurred in the middle of the captured frames were used. The main sources of noise in this study were lens vibration, accuracy of the video calibration and vibration of the reflective markers installed with elastic bands. Therefore a 2nd order Butterworth filter, which is a sharp roll-off filter, was used to reduce the effects of noise. The results showed this filter was able to reduce the noise effect on the final outcomes efficiently.
Conclusions
In this study a rapid and simplified two-dimensional quantitative gait analysis method was employed to extract the objective kinematic parameters for TKR patients. The knee kinematic differences between pre and post-surgery groups were observable using the extracted parameters. Moreover, this method was able to reveal the kinematic differences between
comfortable and fast walking speeds for the post-TKR and control groups. In the presented method, the required equipment and the cost of data analysis were reduced drastically and the extracted parameters were able to assess the knee condition similar to the three-dimensional gait analysis method. Therefore, this method can be used by hospitals and small rehabilitation clinics with preliminary equipment to evaluate knee functionality before and after the TKR surgery and to define a more effective rehabilitation program for the post-surgery patients.
Acknowledgments
We wish to acknowledge the contribution of Akhtar hospital’s orthopedic department for participant assessment and preparation.
References
1. Ethgen O, Bruyere O, Richy F, Dardennes C, Reginster JY.
Health-related quality of life in total hip and total knee arthroplasty. A qualitative and systematic review of the literature. J Bone Joint Surg Am. 2004;86-A(5):963–74.
2. Franklin PD, Li W, Ayers DC. The Chitranjan Ranawat
Award: functional outcome after total knee replacement varies with patient attributes. Clin Orthop. 2008;466(11):2597–604.
3. Loughead JM, Malhan K, Mitchell SY, Pinder IM,
McCaskie AW, Deehan DJ, et al. Outcome following knee arthroplasty beyond 15 years. The Knee. 2008;15(2):85–90.
4. Jain NB, Higgins LD, Ozumba D, Guller U, Cronin M,
Pietrobon R, et al. Trends in epidemiology of knee arthroplasty in the United States, 1990-2000. Arthritis Rheum. 2005;52(12):3928–33.
5. Foster RR, Khalifa S. Total knee replacement rehabilitation.
Sports Med Arthr Rev. 1996;4(1):83–91.
6. Isaac D, Falode T, Liu P, I’Anson H, Dillow K, Gill P.
Accelerated rehabilitation after total knee replacement. The Knee. 2005;12(5):346–50.
7. Maurer B, Bergner F, Kober P, Baumgartner R. Improving
rehabilitation process after total knee replacement surgery through visual feedback and enhanced communication in a serious game. Proceedings of the 30th ACM international conference on Design of communication. ACM; 2012,pp:355–6.
8. Mandeville D, Osternig LR, Chou LS. The effect of total
knee replacement on dynamic support of the body during walking and stair ascent. Clin Biomech Bristol Avon. 2007;22(7):787–94.
9. Smith AJ, Lloyd DG, Wood DJ. A kinematic and kinetic