http://dx.doi.org/10.4236/sgre.2015.61001
Maximum Power Point Tracking Using Fuzzy
Logic Controller under Partial Conditions
Areen Abdallah Allataifeh
1, Khaled Bataineh
1, Mohammad Al-Khedher
21Department of Mechanical Engineering, Jordan University of Science and Technology, Irbid, Jordan 2Department of Mechanical Engineering, Applied University, Salt, Jordan
Email: [email protected]
Received 28 December 2014; accepted 10 January 2015; published 15 January 2015
Copyright © 2015 by authors and Scientific Research Publishing Inc.
This work is licensed under the Creative Commons Attribution International License (CC BY).
http://creativecommons.org/licenses/by/4.0/
Abstract
This study proposes a fuzzy system for tracking the maximum power point of a PV system for solar panel. The solar panel and maximum power point tracker have been modeled using MATLAB/Simu- link. A simulation model consists of PV panel, boost converter, and maximum power point tack MPPT algorithm is developed. Three different conditions are simulated: 1) Uniform irradiation; 2) Sudden changing; 3) Partial shading. Results showed that fuzzy controller successfully find MPP for all different weather conditions studied. FLC has excellent ability to track MPP in less than 0.01 second when PV is subjected to sudden changes and partial shading in irradiation.
Keywords
Fuzzy Logic Controller, Maximum Power Point, Photovoltaic System, Partial Shading
1. Introduction
power point (MPP) varies upon irradiance changes, thus a maximum power point tracking is necessary to main- tain the maximum power values [4]. The efficiency of PV plant depends on inverter efficiency, maximum power point tracking algorithm, and the efficiency of PV panel. The PV efficiency depends on cell fabrication, which does not exceed 15% [5]. Enhancing efficiency of PV panel and inverter are difficult due to technology and cost consideration. On the other hand, enhancing algorithms of maximum power point tack (MPPT) is inexpensive and can be implemented on existed PV system [6].
Many techniques to track maximum power point (MPP) have been proposed since earlier nineties. These me-thods differ in terms of requiring sensors, cost, efficiencies, complexity, and in convergence speed. Conven-tional algorithms, such as P & O, fail to reach the global maximum power point of PV system under partial shading conditions because of fixed step size [7]. Chao et al. proposed an extension method that uses a variable step size to ensure finding the global power point but the system takes long time to recover and reach the steady state under sudden changes [8]. Recently, Heydari-Doostabad et al. proposed a new approach based on Extre-mum Seeking Control (ESC) algorithm [9]. Although their proposed method found the global maximum point, it is considered highly complicated.
Intelligent systems, such as Neural Networks (NN) and Fuzzy Logic Controllers (FLC) have been used to track maximum power point of PV and to decrease computation requirement while increasing speed and effi-ciency [10]-[13]. Othmana et al. proposed FLC which has the ability to maintain MPP under different irradiation values [14].
Most of the previous work studied PV systems under different irradiations with full shading. The main objec-tive of this study is to develop an efficient MPPT algorithm under sudden changes and partial shading condition with the possible least components; decreasing by that cost and time performance of the system.
2. PV System
2.1. PV Cell
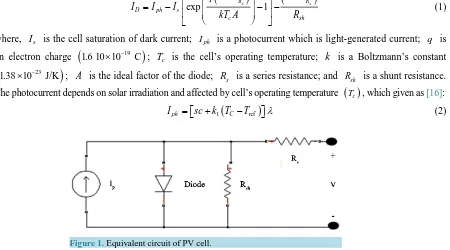
PV generates power by converting sunlight to electricity. The electric current generated is proportional to solar irradiation. PV cell can generate around 0.5 to 0.8 volts. Because of the small power generated by PV cell, modules contain several PV cells are connected in parallel or series to form PV panel. Furthermore, panels are connected in parallel and/or series to form an array [15]. The equivalent circuit of a PV cell includes diode, shunt resistance, se-ries resistance representing an internal resistance to current flow, and current source is illustrated in Figure 1.
The output current of a solar cell is given as [16]:
(
)
(
)
exp Rs 1 Rs
D ph s
c sh
q V I V I
I I I
kT A R
+ + = − − − (1)
where, Is is the cell saturation of dark current; Iph is a photocurrent which is light-generated current; q is
an electron charge
(
1.6 10 10× −19 C)
; Tc is the cell’s operating temperature; k is a Boltzmann’s constant(
23)
1.38 10× − J/K ; A is the ideal factor of the diode; Rs is a series resistance; and Rsh is a shunt resistance.
The photocurrent depends on solar irradiation and affected by cell’s operating temperature
( )
Tc , which given as [16]:(
)
1 ref
ph C
[image:2.595.92.542.472.722.2]I =sc+k T −T λ (2)
where Isc is the short-circuit current of the cell at an ambient temperature (25˚C) and insolation of 1 kW/m2,
ref
[image:3.595.148.449.292.482.2]T is the reference temperature, KI is temperature coefficient of the cell’s short-circuit current, and λ is the solar insolation in kW/m2.
Figure 2 shows the typical nonlinear I-V characteristic curves which depend on insolation levels. There is a
specific point on each curve where the system operates at its maximum efficiency. This point is called maximum power point MPP. The location of this point changes with irradiation, and can be traced using MPPT algorithms.
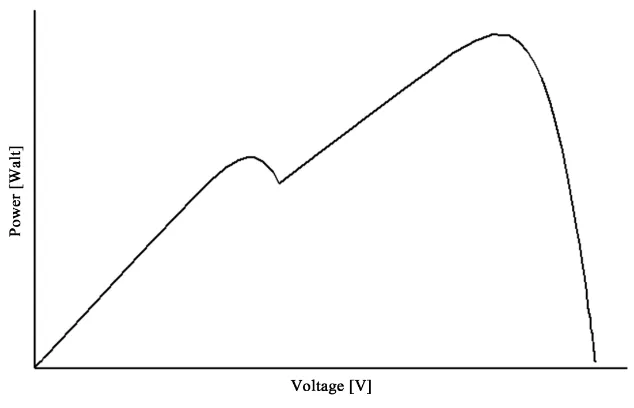
Partial shading is defined as a shadow falling on part of the PV system, which will in turn decrease the current generated for shaded cells, and resulted in decreasing the overall power generated from the PV system. The case study in this paper will examine the overall power generated from the PV system when applying the partial shading on 36 cells which represents 50% of the system. Figure 3 shows the effect of shading on 36 cells of the system on P-V curve. The shading was applied by decreasing the irradiation on 36 cells of the PV system from 1000 to 700 Watt/m2. As shown in the figure, multiple peaks are presented in the PV characteristic under partial shading condition. Thus, tracking algorithms become more complicated under partial shading condition.
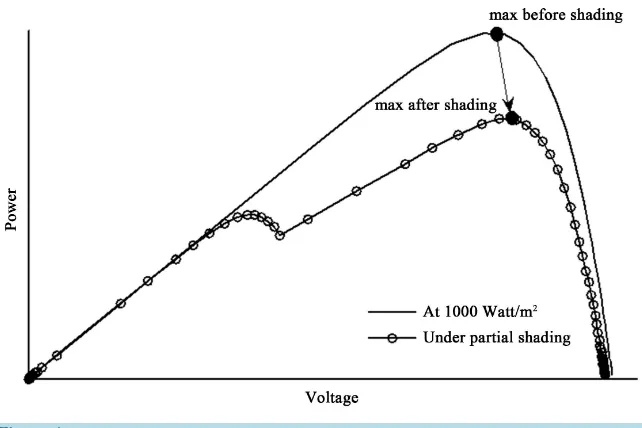
Figure 4 shows the effect of partial shading on maximum power point of the PV system. The arrow re-
[image:3.595.140.457.506.710.2]presents the necessary transmission of the operating point to maintain the maximum power value after partial shading.
Figure 2. Effect of irradiance changes on I-V characteristics.
Figure 4. Effect of partial shading on P-V characteristic.
2.2. Proposed FLC
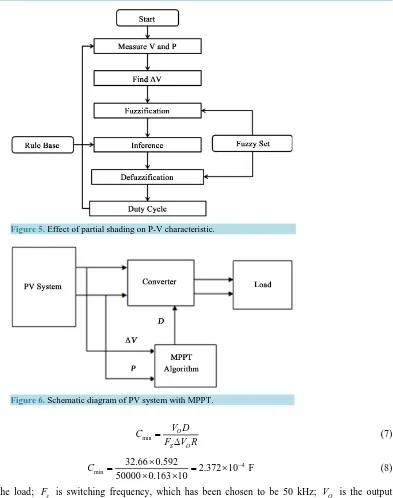
The flow chart of the MMPT is shown in Figure 5. The PV system composed of PV panel, Boost converter, MPPT and resistive load as shown in Figure 6. The proposed algorithm consists of fuzzy logic controller with pulse width modulator connected to the boost converter.
A. Boost Converter Design
In this work, a boost converter controlled by MPPT algorithm is used to track MPP. Voltage gain of the con- verter is given as [17]:
(
11)
O
S
V
V = −D (3)
where VO is the output power that should be reached; VS is the input voltage of the converter; and
D
is the duty cycle. Duty cycle could be calculated using the following equation [17]:on
T D
T
= (4)
where Ton is the active time of the signal; and
T
is the total period time of the switching signal.The switching signal has a square shaped, with low (inactive) and high (active) period. The signal has 0, 1 magnitude. When signal is active, the inductor of the converter storages magnetic energy; amount of the energy depends on the value of the active time. In the second part of the signal, where it’s inactive and the IGBT works as an open circuit, the inductor produces a back electromagnetic field in the opposite polarity of the voltage during the active period. In this case the loop of the converter will include two voltages, which is the input volt- age that comes from the PV system added to the voltage across the inductor, and by that the voltage across the load will be higher than the input voltage. And because of this the boost converter has been named as a step up converter.
Appropriate values of inductance and proper capacitance of the converter is necessary to attain stability of the system at different levels of irradiation. The minimum inductance and capacitance values can be calculated as [17]:
(
)
2min
1 2 S
DR D
L
F −
= (5)
(
)
26 min
0.592 10 1 0.592
9.855 10 H 2 50000
L = × × − = × −
Figure 5. Effect of partial shading on P-V characteristic.
Figure 6. Schematic diagram of PV system with MPPT.
min
O
S O
V D C
F V R =
∆ (7)
4 min
32.66 0.592
2.372 10 F 50000 0.163 10
C = × = × −
× × (8)
where
R
is the load; Fs is switching frequency, which has been chosen to be 50 kHz; VO is the output voltage; ∆VO is the ripple voltage which is 5% of VO. After calculating minimum values of boost elements, and tuning them to reach stability at high input voltage values, the simulated model has been built with the fol-lowing design values; L=0.00003 H, output capacitor of C=0.001 F and a resistance load of 10 Ω. The IGBT is switched using a squared PWM signal on the gate. The signal is modulated using simple pulse width modulator to decrease the response time of the system.B. Fuzzy Logic Controller Design
have been performing well under sudden changes in the irradiation.
The proposed algorithm controls the duty cycle
( )
D of the switching signal. The proposed fuzzy controller has two inputs; power of the PV system( )
P and the change in PV voltage( )
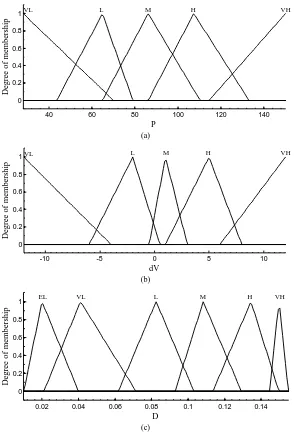
∆V . Fuzzy logic controller has three stages: fuzzification, inference, and finally defuzzification. Membership functions with a triangular shape have been used. Mamdani-type system with two inputs and one output has been developed. The range of signals has been determined based on simulated data. Figure 7 shows the membership function of the fuzzy logic con- troller inputs and output. In this work, the input signals are divided into five subsets: Very Low (VL), Low (L), Medium (M), High (H), and Very High (VH). Subsets of the membership functions are determined based on the relation between the output power and optimal values of duty cycle. In this study, output power of the PV sys-tem was calculated, as well as ∆V of the system at different cases of partial and full shading. The range of them was found to represent the range of the input membership functions. The relation between them with the duty cycle was studied to determine the subsets and the rules of the fuzzy controller.Inference system produces results depending on the rules and an Implication is used to interpret these rules with antecedent or/and consequent. Implication operators are, OR, AND, NOT, which are correlating to either formalism of residuation or a Boolean logic concept from intuitionistic logic.
(a)
(b)
[image:6.595.152.446.273.709.2](c)
Figure 7. Membership functions of fuzzy system signals.
40 60 80 100 120 140
0 0.2 0.4 0.6 0.8 1 P
Degree of membership
VL L M H VH
-10 -5 0 5 10
0 0.2 0.4 0.6 0.8 1 dV
Degree of membership
VL L M H VH
0.02 0.04 0.06 0.08 0.1 0.12 0.14
0 0.2 0.4 0.6 0.8 1 D
Degree of membership
VL L M H VH
Fuzzy rules are found upon experimental knowledge about the problem or simulated data from PV system model. In this work, a simulated data was found using a model consists of PV panel connected to a boost converter. Simulation data reveals the predicted output at different values of inputs depending on some relation, and then the rules have been determined according to this relation.
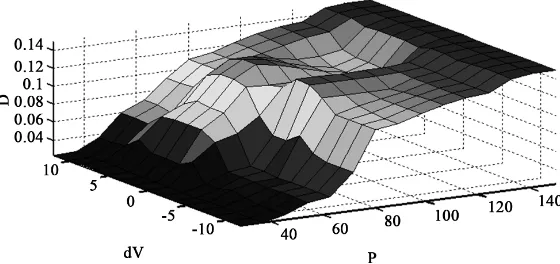
[image:7.595.158.438.302.434.2]In this work, five subsets for each input and twenty five rules have been used. Based on the results of Simulink model, tuning the rules is performed to design the fuzzy logic controller. The proposed fuzzy rules of the system are shown in Table 1. Values of fuzzy controller inputs are compared with twenty-five rules of the system and are implicated with the membership functions. The implication has been chosen to be “and” operator. The rules were implicating by taking the minimum value of the membership function of the inputs for all the truth rules. The implicated rules were aggregated using maximum method. Figure 8 shows the surface view for the relation between fuzzy inputs and output. The simulated model needs a crisp value from the fuzzy controller, thus a defuzzification of the output membership function after aggregation is a must. Centroid method has been selected for defuzzification by calculating centre of mass of the aggregated membership function. The centroid method is one of the most physically appealing and prevalent method of all defuzzification methods.The crisp value represents the duty cycle of the switching signal that triggers the IGBT in the boost converter. This pro- cess is usually called Center of Gravity or Center of Area. The final membership function after aggregation is shown in Figure 9, while Z* is the value of the centroid and can be calculated as [20].
[image:7.595.222.378.463.594.2]Figure 8.Surface view for fuzzy inputs (P, dV) vs. output (D).
Figure 9. Centroid of the membership function [20].
Table 1. Rules of the fuzzy controller.
∆V/P VL L M H VH
VL EL VL M H VH
L EL VL H H VH
M EL M M M VH
H EL M H M VH
[image:7.595.90.538.634.719.2]( )
( )
d
d
A
A
Z Z z
Z
Z z
µ µ
∗ =
∫
⋅∫
(9)3. Simulation Model
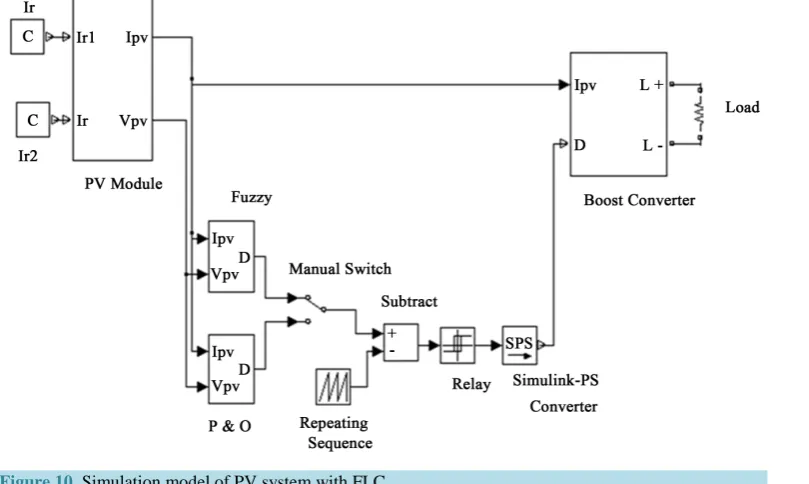
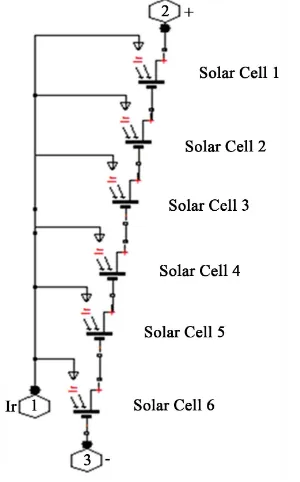
To test the performance of the proposed FLC, The PV has been built and simulated in Matlab/Simulink. The model as shown in Figure 10 is composed of PV system, boost converter, MPPT controller, and resistance load. Simulation of PV system is implemented using Simscape toolbox, while the boost converter is implemented us-ing Simpower toolbox. Controlled current source is utilized to connect PV system with boost converter. The specifications of PV cell used in this study are listed in Table 2. In simulated model, 72 solar cells are connected in series to form PV module. To connect 72 cells in series, essential blocks have been linked together; each block contains 6 connected solar cells in series as shown in Figure 11.
Partially shaded model is developed by connecting in series two modules as shown in Figure 12. Bypass di-ode is connected to each module provides protection against reverse current. Each module is allowed to receive different level of irradiation.
Input Signals: Ppv, and Vpv, are voltage and power signals from PV panel. The voltage signal is saved in a memory in order to subtract current and previous values to be entered into fuzzy controller block. Fuzzy logic controller block calls the fuzzy system and passes the inputs to it. The output of fuzzy controller is also passed directly to the converter from the fuzzy system by this model.
[image:8.595.105.510.355.597.2]PV system was connected to a boost converter that is controlled by a fuzzy controller. Figure 13 shows the si- mulated model of the fuzzy controller.
Figure 10. Simulation model of PV system with FLC.
Table 2.Parameters of solar cell.
Short circuit current ( )Isc 4.75 A
Open circuit voltage ( )Voc 0.6 V
Irradiation ( )Ir0 1000 Watt/m
2
Ideality factor ( )N 1.6
Figure 11. Simulation model of PV system with FLC.
[image:9.595.226.376.87.328.2]Figure 12. Schematic diagram of PV system under partial shading.
Figure 13. Simulation model of FLC.
4. Simulation Results and Discussion
To evaluate the performance of the proposed algorithm, three different conditions are simulated: 1) Uniform ir-radiation; 2) Sudden changing; 3) Partial shading. Figure 14 shows the MPP for different irradiation levels. The maximum power output reached 148 Watt when PV module is subjected to 1000 Watt/m2. Furthermore, when the irradiation is decreased to 700 Watt/m2 and 600 Watt/m2, the resulted maximum power is 102 Watt and 87.2 Watt respectively. As shown in Figure 15, two peaks are appeared in P-V curve when the PV is subjected to partial shading corresponding to 70 and 96.9 Watt.
[image:9.595.170.430.485.571.2]Figure 14. P-V characteristics at different irradiations.
Figure 15. P-V characteristics when partial shading from 1000 to 600 Watt/m2.
[image:10.595.90.540.653.722.2]Figure 16. Output of fuzzy at1000 Watt/m2.
Table 3.Rules of the fuzzy controller.
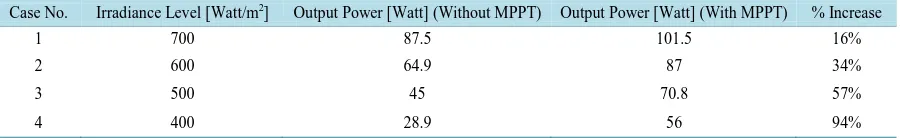
Case No. Irradiance Level [Watt/m2] Output Power [Watt] (Without MPPT) Output Power [Watt] (With MPPT) % Increase
1 700 87.5 101.5 16%
2 600 64.9 87 34%
3 500 45 70.8 57%
transient response of MPPT algorithm when PV is subjected to uniform irradiation. It can be seen that FLC has extremely fast response with rise time equals to 0.01 second. Power values on the load after applying FLC have been compared with the nominal values of the maximum power points for several cases of uniform irradiation and partial shading.
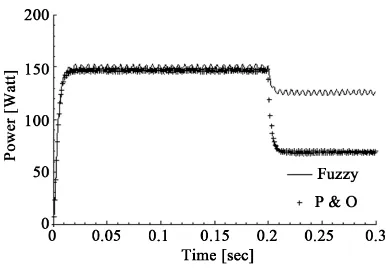
Levels of irradiation were suddenly increased or decreased on the whole panel to test the ability of FLC under sudden changes in irradiation. In this case, the PV characteristic curve has one peak. Several tests were achieved by changing irradiation on the panel suddenly at 0.2 sec. As it can be seen in Figure 17, FLC has excellent abil-ity to track MPP in less than 0.01 second when PV is subjected to sudden changes in irradiation. Figure 18 show the output power for fuzzy controller compared with P & O algorithm for partial shading condition. When PV is subjected uniform shading, both controllers works properly and reached maximum power point. When PV panel is subjected to partial shading at 0.2 sec, both controllers detects irradiation changes. P & O algorithm changes the value of duty cycle of the switching signal of the converter to track the MPP by a fixed step each time. Because of this fixed step, optimal values are not necessary reached.
(a) (b)
[image:11.595.120.507.249.536.2]
(c) (d)
Figure 17. Output of fuzzy controller. (a) Full shading from 600 to 300 Watt/m2; (b) Full shading from 700 to 400
Watt/m2; (c) Full shading from 900 to 400 Watt/m2; (d) Increasing shading from 300 to 800 Watt/m2.
Figure 18. Comparison between fuzzy and P & O partial shading (partial shading 1000 to 800 Watt/m2).
0 0.05 0.1 0.15 0.2 0.25 0.3
0 20 40 60 80 100 Time [sec] P o w e r [ W a tt]
0 0.05 0.1 0.15 0.2 0.25 0.3
0 20 40 60 80 100 120 Time [sec] P o w e r [ W a tt]
0 0.05 0.1 0.15 0.2 0.25 0.3
0 50 100 150 Time [sec] P o w e r [ W a tt]
0 0.05 0.1 0.15 0.2 0.25 0.3
[image:11.595.201.394.570.705.2]5. Conclusion
In this study, FLC has been developed to track the maximum power point of PV system. PV panel, boost converter with FLC connected to a resistive load has been simulated using Matlab/Simulink. Simulation results have been com-pared to nominal power values. The proposed system showed its ability to reach MMP under uniform irradiation, sudden changes of irradiation, and partial shading. Simulation results have shown that using FLC has great advantages over conventional methods. It is found that Fuzzy controller always finds the global MPP. It is found that fuzzy logic systems are easily implemented with minimal oscillations with fast convergence around the desired MPP.
References
[1] Devabhaktuni, V., Alam, M., Reddy Depuru, S.S.S., Green II, R.C., Nims, D. and Near, C. (2013) Solar Energy: Trends
and Enabling Technologies. Renewable and Sustainable Energy Reviews, 19, 555-556.
http://dx.doi.org/10.1016/j.rser.2012.11.024
[2] Bataineh, K.M. and Dalalah, D. (2012) Optimal Configuration for Design of Stand-Alone PV System. Smart Grid and
Renewable Energy, 3, 139-147. http://dx.doi.org/10.4236/sgre.2012.32020
[3] Bataineh, K. and Dalalah, D. (2013) Assessment of Wind Energy Potential for Selected Areas in Jordan. Journal of
Renewable Energy, 59, 75-81.
[4] Bataineh, K.M. and Hamzeh, A. (2014) Efficient Maximum Power Point Tracking Algorithm for PV Application under
Rapid Changing Weather Condition. ISRN Renewable Energy, 2014, Article ID: 673840.
http://dx.doi.org/10.1155/2014/673840
[5] International Energy Agency (2010) Trends in Photovoltaic Applications. Survey Report of Selected IEA Countries be-
tween 1992 and 2009. http://www.ieapvps.org/products/download/Trends-in Photovoltaic_2010.pdf
[6] Cuia, Y., Yaoa, W. and Luoa, J. (2012) A Research and Improvement on a Maximum Power Point Tracking Method
for PV System under Partially Shaded Conditions. Procedia Engineering, 29, 2583-2589.
http://dx.doi.org/10.1016/j.proeng.2012.01.355
[7] Eltawila, M. and Zhao, Z. (2013) MPPT Techniques for Photovoltaic Applications. Renewable and Sustainable Energy
Reviews, 25, 793-813. http://dx.doi.org/10.1016/j.rser.2013.05.022
[8] Chao, K. and Li, Ch. (2010) An Intelligent Maximum Power Point Tracking Method Based on Extension Theory for
PV Systems. Expert Systems with Applications, 37, 1050-1055. http://dx.doi.org/10.1016/j.eswa.2009.06.068
[9] Heydari-Doostabad, H., Keypour, R., Khalghani, M. and Khooban, M. (2013) A New Approach in MPPT for
Photo-voltaic Array Based on Extremum Seeking Control under Uniform and Non-Uniform Irradiances. Solar Energy, 94,
28-36. http://dx.doi.org/10.1016/j.solener.2013.04.025
[10] Lui, Y.H., Lui, C.L., Huang, J.W. and Chen, J.H. (2013) Neural-Network-Based Maximum Power Point Tracking
Me-thods for Photovoltaic Systems Operating under Fast Changing Environments. Solar Energy, 89, 42-53.
http://www.sciencedirect.com/science/journal/0038092X/89/supp/C
[11] Guenounoua, O., Boutaib, D. and Ferhat, C.H. (2013) Adaptive Fuzzy Controller Based MPPT for Photovoltaic
Sys-tems. Energy Conversion and Management, 78, 843-850. http://dx.doi.org/10.1016/j.enconman.2013.07.093
[12] Punithaa, K., Devaraja, D. and Sakthivel, S. (2013) Artificial Neural Network Based Modified Incremental
Conduc-tance Algorithm for Maximum Power Point Tracking in Photovoltaic System under Partial Shading Conditions. Energy,
62, 330-340. http://dx.doi.org/10.1016/j.energy.2013.08.022
[13] Subiyanto, S., Mohamed, A. and Hannan, M. (2012) Intelligent Maximum Power Point Tracking for PV System Using
Hopfield Neural Network Optimized Fuzzy Logic Controller. Energy and Buildings, 51, 29-38.
http://dx.doi.org/10.1016/j.enbuild.2012.04.012
[14] Othmana, A., El-arinia, M., Ghitasb, A. and Fathy, A. (2012) Realworld Maximum Power Point Tracking Simulation
of PV System Based on Fuzzy Logic Control. NRIAG Journal of Astronomy and Geophysics, 1, 186-194.
http://dx.doi.org/10.1016/j.nrjag.2012.12.016
[15] Markvart, T. (1994) Solar Electricity. John Wiley & Sons, Hoboken.
[16] Tsi, H.L., Tui, C.S. and Su, T.J. (2008) Development of Generalized Photovoltaic Model Using MATLAB/SIMULINK.
Proceedings of the World Congress on Engineering and Computer Science, San Francisco, 22-24 October 2008, 846- 851.
[17] Kharb, R., Ansari, M.D. and Shimi, S. (2014) Design and Implementation of ANFIS Based MPPT Scheme with Open
Loop Boost Converter for Solar PV Module. International Journal of Advanced Research in Electrical, Electronics
and Instrumentation Engineering, 3, 2320-3765.
[18] Esram, T. and Chapman, P. (2007) Comparison of Photovoltaic Array Maximum Power Point Tracking Techniques.
[19] Yen, C.L. (2010) Overall Efficiency of Grid Connected Photovoltaic Inverters. European Standard EN 50530.
[20] Ulukan, Z. and Ucuncuoglu, C. (2010) Economic Analyses for the Evaluation of Is Projects. Journal of Information