Volume 58, 2019, Pages 225–235
Proceedings of 34th International Confer-ence on Computers and Their Applications
Prediction of Drowsy Driving Using
EEG and Facial Expression
by Machine Learning
Daichi Naito, Ryo Hatano and Hiroyuki Nishiyama
Department of Industrial Administration, Tokyo University of Science
Abstract
Careless driving is the most common cause of traffic accidents. Being in a drowsy state is a cause of careless driving, which can lead to a serious accident. Therefore, in this study, we focus on predicting drowsy driving. Studies on the prediction of drowsy driving focus on the prediction aspect only . However, users have various demands, like not wanting to wear a device while driving, and it is necessary to consider such demands when we introduce the prediction system. Hence, our purpose is to predict drowsy driving that can respond to a user’s demand(s) by combining two approaches of electroencephalogram (EEG ) and facial expressions. Our method is divided into three parts by type of data (facial expressions, EEG, and both), and the users can select the one suitable for their demands. We acquire data with a depth camera and an electroencephalograph and make a machine-learning model to predict drowsy driving. As a result, it is possible to correctly predict drowsy driving in the order of facial expression<EEG<and both combined. Our framework may be applicable to data other than EEG and facial expressions.
1
Introduction
According to the World Health Organization (WHO), worldwide, more than 1.25 mil-lion people die and between 20 and 50 milmil-lion more people are injured each year by traffic accidents[8]. Traffic accidents are said to be the eighth leading cause of death and will become the seventh by 2030 [9]. From the above, the 2030 Agenda for Sustainable Development has set the goal of halving the number of casualties caused by traffic accidents worldwide by 2020. Hence, methods to reduce traffic accidents have been presented .
driving, and it is necessary to consider such demands when we introduce the prediction system. Hence, in this study, we predict drowsy driving by various methods to accommodate various demands. We focus on two factors relating user demands, the ease of use and high prediction accuracy. To predict drowsy driving with high accuracy, it is necessary to attach a device to the user or use various devices. Hence, these two demands have a trade-off relationship. In this method, we predict the drowsy state by multiple methods so that users can select the suitable method for their demand.
In general, EEG is used by polysomnography to classify the sleep stage. The polysomnogra-phy is performed by visually confirming the waveform of the EEG[11,7]. Tarek[2] automatically identified the sleep stage by support vector machine (SVM). Studies for sleep stage recognition using EEG have been developed in recent years, and the utility of combining EEG and machine learning has been proposed. Hence, in this study, we also employ the combination of EEG and machine learning to predict drowsy driving with high accuracy. We focus on low-cost and simple electroencephalograph that can be introduced easily for many of us. However, with this approach it is necessary to attach a device to the driver’s body, which may be difficult to introduce to a driver who does not want to wear a device. Therefore, as an alternative method, we can predict drowsy driving more easily and without contact using a depth camera to observe the condition of the driver’s facial expressions. Our purpose is to propose the framework for predict drowsy driving that can respond to a user’s demands by combining the two approaches of EEG and facial expressions.
We organize the rest of the paper as follows: Section 2 summarizes several studies with respect to drowsy driving; Section 3 presents an overview of our method and the principles of machine learning; Section 4 details our experiment and the analysis of our results; and Section 5 concludes this paper with further remarks.
2
Related Work
Nishiyama et al.[6] proposed a method to predict drowsy driving using a driver’s facial expression and inductive logic programming, acquired with a depth camera. They obtained a set of rules that could be interpreted as corresponding formulas of first-order logic. This approach is suitable for those who do not want to attach the sensors because data can be acquired without contact.
Tarek et al.[2] classified the human sleep stages with an SVM using EEG, electrooculogram (EOG), and electromyogram (EMG) data. This study focused on the classification of sleep stages throughout the night, so this approach could not be directly applied to predicting drowsy driving. Furthermore, their employed device was too large for our purpose.
3
Method
3.1
Overview of Our Method
To predict drowsy driving, we consider the combination of data types as follows.
• Using EEG
• Using facial expressions
• Using both EEG and facial expressions
In general, we place the relationship of the above three combinations over a space of accuracy and ease-of-use, as shown in Figure 1. Therefore, we can select an appropriate combination suitable for our demands, and we propose a framework to predict drowsy driving as shown in Figure2. Our framework consists of two phases, the learning (or training) a model phase and the prediction phase. First, in the learning a model phase, we extract features from EEG, facial expressions, or both data that is collected by our experiments then obtain a model by learning. Finally, at the prediction stage, we predict drowsy driving using each data from the learned models.
3.2
Feature Extraction
Figure 2: Overview of our framework
In this study, we extract the features using a sliding window that shifts every second. Because it is necessary to extract the features quantity as one window every few seconds if we deal with time series data, it is also important to determine features in real time. The sliding window is often used for time series data, and it can be performed with 5 s of data every second, which allows us to construct more data than just delimiting simply with 5 s for the training data. Each window of 5 s was labeled as either “drowsy” or “awake” according to the following conditions:
• Drowsy: a driver is drowsy for more than 3 s.
• Awake: a driver remains awake for more than 5 s.
Windows that did not fit either of the above conditions were excluded from the training data.
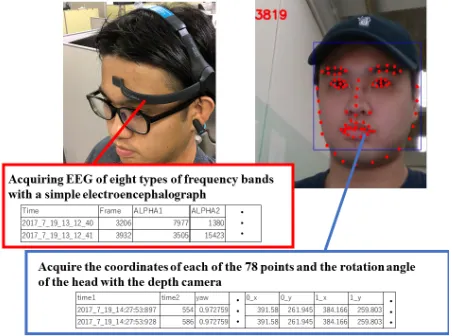
We acquire data using an electroencephalograph and depth camera. Generally, the 10 - 20 electrode system that applies electrodes to 37 places is used for EEG measurement [2]. However, such device(s) is not suitable for acquiring the EEG during driving because it is large scale and requires a gel to be applied between the head and the device to extract friction. Therefore, in this study, we acquire EEG data with a simple electroencephalograph with a single channel dry sensor, as shown on the left side of Figure3, that is sent to a computer via Bluetooth. As shown on the right side of Figure3, we acquire the facial expressions data with a depth camera that collects three-dimensional (3D) coordinates of characteristic points of the face and rotation angles such as yaw, pitch and roll. The data is saved as a comma-separated values (CSV) file.
3.2.1 Features of EEG
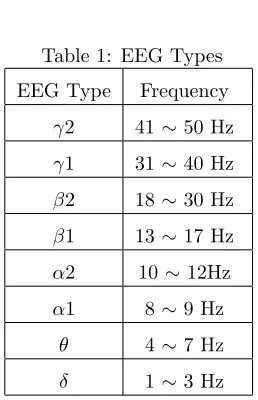
In general, EEG frequencies are divided into five types (α, β, γ, δ and θ waves). The amount of EEG activity is also thought to change depending on the human state (e.g., awake, sleep, and mental state) [12]. We categorize each EEG into one of eight types (see also Table 1): α1, α2, β1, β2, γ1, γ2, δ and θ waves. The definition of these types is based on the specification of the electroencephalograph used in this study [5]. Therefore, we define a set
E={α1, α2, β1, β2, γ1, γ2, δ, θ} of EEG types. We can acquire the power spectral density for the range of each of the above eight types of EEG every second with the electroencephalograph used in this study.
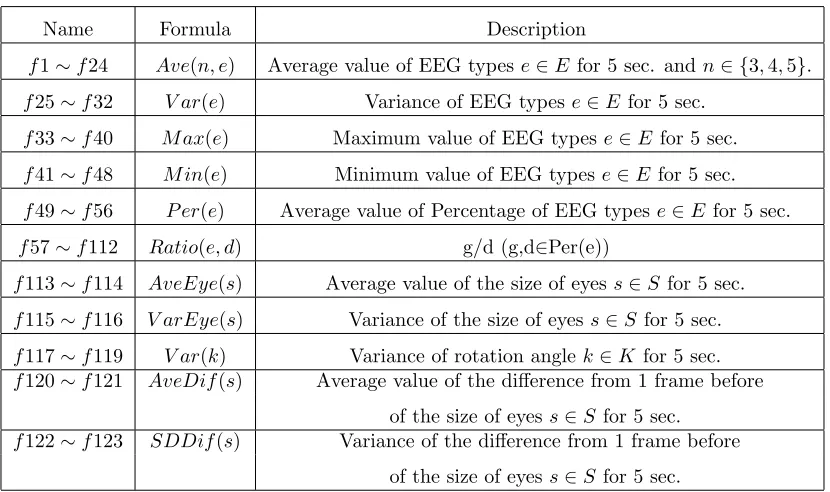
From each of the acquired EEG types, we extract features of f1 to f112 in the table2. Given anye∈E,P er(e) is the average of 5 seconds for each EEG ratio defined by the following formula (1).
P er(e) =1 5
5 X
t=1 (Xet
d∈E
dt
) (1)
Table 1: EEG Types
EEG Type Frequency
γ2 41∼50 Hz
γ1 31∼40 Hz
β2 18∼30 Hz
β1 13∼17 Hz
α2 10∼12Hz
α1 8∼9 Hz
θ 4∼7 Hz
3.2.2 Features of Facial Expressions
Using our depth camera, we can collect 3D coordinate data of 78 characteristic points on a face and rotation angle of a head at almost 30 frames per second. Since human faces are different from each other, individual differences also exist in 3D coordinates of characteristic points of the face. In order not to affect the prediction result, it is necessary to extract features so that we reduce individual differences as much as possible. Therefore, we calculate the size of each eye by dividing the eye area of each frame by the average of the eye area in the first 3 minutes and use it as the feature. In addition, since the rotation angle (yaw, pitch, and roll) of the head is not affected by parts of the face, we use the variance of these 5 s as the feature. We define the size of eyes and rotation angle in setsS ={the size of the right eye, the size of left eye} and K ={yaw, pitch, roll}. FromS andK, we extract features off113 to f123 as shown in Table2.
Table 2: Features
Name Formula Description
f1∼f24 Ave(n, e) Average value of EEG typese∈E for 5 sec. andn∈ {3,4,5}.
f25∼f32 V ar(e) Variance of EEG typese∈E for 5 sec.
f33∼f40 M ax(e) Maximum value of EEG typese∈E for 5 sec.
f41∼f48 M in(e) Minimum value of EEG typese∈E for 5 sec.
f49∼f56 P er(e) Average value of Percentage of EEG typese∈E for 5 sec.
f57∼f112 Ratio(e, d) g/d (g,d∈Per(e))
f113∼f114 AveEye(s) Average value of the size of eyess∈S for 5 sec.
f115∼f116 V arEye(s) Variance of the size of eyes s∈S for 5 sec.
f117∼f119 V ar(k) Variance of rotation anglek∈K for 5 sec.
f120∼f121 AveDif(s) Average value of the difference from 1 frame before
of the size of eyess∈S for 5 sec.
f122∼f123 SDDif(s) Variance of the difference from 1 frame before
4
Experiment
4.1
Experimental Environment
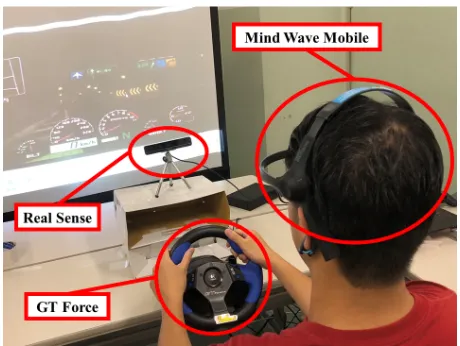
Figure 4: Experimental Environment
We used NeuroSky’s MindWave Mobile as our electroencephalograph and Intel’s Realsense SR300 as our depth camera. We used a simulator for the driving aspect so that there was no risk to the subject during drowsy driving. Specifically, we reproduced a driving environment by projecting Shutoko Battle (also known as “Tokyo Xtreme Racer” in the US and “Tokyo Highway Challenge” in Europe) via PlayStation 2 on a projector screen. We used Logicool’s GT Force for the pedals and steering wheel to simulate the driving environment more accurately. Figure 4 shows our experimental environment. In addition, the experiments were conducted in a dark room to encourage sleepiness in the driver. A total of five subjects participated in the experiment during August 2018. We acquired approximately 5 driving hours of data per person.
4.2
Creation and evaluation of models
Following to the study by Naito et al. [4], we use SVM in our research. Their results show that when they extract features as the common logarithm of EEG data, the evaluation performance was better than that of raw EEG data (cf. Table 3 of [4]). Hence, we also extracted the features with the common logarithm of the EEG data. We created and evaluated models with one person’s data set for drowsy driving in the experiment. The optimal weight and parameters were given for each models by a grid search. We verified the performance of each trained models by 10-fold cross validation and evaluated each learning model by its accuracy, recall, and F-value.
their ranking. 1 Afterward, we compared obtained classifiers when using all the features and
when selecting the features.
4.3
Result
4.3.1 Evaluation of models
Table 3: Results of using EEG and facial expressions
Using Data Evaluation value
Accuracy: 89.5% Facial Expressions Recall: 72.4%
F-value: 58.9% Accuracy: 97.0%
EEG Recall: 76.3%
F-value: 80.3% Accuracy: 97.1% Facial Expressions and EEG Recall: 87.0%
F-value: 83.0%
The breakdown of our dataset was 355 instances of drowsy state and 4,044 instances of awake state. Table3shows the results before selecting features. In the second row (using facial expressions data), the F-value is low, but recall is high. This means that the classifier may erroneously predict that the subjects are asleep when they are in the awake state but could find 72% of drowsy driving. Then, in the third row (using is EEG data) and the fourth row (using both facial expressions and EEG data), we could predict drowsy driving at 76% and 87%, respectively. Because these two also have high F-values, there are few erroneous classifications. These results indicate that it is possible to correctly predict drowsy driving in the order of using facial expressions<EEG<both.
1In general, Gini coefficients are used for importance calculations in Random Forest. For those who may
4.3.2 Features selection
Figure 5: Importance of facial expressions
Table 4: Result of using data with importance 1% or more
Using Data Evaluation value
Accuracy: 93.1% Recall: 83.4%
EEG F-value: 66.4%
Number of Features: 23 Accuracy: 96.4%
Recall: 93.2% Facial Expressions and EEG F-value: 80.7%
Number of Features: 25
We calculated the importance of the features of each classifier by Random Forest, where the sum of all importances is 1. Figure5 shows the importance of the facial expressions features.
f117 tof119 are features relating to the rotation angle of the head, and all were within the top four ranks. From this, there is a possibility that the prediction of drowsy state can be made only by the rotation angle of the head without using the size of the eyes. Hence, we evaluated classifiers created with the features of the rotation angle of the head only. As a result, accuracy was 87.3%, recall was 75.2%, and F-value was 48.9%. Thus, the drowsy state can be predicted using only the angle of rotation of the head even without using the eye’s features. In addition, because recall was higher than when using the eye’s features, we could predict the drowsy state better.
Since the number of features was 112 and 123, we selected the features having the importance of 1% or more. Table4is the result of 10-fold cross validation using the features with 1% or more importance, calculated from the EEG only and both EEG and facial expressions. Accuracy and F-value were lower using EEG features than when using all the features, but recall was higher. In this study, it is important to predict a drowsy state as much as possible without missing any instances. Because the number of drowsy states is one-tenth of that of awake state, about 10% of the actual awake state are erroneously predicted. Therefore, the classifier when selecting the features is suitable for our purpose. In addition, when using both facial expressions and EEG, recall exceeded 90%, so it is possible to predict a drowsy state with high accuracy, as desired.
5
Conclusion
Our purpose was to propose framework for predict drowsy driving that can respond to a user’s demand by combining two approaches of EEG and facial expression. We conducted experiments in a simulator environment and acquired EEG and facial expressions data using an electroencephalograph and a depth camera, respectively. Next, the features were extracted from the acquired data, and the classifier was created. Finally, each classifier was evaluated. As a result, we correctly predicted drowsy driving in the order of facial expression only<EEG only<EEG and facial expressions. In addition, the ease-of-use order was facial expressions and EEG<EEG<facial expressions, which had a trade-off relationship with prediction accuracy. However, users could select the method to use according to their demands. Furthermore, we selected features based on importance calculated with Random Forest. As a result, it was possible to predict more drowsy states by feature selection, and we could predict drowsy driving even without eye information.
However, since we evaluated the classifier by only one person’s data, generalization of a model cannot be assured without more samples. In addition, in this study, we predicted only the moment of drowsy driving. However, to prevent drowsy driving, we need to predict before drowsy driving occurs. Therefore, as a future study, we will divide the state during driving into multiple classes and predict the drowsiness level more precisely.
Our framework can be used for purposes other than drowsy driving in the future. For example, in a smart house when users fall asleep, lights and televisions can automatically turn off, or lessons in e-learning can restart from where users fell asleep. In addition, our framework may be applicable to data other than EEG and facial expressions. According to purpose and environment to be used, we may consider using other combinations of sensors in our framework in the future.
References
[1] Tokyo Metropolitan Police Department Transit Authority. About traffic death accident in 2016.
https://www.npa.go.jp/toukei/koutuu48/H28_jiko.pdf, February 2017. (visited: 21st Novem-ber 2017).
[2] Tarek Lajnef, Sahbi Chaibi, Perrine Ruby, Pierre-Emmanuel Aguera, Jean-Baptiste Eichenlaub, Mounir Samet, Abdennaceur Kachouri, and Karim Jerbi. Learning machines and sleeping brains: automatic sleep stage classification using decision-tree multi-class support vector machines. Jour-nal of neuroscience methods, 250:94–105, 2015.
[4] Daichi Naito, Ryo Hatano, and Nishiyama Hiroyuki. Labeling method using eeg to predict drowsy drivingwith facial expression recognition technology. International Journal of Computers and Their Applications (IJCA), 25(2):104–112, 2018.
[5] NeuroSky. Neurosky support site. http://support.neurosky.com/kb/science/eeg-band-frequencies. (visited: 29th June 2018).
[6] Hiroyuki Nishiyama, Yusuke Saito, and Hayato Ohwada. Machine learning to detect drowsy driving by inductive logic programming using a 3d camera. InProc. of the 2016 International Symposium on Semiconductor Manufacturing Intelligence, 2016.
[7] American Academy of Sleep Medicine et al. The aasm manual for the scoring of sleep and associated events: Rules. Terminology and Technical Specifications. Westchester: AASM, 2007.
[8] World Health Organization. Road traffic injuries. http://www.who.int/en/news-room/fact-sheets/detail/road-traffic-injuries, February 2018. (visited: 23rd November 2018).
[9] World Health Organization. The top 10 causes of death. http://www.who.int/news-room/fact-sheets/detail/the-top-10-causes-of-death, May 2018. (visited: 23rd November 2018).
[10] Sebastian Raschka.Python machine learning. Packt Publishing Ltd, 2015.
[11] Allan Rechtschaffen and Anthony Kales. A manual of standardized terminology, techniques, and scoring systems for sleep stages of human subjects. Brain Information / Brain Research Institute, 1968.