Experimental Study and Mathematical Modeling
of the Osmotic Drying Process
F. Shafiee Langari, K. Movagharnejad*
Faculty of Chemical Engineering, Babol University of Technology, Babol, Iran
Abstract
The osmotic dehydration of three agricultural products including carrot, zucchini and turnip has been studied in this research. The effect of several factors including temperature, sample to osmotic solution weight ratio and the concentration of the osmotic solutes on the osmotic dehydration of these agricultural products were investigated experimentally. The experimental studies consist of two different concentrations (10%, and 20 W/W%for carrots, 30%, and 50 W/W% for zucchini and 40%, and 50 W/W% for turnips), two different vegetable/solution weight to weight ratios (1:10 and 1:15 for all materials) and two different temperatures (30°C and 50°Cfor carrots and zucchini and 40°C and 50°C for turnips). Three dietary coatings including pectin, carboxymethyl cellulose and corn starch have been selected to control the solids uptake during the osmotic process. The Azuara model proved to be the most accurate correlation to describe the kinetics of the osmotic dehydration of these three agricultural products. The root mean square error of the Azuara model for solid gain in different conditions was between 0.014 and 0.065 for carrots, 0.011 and 0.030 for zucchini and 0.008 and 0.014 for turnips. The root mean square error of the Azuara model for water loss in different conditions was between 0.008 and 0.016 for carrots, 0.003 and 0.008 for zucchini and 0.009 and 0.017 for turnips.
Keywords: Osmotic Dehydration, Drying; Azuara Model, Carrot, Zucchini, Turnip
1. Introduction
Drying is one of the most important food processing and preservation methods. The main purpose of this process is to allow longer periods of storage, minimize the packaging requirements and reduce the shipping costs [1]. Drying consists of simultaneous heat and mass transfer in a porous environment [2]. In fact, the common
Corresponding author:[email protected]
flavor seems necessary [3].
Osmotic drying is considered as a suitable substitution for many common drying processes [4] and has been extensively studied in recent years. Osmosis is a natural process in which the solvent flows from the part with lower concentration to another part of higher concentration through a semi permeable membrane without any change of phase. Osmotic dehydration (drying) process consists of placing foods in a hypertonic solution with higher osmotic pressure and a lower water activity compared to the food cellular environment [5]. As the cell-wall of many nutrients works as a semi-permeable tissue, a driving force for water movement between the osmotic solution and the food is created [6]. During this process three streams exist including [7]:
1- Water flux from the product to the surrounding solution.
2- Transfer of the dissolved solute from the solution to the product [8].
3- The flow of natural solutes (organic, mineral sugars, vitamins, etc.) from the vegetable to the solution.
The third stream is not so important, but it may influence the nutritional value of the final product.
The selection of the osmotic agent may be the most important step in this process. Osmotic potential of a solution depends on the total number of dissolved particles (ions or molecules). So it is necessary to use the materials which produce more particles in the solution. Most of the used salts like potassium, sodium and calcium chlorides are of this type. This solution should also have a good flavor, low water activity and acceptable price. Several researchers have
reported that the carbohydrates may be a good choice due to their fast action and good taste. Monosaccharides and disaccharides have also been used as the osmotic agents, because they readily dissolve in water and create considerable osmotic pressure. The most important examples are sucrose, maltodextrins, fructose, glucose and corn syrup, saline solutions like sodium chloride and calcium chloride.
Osmotic process has advantages such as high quality, minimum heat damage to color and flavor, lower packaging and distribution costs and product stability during the storage due to low water activity [9]. Despite these known benefits, its industrial use is still limited because of the absorption of unwanted solids into the product. It should be noted that the application of osmotic drying is limited due to the high absorption of dissolved substances that reduces the drying rate and changes of the organoleptic and nutritional properties of the food. Different ways have been studied to control the solid uptake during the osmotic drying. One method is the use of edible coatings that increases the proportion of the solid gain to water loss during the osmotic drying [10]. In this method a thin layer of edible material is placed on the nutrient levels by immersion or sprinkling (spraying) which improves the product appearance and protects it against mechanical taps, act as a barrier to prevent the penetration of oxygen, transport of gases, water vapor and dissolved solids.
coatings increased the efficiency of the osmotic dehydration of carrots.
Khin et al. [12] reviewed the use of sodium alginate and pectin coating and their effect on the osmotic dehydration of potatoes. Their studies proved the effect of the coating type on the osmotic drying of the fruits and vegetables.
Lazaris et al. [13] researched on the edible coatings during the osmotic dehydration. They covered potatoes with sodium alginate and sucrose osmotic solution. The cover had no influence on the amount of water loss, but it reduced the absorption of the solids. Their studies showed certain linear relations between the amount of water loss and dehydration time. Lenart [14] covered the strawberries with three different coatings including: pectin, potato starch and a mixture of pectin and potato starch. They reported that only the potato starch coating caused an increase in the vegetable/syrup ratio.
However, a number of other researchers indicated that a certain concentration exists for each coating solution, that will not decrease the absorption of solids after exceeding it. Excessive concentrations of the coating solution may lead to contact reduction between the coating and the fruit samples.
The aim of this work is to study the osmotic dehydration of food materials which have received less attention such as zucchini and turnips. Although the osmotic dehydration of carrots is widely studied, the geometry of samples in this work is different. The osmotic agents in this work are also different from the previous works. For example, the salt agent for carrot and sugar agent for zucchini and turnips are not used in
the previous studies. We have also tried to increase the driving force of the osmotic dehydration by using combined solutions to create more osmotic pressure. The use of edible coatings to increase the ratio of water loss to solid gain during the osmotic drying is another new aspect of this study.
2. Material and methods 2-1. Materials
2-1-1. Carrots
Carrots are considered as one of the most nutritious vegetables. This vegetable has the highest level of beta-carotene which is the precursor of vitamin A. Carrots are one of the best sources of vitamin B and C and pectin. Carrots are used to produce juices, pickles, salads, instant soups, stew and curries. Fresh carrots cannot be stored for more than 6 or 7 days in normal conditions. Osmotic dehydration methods provide a simple and cheap method to increase the storage period of carrots.
2-1-2. Zucchini
Zucchini is a summer agricultural product known to be a rich source of vitamin C, K, thiamin, riboflavin and minerals such as potassium, phosphorus, antioxidants and fiber. It is reported that its antioxidant content may help to reduce the loss of memory and other elderly diseases.
2-1-3. Turnip
the human body. The fiber content of turnip may cause the growth and proliferation of beneficial bacteria for bowel health.
2-2. Preparation of the samples
Carrots, zucchinis and turnips were bought from a local market, Babol, Iran. Samples that were physically disabled or suffered from corruption were discarded manually. Healthy Samples were maintained in the refrigerator up to 24 h at a temperature of 4-5°C. The required amount of samples was put out of the refrigerator and maintained at ambient temperature before the start of each experiment. Then the selected vegetables were washed thoroughly and the surface water of the vegetables was dried with a filter paper. Vegetables were sliced with a sharp knife and were cut into pieces with dimensions of 1×1×4 cm3 for carrots, spheres
with a diameter of 3 mm for zucchini and cylindrical shape with 5 cm in length and 8 mm in diameter for turnips.
2-3. Osmotic dehydration treatment
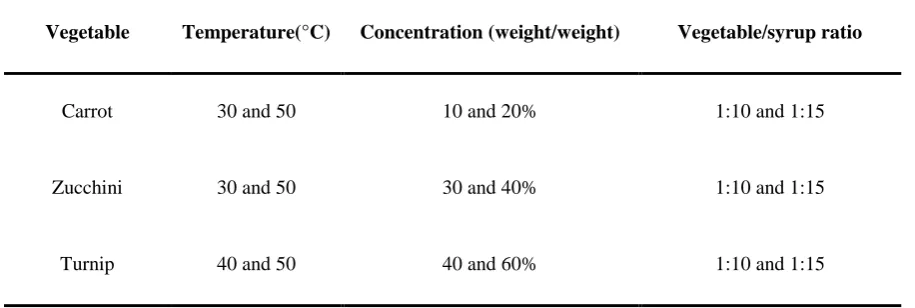
The hypertonic solutions were prepared by blending the osmotic agent with distilled water on a weight-to-weight basis. The vegetable/syrup solutions were prepared in two different ratios of 1:10 and 1:15 by weight. A magnet stirrer was used to prevent the syrup concentration during the osmotic drying. Once the temperature reached a steady state, the weighted vegetable samples were dropped into the solution to reach the known vegetable/syrup ratios. The samples were taken out of the osmotic medium in particular times. Each time the samples were removed manually from the osmotic solution. Then the samples were put on a filter paper to eliminate the superficial syrup before being weighed. The moisture content of these samples was measured with a digital moisture balance (±0.01 g). Table 1 shows the different experimental conditions for each vegetable.
Table 1
Temperature, concentration and vegetable/syrup ratio qualification for each vegetable.
Vegetable/syrup ratio Concentration (weight/weight)
Temperature(°C) Vegetable
1:10 and 1:15 10 and 20%
30 and 50 Carrot
1:10 and 1:15 30 and 40%
30 and 50 Zucchini
1:10 and 1:15 40 and 60%
40 and 50 Turnip
The osmotic process is usually evaluated by two main factors of water loss (WL) (grams of water removed per gram of fresh vegetable in dry basis), and solid gain (SG)
of the food samples, the proportion of food to osmotic solution, temperature, and treatment time. These two parameters are calculated by the following equations:
𝑊𝐿 = 𝑊𝑖×𝑋𝑖−𝑊𝑓×𝑋𝑓
𝑊𝑖 (1)
S𝐺 =𝑊𝑓×(1−𝑋𝑓)−𝑊𝑖×(1−𝑋𝑖)
𝑊𝑖 (2)
Where 𝑊𝑖 and 𝑊𝑓 are the initial and final
weights of the samples (g); 𝑋𝑖and 𝑋𝑓 are the
initial and final abstract moisture contents of the samples (g water/g dry solid). The sample weights were measured by a digital balance (±0.01 g) and the moisture contents were determined by a digital moisture balance (±0.01 g). The weight of the dried matter may be easily calculated after determination of the absolute moisture.
2-4. The coating
The coating solution was prepared by blending the coating material with distilled water on a weight-to-weight basis to cover the vegetable pieces. The solution was first heated to 60°C. Then the solution was removed from the electric heater and was allowed to reach the ambient temperature. The vegetable pieces were placed in a coating solution for one minute, and then it was taken from the solution to remove the excess solution by placing on the plotting paper. The components were transferred to osmotic solution on a weight to weight basis. A magnet stirrer was used to prevent the syrup concentration during the osmotic dehydration. The samples were taken out of the osmotic medium at particular times for each experiment. Each time, the samples
were removed manually from the osmotic solution and were put on the plotting paper to remove the superficial syrup before being weighed and transferred to the moisture evaluation system.
3. The mathematical model
Numerous models have been proposed for the description of the osmotic process. One of these models is published by Azuara et al [15]. This model can be used to obtain the equilibrium value of water loss and solid gain during the osmotic dehydration:
𝑊𝐿𝑡 =𝛽1𝑡(𝑊𝐿∞)
1+𝛽1𝑡 (3)
𝑆𝐺𝑡 =𝛽2𝑡(𝑆𝐺∞)
1+𝛽2𝑡 (4)
𝑡 𝑊𝐿𝑡 =
1
𝑊𝐿∞(𝑡) +
1
𝛽1𝑊𝐿∞ (5)
𝑡 𝑆𝐺𝑡 =
1
𝑆𝐺∞(𝑡) +
1
𝛽2𝑆𝐺∞ (6)
Eq.3 and Eq.4 are used to describe the water loss and solid gain percentages. WLt and SGt are the average percentage of water loss and solid gain at any time, wl∞and
lower total sum of squares (RMSE).
4. Results and discussions
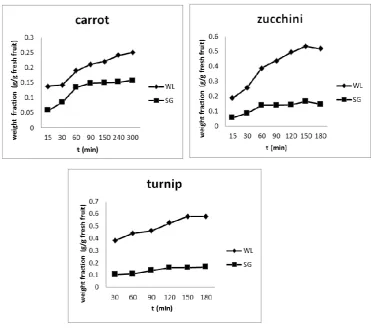
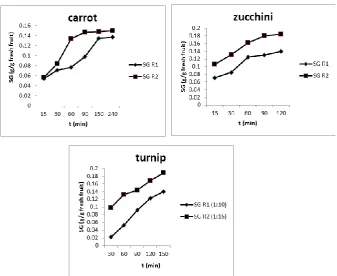
The variables studied in this research include temperature, osmotic solution concentration and weight to weight vegetable/syrup ratio. The water loss (WL) and solid gain (SG) of the samples are presented in the Fig. 1 as a function of time. It is clear that the moisture loss as well as the solid gain increases
non-linearly with time at all concentrations and temperatures. This increase is faster in the initial period of the osmosis dehydration and then the rate of increase decreases. This is expectable because the osmotic pressure difference between the solution and the intracellular space decreases continuously with time as the moisture keeps moving from sample to the solution and the solid from solution to the sample.
Figure 1. The water loss and solid gain during the osmotic dehydration.
It should be noted that the increase in solid gain would result in the formation of a high solid subsurface layer in time which may act as a barrier against the removal of water and solid gain [16]. The large amount of WL and the little amount of SG are favorable for the
and a phase of constant velocity, so the process can be stopped at the constant speed stage to avoid wasting time and money [17,18]. The optimized time based on the maximum WL and minimum SG, was found to be 240 minutes for carrot, 120 minutes for zucchini and 150 minutes for turnip.
4-1. Effect of different elements on the WL and SG
4-1-1. The effect of temperature
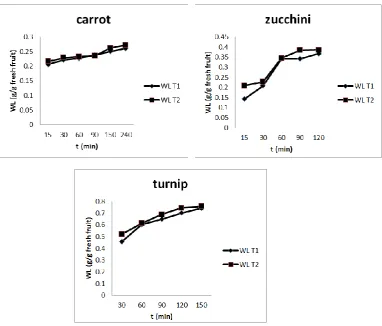
It can be observed from Fig. 2 that the moisture loss increases with the temperature.
This fact is expected because the higher temperature leads to higher mass transfer rate and faster water loss due to the swelling and plasticizing of the cell membranes. This procedure leads to faster water diffusion within the product and better water transfer characteristics on the product surface because of the lower viscosity of the osmotic medium. As the temperature rises, the transfer of water out of the vegetable tissues will accelerate and lead to faster spread out of the production water [16,19,20].
Figure 2. Effect of temperature on the water loss.
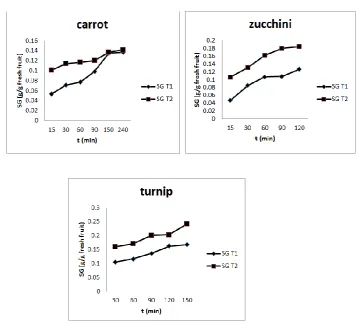
It can be observed from the Fig. 3 that the solid gain has increased with temperature of the osmotic solution. It may be assumed that the higher temperature leads to higher mass
researchers for other fruits and vegetables [21,22].
4-1-2. The effect of solid/syrup weight to weight ratio
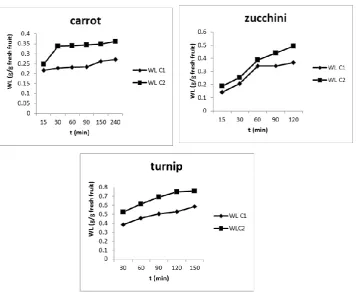
Fig 4. shows the results for vegetable/ syrup
ratios of 1:10 and 1:15 by weight. It can be
observed that both the water loss and solid gain have increased with time. No
significant difference between the water
losses of the two ratios was observed. This
difference for the solid gain was significant.
It means that the amount of solid uptake for
both weight ratios increased with time with
a similar trend. So it can be concluded that
the solid uptake would be higher in the
higher weight ratios which is demonstrated
in Fig. 5.
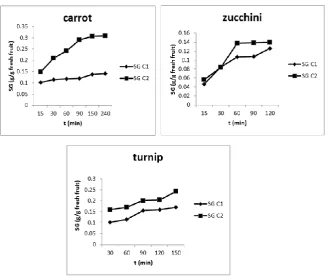
4-1-3. The effect of concentration
It can be observed from Fig. 6 that the water
loss has increased with concentration of the
osmotic solution at constant solution
temperature. In fact, with increasing the
concentration of the osmotic solution,
osmotic pressure and the concentration
difference between the solution and
vegetable has increased, so WL and SG have
also increased with the increase of the osmotic agents’ concentration in osmotic solution [23]. This result was predictable due
to the fact discussed in the previous section.
Such effects have also been reported by other
researchers for other fruits and vegetables
[24,25].
Figure 4. Effect of solid/liquid ratio on the water loss.
Figure 6. Effect of concentration on water loss.
It can be observed from Fig. 7 that the solid gain has increased with increasing the concentration of the osmotic solution at constant solution temperature. The high density of the osmotic solution causes an increase in the rate of mass transfer and solid gain and further reduction of the moisture content. The concentration difference, the osmotic driving force and the mass transfer rate increase as the osmotic solution concentration increases.
4-2. The coatings
Fig. 8 shows the effect of different coatings on the water loss and solid gain content of the carrots.
This Figure clearly shows that the coating has several effects on the osmotic dehydration of the carrots:
1- Carrots coated with pectin and starch reached lower water content than the uncoated samples.
2- The solid gain of the carrots coated with a solution of carboxymethyl cellulose was higher than the samples coated with corn starch and pectin, but lower than the uncoated samples. 3- Corn starch had almost the same
performance as pectin for carrots. 4- It can be concluded that the 2%
solution of carboxymethyl cellulose can be considered as a suitable pretreatment to enhance the quality of the dried carrots in the osmotic dehydration due to the increase of the water loss, decrease of the solid gain and good quality of the products.
Figure 7. Effect of concentration on solid gain.
Figure 8. Effect of coating on water loss and solid gain of carrot.
Fig. 9 shows the effect of the coating on water loss and solid gain of zucchini. These effects may be summarized as follows:
1- The pectin coating has almost no effect on the WL but reduces the SG.
2- The WL increased and the SG reduced by using 1% carboxymethyl cellulose coating.
were equal.
According to these results, the dewatering rate of zucchini in the samples coated with the carboxymethyl cellulose had the highest value. Finally, using the 1% solution of the carboxymethyl cellulose can be considered the suitable pretreatment to enhance the quality of the zucchini due to the increase of water loss, decrease of solid gain and the creation of products with good quality.
4-3. Mathematical modeling of the osmotic
dehydration
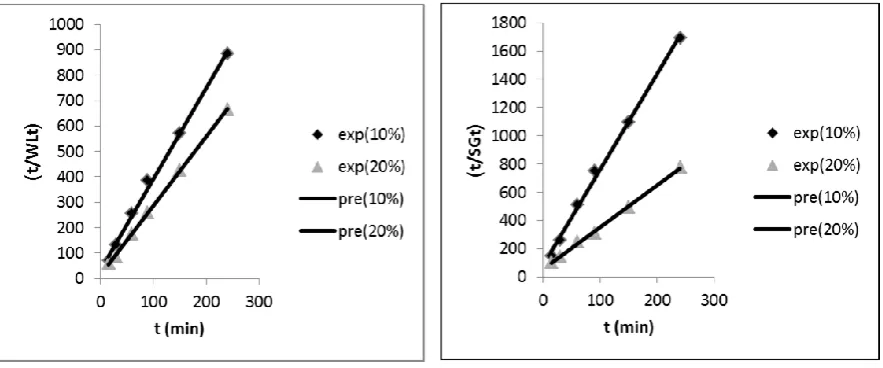
The value of WL∞ was obtained from the slope of the (t/WLt) plot versus time using WLt obtained from the experimental data at different times. Similarly, the value of SG∞ was obtained from the slope of the (t /SGt) plot versus time using SGt obtained from the experimental data.
Fig. 10 shows the lines of (t /WLt) and (t /SGt) versus time at the 30°C temperature and 1:15 weight to weight ratio of vegetable/syrup, at concentrations of 30 wt% and 40 wt% for carrot.
Figure 10. Comparison of experimental and predicted data of carrot in terms of WL and SG.
Fig. 11 shows the lines of (t/WLt) and (t /SGt) versus time at a temperature of 30°C and 1:15 weight to weight vegetable/syrup ratio, at a concentration of 30 wt% and 40 wt% solution for zucchini.
Fig. 12 shows (t/WLt) and (t/SGt) lines versus at a temperature of 50°C and 1:15 weight to weight vegetable/syrup ratio, at a concentration of 40% and 60% wt solution
for turnips.
The experimental values have been compared with the predictions of the Azuara model. The statistical measures of R2 and RMSE have also been used to indicate the appropriate fit of the experimental data with Azuara’s model. These values are listed in the Tables 2 to 4.
Figure 12. Comparison of experimental and predicted data of zucchini in terms of WL and SG.
Table 2
The correlation coefficient and root mean square error for carrots in Azuara model.
T (°C) Concentration
(W/W %) 𝑺𝑮∞ RMSE of SG
R2 Of
SG 𝑾𝑳∞ RMSE of WL R
2 of WL
30 10 0.139 0.015 0.984 0.266 0.065 0.999
30 20 0.328 0.016 0.998 0.355 0.017 0.999
50 10 0.147 0.009 0.998 0.279 0.021 0.998
50 20 0.336 0.008 0.999 0.367 0.014 0.999
Table 3
The correlation coefficient and root mean square error for zucchini in Azuara model.
T (°C) Concentration (W/W %) 𝑺𝑮∞ RMSE of SG R2 Of SG 𝑾𝑳∞
RMSE of
WL R
2 of WL
30 30 0.153 0.005 0.99 0.481 0.017 0.99
30 40 0.182 0.008 0.98 0.658 0.011 0.996
50 30 0.209 0.003 0.999 0.5 0.022 0.971
50 40 0.212 0.003 0.99 0.61 0.03 0.991
Table 4
The correlation coefficient and root mean square error for turnips in Azuara model.
T (°C) Concentratin
(W/W%) 𝑺𝑮∞
RMSE Of SG
R2 Of
SG 𝑾𝑳∞
RMSE Of WL
R2 Of
WL
Des*108
(mm2/min)
Dew*108
(mm2/min)
40 40 0.2005 0.008 0.983 0.655 0.009 0.988 5.305 7.777
40 60 0.207 0.008 0.986 0.869 0.009 0.999 5.241 7.921
50 40 0.213 0.008 0.987 0.66 0.017 0.995 5.243 8.755
Considering the samples to be in the shape of a uniform cylinder with its length (L) being several times longer than its diameter (2R), it can be considered that the mass exchange from the two ends of the cylinder would be negligible compared to its convex surfaces. This cylinder is usually called an infinite cylinder. The movement of moisture and salt in the body of this cylinder can be assumed to be only in the radial direction. The amount of the lost water and the absorbed salts by foods in an infinite cylinder is governed by the Fick's second law in cylindrical coordinates with appropriate boundary conditions as follows [26].
𝑊𝐿∞−𝑊𝐿𝑡
𝑊𝐿∞ = ∑ 𝐵𝑛exp (−μ
2 Dewt
𝑅2 )
∞
𝑛=1 (7)
𝑆𝐺∞−𝑆𝐺𝑡
𝑆𝐺∞ = ∑ 𝐵𝑛exp (−μ
2 Dest
𝑅2 )
∞
𝑛=1 (8)
Where Dew and Des are the effective
diffusion coefficient of water and salt, respectively.
𝐵𝑛 = 4
𝜇𝑛2 (9)
Where the first four 𝜇n values are equal to
μ1=2.4048, μ2=5.5201, μ3=8.6537 and
μ4=11.7915, respectively. It should be noted
that for n> 5 the μ (n +1)-μn is close to pi. Such
μn amounts show that the mentioned series
converges quickly. In other words, the
exponential function exp (−μ2 Dest
𝑅2 ) declines
rapidly and so for small Furrier numbers
(Fo=Dewt
𝑅2 ), it is reasonable to consider just
one term of the above series. Consequently, we get:
ln(𝑀𝑅) = ln (𝑊𝐿∞−𝑊𝐿𝑡
𝑊𝐿∞ ) =
4 𝜇2− (
𝜇2𝐷𝑒𝑤
𝑅2 ) 𝑡 (10)
ln(𝑆𝑅) = ln (𝑆𝐺∞−𝑆𝐺𝑡
𝑆𝐺∞ ) =
4 𝜇2− (
𝜇2𝐷𝑒𝑠
𝑅2 ) 𝑡 (11)
As a result, the effective diffusion coefficient of water (Dew) and salt (Des) are calculated from the slope of the line ln (MR) and ln (SR) versus time [27].
The experimental values have been compared with the outputs of the Azuara model. The statistical measures of R2 and RMSE have also been used to indicate the appropriate fit of the experimental data with the Azuara’s model.
The values of the equilibrium concentrations show that increasing the temperature and concentration of the osmotic solution will lead to increase of water loss and solid gain.
5. Conclusions
It was found that the optimized time based on the maximum WL and minimum SG, was equal to 240 minutes for carrot, 120 minutes for zucchini and 150 minutes for turnip.
This study showed that the temperature and concentration of the osmotic solution were the most significant factors affecting the water loss and solid gain. The solid uptake and water loss increased by increase in the concentration and temperature of the osmotic solution for each agricultural product. For example increasing the temperature from the 300C to 500C caused an increase of SG∞ from 0.139 to 0.147 for
carrots.
each case.
Increasing the vegetable/syrup ratios from 1:15 to 1:10 had no effect on the water loss of the samples but increased the amount of the solid gain.
The Azuara model provided the best fit to the experimental data of the carrot and zucchini while the turnip data were best fitted with the Henderson model.
The root mean square error of the Azuara model for solid gain in different conditions was between 0.014 and 0.065 for carrots, 0.011 and 0.030 for zucchini and 0.008 and 0.014 for turnips. The root mean square error of the Azuara model for water loss in different conditions was between 0.008 and 0.016 for carrots, 0.003 and 0.008 for zucchini and 0.009 and 0.017 for turnips.
List of symbols and Abbreviations Wi Initial weight of sample (g)
Xi moisture of sample i (dimensionless)
initial
Wf at the end of dehydration (g) weight
of sample i
Xf at the end of dehydration
(dimensionless) moisture of sample i SG solid gain (g/100 g fresh vegetable
in dry basis)
SG∞ solid gain at infinite time (g/100 g
fresh vegetable in dry basis)
t time (s)
WL water loss (g/100 g fresh vegetable in dry basis)
WLt water loss at t (g/100 g fresh
vegetable in dry basis)
WL∞ water loss at infinite time (g/100 g
fresh vegetable in dry basis)
β 1 constant related to the flux of water
loss (dimensionless (
β 2 constant related to the flux of solid
gain (dimensionless) R2 correlation coefficient
(dimensionless)
RMSE Root mean square error (dimensionless)
References
[1] Movagharnejad, K. and Nikzad, M., "Modeling of tomato drying using artificial neural network Comput", Electron. Agric.,
59, 78 (2007).
[2] Yadollahinia, A. Latifi, A. and Mahdavi, R., "New method for determination of potato slice shrinkage during drying",
Comput. Electron. Agric., 65, 268 (2009).
[3] Bolin, H. R., "Effects of osmotic agents and concentration on fruit quality",
Food Sch., 48, 202 (1983).
[4] Singh, S. Shivhare, U. S. Ahmed, J. and Raghavan, G. S. V., "Osmotic concentration kinetics and quality of carrot preserve", Food Resear. Intern.,32, 509 (1999).
[5] Sereno, A. M. Moreira, R. and Martinez, E., "Mass transfer coefficients during osmotic dehydration of apple in single and combined aqueous solutions of sugar and salt", Journ. Food Engin., 47, 43 (2001).
[6] Fernandes, F. Rodrigues, S. Gaspareto, O. and Oliveira., E., "Optimization of osmotic dehydration of bananas followed by air-drying", Journ.
Food Engin., 77 ,188 (2006)
[8] Tavakolipour, H. and Zirijany, L., "Banana chips production by hot air and microwave dehydration methods: A comparative study", Middle-East J. Sci. Res., 21 (10), 1828 (2014).
[9] Tortoe, C., "A review of osmo dehydration for food industry", Food Sci., 4, 303 (2010).
[10] Zhou, W. Khin, M. and Perera, C. O., "A study of the mass transfer in coated potato cubes", Food Engin., 77, 84 (2006).
[11] Levic, L. Koprivca, G. Misljenovic, N. Filipcev, B. Smurina, O. and Kuljanin, T., "Effect of starch as an edible coating material on the process of osmotic dehydration of carrot in saccharose solution and sugar beet molasses", Acta. Periodica
Technol., 39, 29 (2008).
[12] Khin, M. Zhou, W. and Perera, C., "Study of the mass transfer in osmotic dehydration of coated potato cubes", J. Food Eng., 77, 4 (2006).
[13] Lazaris, H. N. Mitrakas, G. E. and Matsos, K. I., "Edible coating counter-current product solution contacting, A novel approach to monitoring solids uptake during osmotic dehydration of a model food system", J. Food Eng., 82 , 171 (2007).
[14] Lenart, A., "Osmo-convective drying of fruits and vegetables: technology application", Drying Technol., 14, 391 (1996).
[15] Azuara, E. Cortes, R. Garcia, H. S. and Beristain, C. I., "Kinetic model for osmotic dehydration and its relationship with Fick's second law", Food Sci. Technol., 27, 409 (1992).
[16] Hawkes, J. and Flink, J. M., "Osmotic concentration of fruit slices prior to freeze dehydration", Food Proc. Preserv., 2, 265 (1978).
[17] Soti, M. Sahary, M. and Emam djomeh, Z., "Peaches slices production process optimization using osmosis", Iran. J. Agric. Sci., 34, 283 (2003).
[18] Lazarides, H. N. and Mavroudis. N. F., "Kinetics of osmotic dehydration of a highly shrinking vegetable tissue in a salt-free medium", J .Food Eng., 30, 61 (1996).
[19] Agarry, S. E. Yusuf, R. O. and Owabor, C. N., "Mass transfer in osmotic dehydration of potato: a mathematical model approach", Eng .App.Sci., 3, 190 (2008).
[20] Ispir, A. and Togrul, I. T., "Osmotic dehydration of apricot, kinetics and the effect of process parameters", Chem. Eng. Res. Des., 87, 166 (2009).
[21] Pointing, J. D., "Osmotic dehydration of fruits, recent modifications and applications", Process Biochem., 8, 12 (1973).
[22] Pokharkar, S. M., "Kinetic model for osmotic dehydration of green peas prior to air-drying", Food Sci. Tech., 38, 557 (2001).
[23] Rastogi, N. K. and Raghavarao, K. S., "Mass transfer during osmotic dehydration of pineapple: Fickian diffusion in cubical configuration" LWT-Food Sci. Technol., 37, 43 (2004).
[24] Ertekin, F. K. and Cakaloz, T., "Osmotic dehydration of peas, I. Influence of process variables on mass transfer", Food
Process.Preserv., 20, 87 (1996).
E. and Saravacos, G. D. "Air drying behavior of osmotically dehydrated fruits", Drying
Technol.,13, 1503 (1995).
[26] Crank, J. Mathematics of diffusion. 2nd ed., Oxford University Press, London, (1975).