http: // www.gjesrm.com (C) Global Journal of Engineering Science and Research Management
IMPROVE THE QUALITY OF THE PRODUCT IN AN INDUSTRY USING QUALITY CONTROL
TOOLS AND TECHNIQUES
Arpan Taneja
B.Tech. Mechanical Engineering. Lovely professional University, Phagwara (Punjab) India. *Correspondence Author: [email protected]
Keywords:
QA, QA, Testing.Abstract
This paper is on the aspects of improve the quality of the product in an industry using quality control tools and techniques. Now a day, quality has encompassed an entire organization including all the processes and functions. Quality management has become proactive; making plans to bring about continuous quality improve and to achieve a more desirable future. To survive and remain competitive in the global market, the products are offered at a low price with high quality and reliability by the industries to customers. In this paper study data was collected from the organization with respect to the quality control tools. For the improvement in products or to reduce the defects in products, we use some quality control tools, with the help of this we identify the defects and try to reduce it and Due to this quality of product are increased. Using this approach the organization would balance in appropriate manner that can lead to customer-satisfaction.
Introduction
A defect can be viewed as a failure for any organization. This show that more dedicated efforts are required for quality control and for delivering defect free products in a correctly, timely, and profitable manner. Quality is the ratio of performance to the expectations. A manufacturer is interested in the quality of the product that he has produced. A customer is interested in the quality of the product that he purchases. The way of measuring the quality of the product and detecting changes in it are featured as quality control.
Definition of quality control
Quality control is an industrial management technique by means of which the products of uniform acceptable quality are manufactured, aiming at prevention of defects at every source by setting up freedom of the system and corrective action procedure.
Tools of Quality Control
There are seven basic tools of quality control: (a) Flow Chart
(b) Brain Storming (c) Fishbone Diagram (d) Bar Graph (e) Pareto Analysis (f) Scatter Diagram (g) Stratification.
Pareto analysis
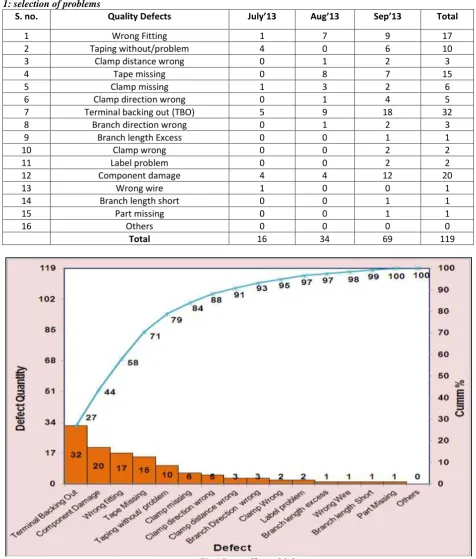
This project is carried out in the company, which is mainly manufacturing different types of wiring harness for different vehicles. Our project work start with identifying the work related problems means finding the defects, and then we decided to make a table and see the defect quantity according to month wise. After these we plot these problems on Pareto charts in descending order.
Pareto Analysis is very helpful in studying a quality problem. It is performed by plotting the cumulative frequencies of the relative frequency data in a descending order. Pareto charts are extremely useful because they can be used to identify those factors that have the greatest cumulative effect on the system.
By Pareto analysis the terminal backing out (TBO) defect is found to be most critical. Due to this defect, wire fitting in the housing is not tight and this may be creating the reason of circuit incomplete. Therefore the objective of this project is to reduce the defect.
Table 1: selection of problems
S. no. Quality Defects July’13 Aug’13 Sep’13 Total
1 Wrong Fitting 1 7 9 17
2 Taping without/problem 4 0 6 10
3 Clamp distance wrong 0 1 2 3
4 Tape missing 0 8 7 15
5 Clamp missing 1 3 2 6
6 Clamp direction wrong 0 1 4 5
7 Terminal backing out (TBO) 5 9 18 32
8 Branch direction wrong 0 1 2 3
9 Branch length Excess 0 0 1 1
10 Clamp wrong 0 0 2 2
11 Label problem 0 0 2 2
12 Component damage 4 4 12 20
13 Wrong wire 1 0 0 1
14 Branch length short 0 0 1 1
15 Part missing 0 0 1 1
16 Others 0 0 0 0
Total 16 34 69 119
Fig.1 Pareto Chart of defects
Flow chart
http: // www.gjesrm.com (C) Global Journal of Engineering Science and Research Management
creating problem and we mark this area and start working on it. Here red doted highlighted area is problem generated area. Below we see that flow chart of sub assembly (S/A) and final assembly (F/A) processes:
Fig2. Flow Chart of Sub Assembly and Final Assembly Process
Stratification
Stratification is the separation of data into categories and is used to identify categories contributing to the problem being solved and category worth consideration for further investigation. It is an analysis technique that helps to pinpoint the location or source of quality problem. We collect the data with respect to the defect terminal backing out (TBO) from the company and separate into month wise. Here we see that in July ’13, the quantities of defects are 5 and in august’13, quantities of defects are 9. Here we show that the bar graph of defects quantity with respect to the month.
O
Fig3. Stratification Chart of TBO data
4 1 3 6 8
10
0 5 10 15
A B A B A B
Q
u
an
ti
ty
Shift
shift wise TBO Data
5 9
18
0 5 10 15 20
July'13 Aug'13 Sep'13
Q
u
an
ti
ty
Month
Cause and effect diagram
The Pareto diagram reveals major defects in wiring harness. This phase is extremely important in order to determine any disparity that may exist in the goals set and the current performance levels achieved. Various statistical tools are available to undertake such an analysis. We assist by making suggestions and eventually, the entire diagram is filled out. By the use of brainstorming, we develop a wide variety of possible causes of problem to narrow down the potential cause before taking corrective action. The understanding of the relationship between cause and effect is necessary to bring about any improvements
Fig4. Cause and effect diagram
Result and discussion
It has been observed that the defects are arises due to some mistakes in drawing and method of working by the unskilled worker. Before this project, average quantity of defect is 10. In starting we identify area where defects arise in manufacturing of wiring harness and then find out the reason of defect. After these we done small changes in assembly drawing, due to these amount of defects are reduce. For the more improvement in the product quality, we train the worker and give some tips of how to work in term of industrial engineering. After doing these changes in the process the average quantity of defects reduce from 10 to 1. Graph represents the quantity of defects with respect to the month.
0 5 10 15 20
July'13 Aug'13 Sep'13 Oct'13 Nov'13 Dec'13 Jan'13
Q
ua
nt
it
y
Month
Result of TBO
http: // www.gjesrm.com (C) Global Journal of Engineering Science and Research Management
Conclusion
By using quality control tools and techniques, we introduced some changes in the previous process of manufacturing wiring harness. With the help of these changes, defect rate in the manufacturing of wiring harness was decreased to almost zero, this result into no delay in delivery and improved customer satisfaction. This quality improvement methodology shows that the performance of the company is increased to a better level as regards to enhancement in customer satisfaction.
References
1. Ms. Disha M nayak, Vijaya kumar M N, Ms. Veena Shankar, Dr. NS Narahari, ”MEASURING QUALITY
MANAGEMENT SYSTEM MATURITY IN A CABLE MANUFACTURING UNIT,USING EFOQ EXCELLENCE MODEL”, Industrial Engineering journal, Vol. 7, 2014.
2. Ahire, S. L., & Golhar, D. Y(2001). Quality management in large verus small firms. Journal of small business management, 27, 1-13.
3. Beaumont, N.B., & Sohal, A.S(1999). Quality management in Australian service industries. Benchmarking; An international Journal, 6(2), 107-204.
4. Bisgaard, S. 1993. Statistical tools for Manufacturing. Manufacturing Review.6 (3); 192-200.
5. Montgomery, D.C., Introduction to Statistical Quality control, 3rd Ed., J. Wiley, New York, P.677, 1996.
6. Feigenbaum, A.V. (1983). Quality Control (3rd Ed.) New York; McGraw-Hill.
7. GAO Study (1991). Report to the house of Representatives on management Practices, US Companies improve
performance through Quality Efforts. United States General Accounting Office, Washington, DC.