D E B A T E
Open Access
One statistical test is sufficient for assessing new
predictive markers
Andrew J Vickers
1*, Angel M Cronin
2, Colin B Begg
1Abstract
Background:We have observed that the area under the receiver operating characteristic curve (AUC) is
increasingly being used to evaluate whether a novel predictor should be incorporated in a multivariable model to predict risk of disease. Frequently, investigators will approach the issue in two distinct stages: first, by testing whether the new predictor variable is significant in a multivariable regression model; second, by testing differences between the AUC of models with and without the predictor using the same data from which the predictive models were derived. These two steps often lead to discordant conclusions.
Discussion:We conducted a simulation study in which two predictors,X andX*, were generated as standard normal variables with varying levels of predictive strength, represented by means that differed depending on the binary outcomeY. The data sets were analyzed using logistic regression, and likelihood ratio and Wald tests for the incremental contribution ofX* were performed. The patient-specific predictors for each of the models were then used as data for a test comparing the two AUCs. Under the null, the size of the likelihood ratio and Wald tests were close to nominal, but the area test was extremely conservative, with test sizes less than 0.006 for all
configurations studied. WhereX*was associated with outcome, the area test had much lower power than the
likelihood ratio and Wald tests.
Summary:Evaluation of the statistical significance of a new predictor when there are existing clinical predictors is most appropriately accomplished in the context of a regression model. Although comparison of AUCs is a conceptually equivalent approach to the likelihood ratio and Wald test, it has vastly inferior statistical properties. Use of both approaches will frequently lead to inconsistent conclusions. Nonetheless, comparison of receiver operating characteristic curves remains a useful descriptive tool for initial evaluation of whether a new predictor might be of clinical relevance.
Background
In determining whether a patient does have or will have a medical condition or outcome - respectively, diagnosis and prognosis- doctors can generally make use of clini-cal or laboratory data than are of proven predictive value. It has been argued that, when evaluating a novel predictor, the key question is whether it offers superior predictive accuracy to these established variables [1,2]. For example, the risk of cancer recurrence is known to be associated with clinical characteristics such as tumor size, cancer stage, lymph node involvement and possibly other factors. Any evaluation of the merit of, say, a new
biomarker needs to take into account the abilities of the known clinical predictors. An appropriate study of this issue involves the comparison of the accuracy of a pre-dictive model including only the established clinical variables with the accuracy of a model that included both the established variables and the new marker.
The advent of countless novel biomarkers in medical research has led to a large literature of studies seeking to test the value of these new markers as predictors of medical outcomes. Because of widespread concerns about the dangers of inappropriate uses of statistical methods in this setting, many prominent methodologists and subject matter experts have published articles seek-ing to provide advice on how to conduct these studies [1-6]. There is broad agreement that it is of value to determine incremental discriminative ability of the new * Correspondence: [email protected]
1
Department of Epidemiology and Biostatistics Memorial Sloan-Kettering Cancer Center 1275 York Avenue, Box 44, New York, NY 10065 USA Full list of author information is available at the end of the article
marker, using comparisons of the area under the recei-ver operating characteristic (AUC) curve or c-index [1] of the predictive model with and without the new mar-ker. Although all of these experts stop short of advocat-ing that discrimination be compared usadvocat-ing widely available tests for comparing AUCs [7,8], the advocacy of this type of comparison seems to have led many investigators to believe that such formal comparisons are indeed the recommended approach. Our article addresses the propriety of this strategy.
Discussion
We define r(X) as a predictive model for a disease state
Din which X corresponds to one or more established clinical and biological markers. If X*designates a new marker, our goal is to assess whether X* adds to the predictive accuracy that is already available from X. Thus, our question about the value of X* involves a comparison of r(X) to r(X, X*) rather than a comparison of r(X) to r(X*). That is, we wish to know the incremen-tal increase in accuracy due toX*. The setting in which one wants to consider the addition of a new marker to an existing set of markers is known as a nested model.
There are two general approaches that are used fre-quently to compare the incremental effect of a new pre-dictor in the context of a nested model. In the first, the novel marker is added to a regression model that includes the established markers. The new marker is accepted as having predictive value if it is significantly associated with outcome in the multivariable model, after adjusting for established markers; if so, the marker is commonly referred to being an “independent” predic-tor of outcome. In the second approach, the area under the receiver operating characteristic (ROC) curve (AUC) or c-index is calculated for each of the two predictive models, r(X) and r(X, X*), and the two AUC’s compared. The fact that expert commentaries on this issue advo-cate this comparison without reference to statistical test-ing suggest that they have intended the comparison to represent an informal judgment of the increase in incre-mental accuracy[2-6], that is, the recommendation is to use a comparison of AUC’s for estimation. Nonetheless, there are well known and widely-used statistical tests for comparing diagnostic accuracy[7,8], and so increasingly investigators have elected to use these as formal tests for incremental accuracy in the context of comparing predictive models[9-14].
We have observed that it is often the case in such reports that the novel marker has been found to be sta-tistically significant in the multivariable model including established markers, but has been reported to have a non-significant effect on predictive accuracy on the basis of tests comparing the two AUCs. For instance, Folsom et al.[15] looked at various novel markers to
predict coronary heart disease, and tested whether these markers added incremental value to a standard predic-tive model that included age, race, sex, total cholesterol, high density lipoprotein, blood pressure, antihyperten-sive medications, smoking status, and diabetes. For each marker, the authors reported both the p value for the marker in the multivariable model, and apvalue for the difference in AUC between the standard model and the standard model plus the new marker. As an exam-ple, interleukin 6 was reported to be a statistically signif-icant independent predictor of outcome (p=0.03), but the increase in AUC, from 0.773 to 0.783 was reported to be non-significant. Similarly, Gallina and colleagues [16] investigated whether body mass index could help predict high-grade prostate cancer. They reported that although body mass index was statistically significant (p=0.001) in a multivariable model including clinical stage, prostate volume, and total and free prostate speci-fic antigen, the increase in AUC (from 0.718 for the standard predictors to 0.725 for the standard predictors plus body mass index) was non-significant (p=0.6).
In considering the contribution of a new marker in the context of established markers we are interested in the incremental improvement in predictive accuracy that the new marker can deliver. What do we mean by incremental predictive accuracy? A new predictor can only provide additional information if it is associated with the outcome, conditional on the existing predictors. Consequently, we are fundamentally interested in testing for conditional independence between the new predic-tor, X*, and the outcome,Y, conditional on the estab-lished predictors, X. If X* and Y are associated, conditional onX, then there is information that can be potentially utilized to improve the prediction. In other words, in constructing a test for incremental informa-tion, the conceptual null hypothesis is that there is no useful information inX*for predictingYonce the infor-mation inXis taken into account.
by X. However, both are essentially testing the same conceptual null hypothesis, the hypothesis that there is no conditional association between X* andY, given X, and thus no potentially useful incremental information inX* for the purposes of predictingY.
Consider now approaching this issue in the setting of an ROC analysis. Again, there are different options for formulating the null hypothesis. A logical choice is to construct a test of the hypothesis that the ROC curve mapped by the predictor from the model r(X) is identi-cal to the ROC curve mapped by the predictor from the model r(X, X*). Indeed tests of this nature are available [17]. However, by far the most common approach is to focus on the areas under the ROC curves from these two models [8]. The null hypothesis is that the areas, denoted AUC(X) and AUC(X,X*), are identical. These two null hypotheses are not the same, but they both conform to our conceptual null hypothesis, namely that
X* does not add incremental information to the predic-tive ability of the model formed using Xalone. Investi-gators who have used this approach have typically taken the patient-specific risk predictors from the two models, and used these as data elements both for estimating the ROC curves and as data for conducting the test compar-ing ROC areas.
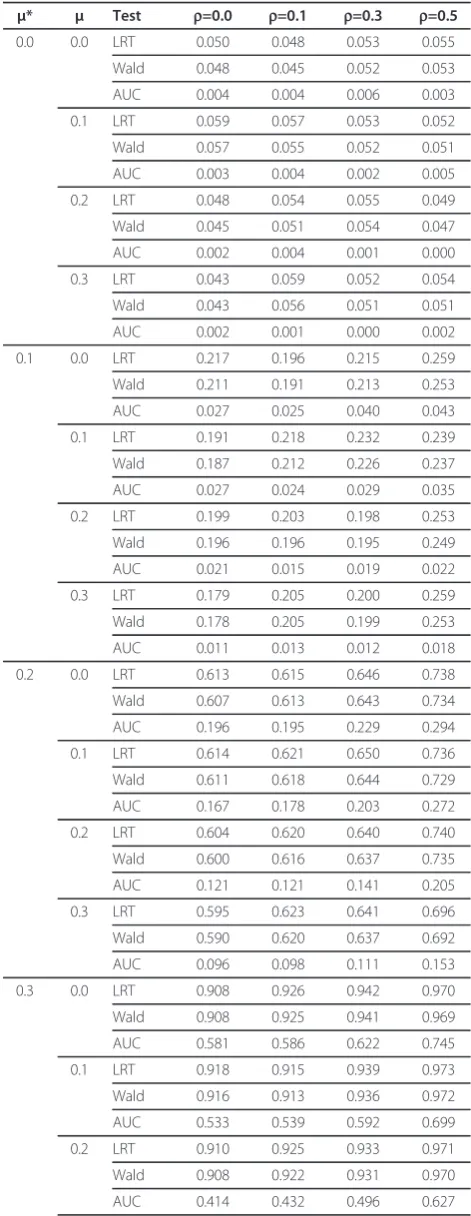
To our knowledge, little work has been done to esti-mate the power of regression models for detecting incremental predictive accuracy in comparison to the power of corresponding tests for the AUCs. We con-ducted a simulation study in which the two predictors, X and X*, were generated as standard normal variables with varying levels of predictive strength, represented by means that differed depending on the binary outcome Y. The difference in means between Y = 1 and Y = 0 for X and X* are represented by μ and μ*respectively and were varied between 0 (i.e. the null) and 0.3. X and X* were generated both independently (i.e. with a corre-lation ofr = 0.0) and for the correlationsr = 0.1, r= 0.3 and r = 0.5. The data sets were analyzed using logistic regression, and likelihood ratio and Wald tests for the incremental contribution of X* were performed. The patient-specific predictors for each of the models were then used as data for a test comparing the two AUCs, using the popular area test proposed by Delong et al. [8]. The algorithm used for the simulation is pro-vided in the Appendix. The results for a study with n=500 and an outcome prevalence of 0.5 are presented in Table 1. The first set of rows represent test size, i.e. the setting in which X* contributes no incremental pre-dictive accuracy (represented by μ*=0). Here we see that both the likelihood ratio and Wald test have test size close to the nominal 5%. By contrast the DeLong test of
Table 1 Simulation results for n=500, prevalence at 20%
μ* μ Test r=0.0 r=0.1 r=0.3 r=0.5
0.0 0.0 LRT 0.050 0.048 0.053 0.055
Wald 0.048 0.045 0.052 0.053
AUC 0.004 0.004 0.006 0.003
0.1 LRT 0.059 0.057 0.053 0.052
Wald 0.057 0.055 0.052 0.051
AUC 0.003 0.004 0.002 0.005
0.2 LRT 0.048 0.054 0.055 0.049
Wald 0.045 0.051 0.054 0.047
AUC 0.002 0.004 0.001 0.000
0.3 LRT 0.043 0.059 0.052 0.054
Wald 0.043 0.056 0.051 0.051
AUC 0.002 0.001 0.000 0.002
0.1 0.0 LRT 0.217 0.196 0.215 0.259
Wald 0.211 0.191 0.213 0.253
AUC 0.027 0.025 0.040 0.043
0.1 LRT 0.191 0.218 0.232 0.239
Wald 0.187 0.212 0.226 0.237
AUC 0.027 0.024 0.029 0.035
0.2 LRT 0.199 0.203 0.198 0.253
Wald 0.196 0.196 0.195 0.249
AUC 0.021 0.015 0.019 0.022
0.3 LRT 0.179 0.205 0.200 0.259
Wald 0.178 0.205 0.199 0.253
AUC 0.011 0.013 0.012 0.018
0.2 0.0 LRT 0.613 0.615 0.646 0.738
Wald 0.607 0.613 0.643 0.734
AUC 0.196 0.195 0.229 0.294
0.1 LRT 0.614 0.621 0.650 0.736
Wald 0.611 0.618 0.644 0.729
AUC 0.167 0.178 0.203 0.272
0.2 LRT 0.604 0.620 0.640 0.740
Wald 0.600 0.616 0.637 0.735
AUC 0.121 0.121 0.141 0.205
0.3 LRT 0.595 0.623 0.641 0.696
Wald 0.590 0.620 0.637 0.692
AUC 0.096 0.098 0.111 0.153
0.3 0.0 LRT 0.908 0.926 0.942 0.970
Wald 0.908 0.925 0.941 0.969
AUC 0.581 0.586 0.622 0.745
0.1 LRT 0.918 0.915 0.939 0.973
Wald 0.916 0.913 0.936 0.972
AUC 0.533 0.539 0.592 0.699
0.2 LRT 0.910 0.925 0.933 0.971
Wald 0.908 0.922 0.931 0.970
the AUCs is exceptionally conservative, with a test size far below nominal. Power comparisons in the rest of the table show that the likelihood ratio test and the Wald test have similar power but both are far superior to the AUC test. Further, the likelihood and Wald tests are largely unaffected by the underlying strength of the baseline predictive model (represented by μ), while the power of the area test diminishes as the underlying AUC increases (again represented by μ). Power for all tests increases with greater correlation between μ and μ*.
We repeated our analyses varying the prevalence (0.2 and 0.05) and sample size (n=100). Our results were essentially unaffected. Lowering the sample size or pre-valence reduced power for all analyses, but the Wald and likelihood ratio tests always had far superior power to the AUC test.
Summary
We have shown that a test of a new marker in a predic-tion regression model and a test of predicpredic-tion accuracy constructed from a comparison of ROC AUCs are designed to test the same conceptual null hypothesis, the hypothesis that the new marker possesses no incre-mental predictive information. The use of two tests side by side to address the same hypothesis is not logical, and if we require both tests to be significant such a strategy necessarily has the effect of decreasing the power for detecting an improvement in predictive accu-racy. We have also shown that testing ROC areas gener-ated from nested models is an approach with serious validity problems.
What is the correct approach? In our opinion, investi-gators should select a single test for assessing incremen-tal predictive accuracy. The choice of test depends on the data context, but tests of the incremental predictive information in the new marker in the context of the regression model, such as the likelihood ratio test and the Wald test, have well understood and valid statistical properties under the defined sampling properties of the model. Likewise, the area test of Delong et al. [8] has been shown to have valid statistical properties in the context for which it was developed, that is, the compari-son of two dependent diagnostic markers[17]. But ROC
analysis was not developed for the purpose of testing new predictors in nested models. ROC analysis was cre-ated as a technique to appropriately calibrate compari-sons of the accuracy of two or more ordinal diagnostic procedures [18]. In this setting, where the empirical classification points for each of the tests are not under the control of the analyst, ROC methods are needed to extrapolate the results of each of the diagnostic (or pre-dictive) tests to permit a calibrated comparison. The use of ROC AUCs is a natural outgrowth of this work, in that the AUC is summary measure that is inherently calibrated for comparison purposes [19]. Subsequent work generalized these methods to incorporate compari-sons of continuous (rather than ordinal) tests, such as two distinct laboratory tests[20].
However, we have shown that ROC methods are not appropriate for testing the incremental value of new predictors in the presence of established predictors (i.e. in a“nested” setting) where the patient-specific predic-tors from the model are used as the data for the ROC analysis. There are several possible reasons why the area test is so inferior in this context. Our intuition is that a principal reason is that the use of patient-specific pre-dictors from the estimated model as data ensures that the estimated ROC curve is biased upwards [21]. This is a well-known phenomenon that had led to the wide-spread recognition that predictive models need to be validated in independent test sets, or minimally by using cross-validation techniques. Since the bias is strongly correlated in the two nested models the validity of the test is further compromised.
Naturally, novel ROC methods might be developed that overcome the problems associated with the De Long et al. test in this context. Such novel methods could be formally evaluated in future research. Nonethe-less, the validity or otherwise of these methods would not affect our main conclusion that using both an ROC test and a test of a new marker in a predictive model is double-testing the same conceptual null hypothesis and that, accordingly, investigators should select a single test for assessing incremental predictive accuracy.
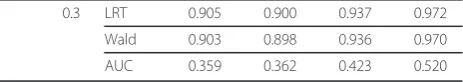
Several previous authors have pointed out that AUC comparisons are underpowered. Pencina, for example, states that “very large‘independent’associations of the new marker with the outcome are required to result in a meaningfully larger AUC”[22]. Indeed, this observation was the motivation for the novel ‘net reclassification index’ method. Similarly, in a comprehensive review, Cook argued that the AUC is “insensitive” and“can erroneously eliminate important clinical risk predic-tors”[23]. These considerations appear to be based lar-gely on practical experience and case studies. Previous authors made no formal investigations of the statistical properties of area tests nor documented clearly that Table 1 Simulation results for n=500, prevalence at 20%
(Continued)
0.3 LRT 0.905 0.900 0.937 0.972
Wald 0.903 0.898 0.936 0.970
AUC 0.359 0.362 0.423 0.520
comparison of ROC areas for nested models is highly conservative. We believe that the huge power and size deficiencies of the AUC test in this context, demon-strated in our simulations, are not widely known to methodologists.
The ROC curve, a descriptive tool, adds insight in that it allows one to identify and compare the sensitivities of the predictive models at chosen specificities, and vice versa, and for gauging the magnitude of any apparent increase in accuracy. ROC curves are useful for charac-terizing the predictive accuracy of competing predictive models, even nested models, as numerous commenta-tors have advocated. But its role in this setting is descriptive, and it is imperative that cross-validated data or independent data from external data sets be used for this purpose. Elsewhere it has been argued that ROC curves are inadequate for assessing prediction models, including the question of whether new markers are informative [6,24]. Simple, decision analytic approaches have also been advocated [25-27]. Such positions are not inconsistent with our advice here. We suggest a staged approach, with analysis of the value of a new pre-dictor first involving assessment of independent statisti-cal significance of the predictor within a predictive model, then increment in AUC and, finally, impact on decision making[6].
In summary, we advise against the use of double-testing new predictors for predictive accuracy in the presence of existing predictors. This strategy involves essentially testing the same conceptual null hypothesis twice, disrupting the validity of the reported significance levels. Further, the use of tests based on ROC curves generated from the estimated patient-specific risk pre-dictors without cross-validation has been shown to be technically flawed. However, ROC curves are useful as tools for describing the rate of false positive and false negative errors.
Appendix
Simulation approach
Independent Predictors
Simulations were conducted to test the power of the likelihood ratio test, the Wald test and a comparison of areas-under-the-curves. In this first set of simulations,X and X* are independent normal random variables. Among subjects who experience the outcome (y=1),X has a normal distribution with mean μand variance 1, and X* has mean μ* and variance 1. Among non-responders, x and x* are both drawn independently from a standard N(0,1) distribution. We first determine
π, the overall probability of response (which was set at 0.5 in all our simulations), and n, the total sample size (which was set at 500).
Data Generation For each of n patients generate data as
follows:-1. Generate y: Sample from U(0,1), set y=1 if U (0,1)<π and set y=0 otherwise.
2. If y=1, sample X from N(μ,1) andX* from N(μ*, 1). 3. If y=0, sample X from N(0,1) andX* from N(0, 1).
Data Analysis4. Analyze the restricted model using the logistic regression logit(y) =b0 +b1X
5. Use the estimates ofb0 andb1from the model to
calculate z=∧ +∧ X
0 1 . Note that the true value of
b1 =μandb0 =0.5μ2+log(π÷ (1-π)).
6. Calculate the area under the ROC curve linking y and z
7. Analyze the expanded model using the logistic regression logit(y) =b0+b1X+b2X*
8. Calculate a p-value for H:b2 = 0 using the
likeli-hood ratio test and the Wald test.
9. Use the estimates ofb0,b1and b2from the model
to calculate z=∧ +∧ X+∧ X
0 1 2 *
10. Calculate the area under the ROC curve linking y and z
11. Calculate the DeLong et al. p-value comparing the area estimates from 6 and 10 above.
Simulation
12. Repeat the entire process from 1-11 above 2000 times and compute the relative frequency of signifi-cant (P < 0.05) p-values.
13. Do this forμ*=0 to estimate the test size, and for larger values ofμ* to assess a range of powers. 14. Repeat the process for a range of values ofμ. Dependent Predictors
In this dependent setting, among subjects who experi-ence the outcome (y=1), x and x* are both normally dis-tributed with unconditional variances equal to 1, means
μ and μ* respectively, and with correlation r. Among non-responders, the means of both X and X* are zero and the correlation isr.
Data Generation For each of n patients generate data as
follows:-1. Generate y: Sample from U(0,1), set y=1 if U(0,1) <π and set y=0 otherwise.
2. If y=1, sampleX from N(μ,1) and X* from N(μ* +rX,1-p2).
3. If y=0, sampleX from N(0,1) and X* from N(rX, 1-p2).
Data Analysis4. Analyze the restricted model using the logistic regression logit(y) =b0 +b1X
5. Use the estimates ofb0 andb1from the model to
calculate z=∧ +∧ X
6. Calculate the area under the ROC curve linking y and z
7. Analyze the expanded model using the logistic regression logit(y) = b0+b1X+b2X*
8. Calculate a p-value for H: b2 = 0 using the
likeli-hood ratio test and the Wald test.
9. Use the estimates ofb0,b1and b2from the model
to calculate z=∧ +∧ X+∧ X
0 1 2 *
10. Calculate the area under the ROC curve linking y and z
11. Calculate the DeLong et al. p-value comparing the area estimates from 6 and 10 above.
Simulation
12. Repeat the entire process from 1-11 above and compute the relative frequency of significant (P < 0.05) p-values.
13. Do this for μ*=0 to estimate the test size, and for larger values ofμ* to assess a range of powers. 14. Repeat the process for a range of values ofμ.
Abbreviations
ROC: Receiver operating characteristic curve; AUC: Area under the curve.
Acknowledgements
Supported in part by funds from David H. Koch provided through the Prostate Cancer Foundation, the Sidney Kimmel Center for Prostate and Urologic Cancers, the P50-CA92629 SPORE grant from the National Cancer Institute to Dr. P. T. Scardino and an NCI grant on predictive modeling (CA136783). The funding body had no role in study design; in the collection, analysis, and interpretation of data; in the writing of the manuscript; or in the decision to submit the manuscript for publication.
The authors would like to acknowledge the contribution of Mithat Gonen and Venkatraman Seshan who provided important insights on the operating characteristics of the tests, and to Margaret Pepe and Stuart Baker who offered valuable insights on earlier versions of the paper.
Author details
1Department of Epidemiology and Biostatistics Memorial Sloan-Kettering Cancer Center 1275 York Avenue, Box 44, New York, NY 10065 USA.2Center for Outcomes and Policy Research Dana Farber Cancer Institute Boston, Massachusetts USA.
Authors’contributions
The study was conceived and written by AJV and CBB. AMC conducted the simulation studies. All authors read and approved the final manuscript.
Competing interests
The authors declare that they have no competing interests.
Received: 29 April 2010 Accepted: 28 January 2011 Published: 28 January 2011
References
1. Harrell FE Jr, Califf RM, Pryor DB, Lee KL, Rosati RA:Evaluating the yield of medical tests.JAMA1982,247(18):2543-2546.
2. Kattan MW:Judging new markers by their ability to improve predictive accuracy.J Natl Cancer Inst2003,95(9):634-635.
3. Pepe MS, Janes H, Longton G, Leisenring W, Newcomb P:Limitations of the odds ratio in gauging the performance of a diagnostic, prognostic, or screening marker.Am J Epidemiol2004,159(9):882-890.
4. Cook NR:Statistical evaluation of prognostic versus diagnostic models: beyond the ROC curve.Clin Chem2008,54(1):17-23.
5. Hlatky MA, Greenland P, Arnett DK, Ballantyne CM, Criqui MH, Elkind MS, Go AS, Harrell FE Jr, Hong Y, Howard BV,et al:Criteria for evaluation of novel markers of cardiovascular risk: a scientific statement from the American Heart Association.Circulation2009,119(17):2408-2416. 6. Steyerberg EW, Vickers AJ, Cook NR, Gerds T, Gonen M, Obuchowski N,
Pencina MJ, Kattan MW:Assessing the performance of prediction models: a framework for traditional and novel measures.Epidemiology2010,
21(1):128-138.
7. Hanley JA, McNeil BJ:A method of comparing the areas under receiver operating characteristic curves derived from the same cases.Radiology 1983,148(3):839-843.
8. DeLong ER, DeLong DM, Clarke-Pearson DL:Comparing the areas under two or more correlated receiver operating characteristic curves: a nonparametric approach.Biometrics1988,44(3):837-845.
9. Jansen FH, van Schaik RH, Kurstjens J, Horninger W, Klocker H, Bektic J, Wildhagen MF, Roobol MJ, Bangma CH, Bartsch G:Prostate-Specific Antigen (PSA) Isoform p2PSA in Combination with Total PSA and Free PSA Improves Diagnostic Accuracy in Prostate Cancer Detection.Eur Urol 2010,57(6):921-7.
10. Mitchell DG, Snyder B, Coakley F, Reinhold C, Thomas G, Amendola MA, Schwartz LH, Woodward P, Pannu H, Atri M,et al:Early invasive cervical cancer: MRI and CT predictors of lymphatic metastases in the ACRIN 6651/GOG 183 intergroup study.Gynecol Oncol2009,112(1):95-103. 11. Kaptoge S, Armbrecht G, Felsenberg D, Lunt M, O’Neill TW, Silman AJ,
Reeve J:When should the doctor order a spine X-ray? Identifying vertebral fractures for osteoporosis care: results from the European Prospective Osteoporosis Study (EPOS).J Bone Miner Res2004,
19(12):1982-1993.
12. Pierorazio P, Desai M, McCann T, Benson M, McKiernan J:The relationship between preoperative prostate-specific antigen and biopsy Gleason sum in men undergoing radical retropubic prostatectomy: a novel
assessment of traditional predictors of outcome.BJU Int2009,
103(1):38-42.
13. Adabag AS, Rector T, Mithani S, Harmala J, Ward HB, Kelly RF, Nguyen JT, McFalls EO, Bloomfield HE:Prognostic significance of elevated cardiac troponin I after heart surgery.Ann Thorac Surg 2007,83(5):1744-1750.
14. McCullough PA, Nowak RM, McCord J, Hollander JE, Herrmann HC, Steg PG, Duc P, Westheim A, Omland T, Knudsen CW,et al:B-type natriuretic peptide and clinical judgment in emergency diagnosis of heart failure: analysis from Breathing Not Properly (BNP) Multinational Study.
Circulation2002,106(4):416-422.
15. Folsom AR, Chambless LE, Ballantyne CM, Coresh J, Heiss G, Wu KK, Boerwinkle E, Mosley TH Jr, Sorlie P, Diao G,et al:An assessment of incremental coronary risk prediction using C-reactive protein and other novel risk markers: the atherosclerosis risk in communities study.Arch Intern Med2006,166(13):1368-1373.
16. Gallina A, Karakiewicz PI, Hutterer GC, Chun FK, Briganti A, Walz J, Antebi E, Shariat SF, Suardi N, Graefen M,et al:Obesity does not predispose to more aggressive prostate cancer either at biopsy or radical prostatectomy in European men.Int J Cancer2007,121(4):791-795. 17. Venkatraman ES, Begg CB:A distribution-free procedure for comparing
receiver operating characteristic curves from a paired experiment.
Biometrika1996,83(4):835-848.
18. Metz CE:Basic principles of ROC analysis.Semin Nucl Med1978,
8(4):283-298.
19. Swets JA, Pickett RM:Evaluation of Diagnostic Systems: Methods from Signal Detection TheoryNew York: Academic Press; 1982.
20. Wieand HS, Gail MH, James BR, James KL:A family of nonparametric statistics for comparing diagnostic markers with paired or unpaired data.Biometrika1989,76(3):585-592.
21. Steyerberg E:Clinical Prediction Models: A Practical Approach to Development, Validation, and UpdatingNew York: Springer; 2009.
22. Pencina MJ, D’Agostino RB Sr, D’Agostino RB Jr, Vasan RS:Evaluating the added predictive ability of a new marker: from area under the ROC curve to reclassification and beyond.Stat Med2008,27(2):157-172, discussion 207-112.
24. Vickers AJ, Cronin AM:Traditional statistical methods for evaluating prediction models are uninformative as to clinical value: towards a decision analytic framework.Semin Oncol2010,37(1):31-38. 25. Vickers AJ, Cronin AM, Elkin EB, Gonen M:Extensions to decision curve
analysis, a novel method for evaluating diagnostic tests, prediction models and molecular markers.BMC Med Inform Decis Mak2008,8:53. 26. Vickers AJ, Elkin EB:Decision curve analysis: a novel method for
evaluating prediction models.Med Decis Making2006,26(6):565-574. 27. Baker SG, Cook NR, Vickers A, Kramer BS:Using relative utility curves to
evaluate risk prediction.J R Stat Soc Ser A Stat Soc2009,172(4):729-748.
Pre-publication history
The pre-publication history for this paper can be accessed here: http://www.biomedcentral.com/1471-2288/11/13/prepub
doi:10.1186/1471-2288-11-13
Cite this article as:Vickerset al.:One statistical test is sufficient for assessing new predictive markers.BMC Medical Research Methodology
201111:13.
Submit your next manuscript to BioMed Central and take full advantage of:
• Convenient online submission
• Thorough peer review
• No space constraints or color figure charges
• Immediate publication on acceptance
• Inclusion in PubMed, CAS, Scopus and Google Scholar
• Research which is freely available for redistribution