The Effects of Monetary Policy Determinants on
Export in BRICS-T countries: An Empirical
Analysis
Zeynep Karaçor1, and Sevilay Konya2
1
Economics, Selçuk University, Konya, Turkey
2
Management and Organization, Selçuk University, Konya, Turkey
Abstract
Monetary policy implementations lead the countries' economic future. Exchange rate increases in recent years have been important in determining monetary policy. Therefore, it was inevitable not to have countries' exports, imports and foreign trade affect from this. In this study, the effect of monetary policy determinants (economic growth, exchange rates, inflation, money supply, interest rate) in Brazil, Russia, India, China, South Africa and Turkey (BRICS-T) on export, is analyzed. In the study, quarter data were used for 1996q1-2018q2 period. According to causality analysis of Dumitrescu and Hurlin (2012), a bi-directional causality is found between economic growth-export, inflation-growth-export, money supply-export and interest rate-export. However, one-way causality was found from exchange rate to exports.
Keywords: Monetary policy, export, BRICS-T
1. Introduction
BRIC (Brazil, Russia, India, China) comes to mind as the fastest growing economies as of the beginning of the 2000s. It is called the center of the world's fastest developing markets (Kalaycı, 2011: 90). This abbreviation was first used by O’Neil (2001) from Goldman Sachs institution. Today, South Africa is included in this abbreviation. However, in the study, economic analysis process in Turkey is included with this group of countries. Central banks have raised various policies in order to ensure price stability. Monetary policies vary from country to country according to the socio-economic status of countries and the position of the central bank. While central banks try to achieve price stability in the long term through the monetary policies they implement, they are
monitoring interest rates and exchange rates using real variables such as short-term growth and unemployment, and determine their policies. In the economies where inflation has reached a high level, policies for educing inflation can be applied (Acet, Güvenek and Soydal, 2006: 502-503).
In accordance with these explanations, the purpose of this study is to research the effects of the variables identified as monetary policy determinants on exports. Quarterly data were used for the period 1996q1-2018q2. In the first part of the study, after a brief review of the literature, the data used in the second section and the econometric method will be discussed. In the third chapter, empirical results found after econometric methods are given. In the final section, the study will be concluded with a general evaluation.
2
. Literature Summary
This study researches the effects of growth, exchange rate, interest rate, inflation and money supply on exports. There is no study in which all variables are combined. However, the studies expressed on the foreign trade of each variable will be discussed and discussed in this section.
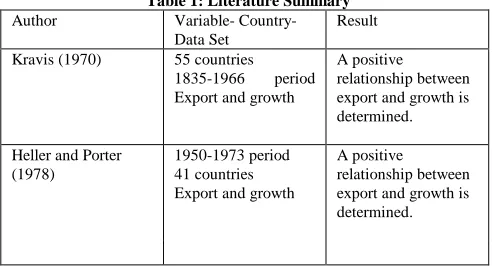
Table 1: Literature Summary
Author Variable-
Country-Data Set
Result
Kravis (1970) 55 countries
1835-1966 period Export and growth
A positive relationship between export and growth is determined.
Heller and Porter (1978)
1950-1973 period 41 countries Export and growth
Arize (1994) 1973Q1-1991Q1
Nine Asian economies
Real exchange rate
and foreign trade
balance
Real exchange rate has a positive and significant effect on foreign trade is found
In and Menon (1996) 7 OECD (Germany, France, Japan, Italy, UK, Canada and USA) Countries real exchange rate-export-import
A causality relationship from foreign trade terms to real currency is found in France, Japan, UK, Canada and the US. Besides, a causal relationship to exchange rate in other words a full reverse causality is found in Germany and Italy.
Shirvani and Wilbratte (1997)
1973: 5-1990: Monthly data in 8 G7 countries (Canada, France, Germany, Italy, Japan, U.K. and U. S.)
foreign trade balance and real exchange rate
As a result of the study, it has been determined that exchange rates have a significant effect on foreign trade balance in short term.
Ay, Erdoğan and Mucuk (2003)
1996-2002 Turkey
Export and growth
According to Granger causality analysis, they determined bilateral causality between export and growth. . Bayraktutan and Arslan (2003) 1980-2000 Turkey Foreign exchange, import and inflation
They determined that both the exchange rate and the effect of inflation on imports were negative and meaningful..
Alsu (2006) Turkey
1985-2005
Real exchange rates, interest rates, inflation rates, foreign trade
It is found that the changes in CPI, interest rate and exchange rates effect foreign trade.
Alptekin (2009) Turkey
1992:1-2009:1
Real foreign
exchange and foreign trade
It is expressed that an improvement in real exchange rate has no effect on foreign trade.
Yapraklı (2010) Turkey
2001: 3-2009: 6 real budget deficit, real money supply, real exchange rate index
real foreign trade deficit
In the long term, it was found that the foreign trade deficit was positively and significantly affected by the budget deficit, negative and meaningful from the money supply, and
positively and meaningless affected by the real exchange rate index. In the short term, it was found that the money supply had a positive and meaningful effect on the foreign trade deficit and the real effective exchange rate had a positive and meaningless effect
Sandalcılar (2012) BRIC (Brazil, Russia, India, China) Countries
1973-2010 Export and growth
A casuality is found from exports to economic growth.
Acet, Erdoğan and Köksal (2016)
Turkey
Quarterly data for the period 1998-2013 real GDP, total imports and total exports
They have identified causality from export and import to GDP. In addition, they concluded that the relationship between exports and real GDP was bi-directional.
Gümüş (2017) BRIC (Brazil, Russia,
India, China) countries
1995-2016 Export and growth
In Brazil, Russia and China, there is a positive relationship between exports and growth. On the other hand, there is a negative relationship between export and growth in India Petek and Çelik
(2017)
Turkey 1990-2015
Inflation, exchange rate, export and import
They found a one-way relationship between CPI and exports to imports. In addition, they determined a unilateral causality relationship between exchange rate and import to export. Barak and Naimoğlu
(2018)
Fragile five (Turkey, Argentina, Pakistan, Egypt and Qatar) Countries
2000-2014
Real exchange rate and foreign trade
3. Data and Econometric Method
3.1 Data
The variables used in this study were obtained from the OECD database. However, in order to identify some of the lost data of some countries, the Central Banks of the countries were used.
Quarterly data were used for model estimation for 1996q1-2018q2 period. BRICS (Brazil, Russia, India, China, South Africa) in addition to the group of countries called on Turkey was made in model prediction. In this study, economic growth, interest rate, exchange rate, M1 money supply and inflation were used as determinants of monetary policy. The natural logarithms of the variables used in the study were taken. However, inflation is used without logarithm.
Table 2: Descriptive Statistics
Variable No of
observ ations
Average Standard Deviation
Minimum Value
Maximum Value
X 540 78.98112 130.8587 5.597506 650.7717
GDP 540 4.05e+08 9.15e+09 380075.3 542.8975
ER 540 16.69168 19.17137 0.0643172 2.13e+11
INF 540 11.03768 17.17939 -2.06 74.64637
M1 540 49.59007 39.16736 0.2104325 116.8237
R 540 21.8927 26.92844 1.5 166.7048
3.2 Econometric Method
Pesaran (2007) developed a unit root test for horizontal and horizontal cross-sectional dependence and used for heterogeneous panels. Pesaran (2007) model is shown by the following equation:
(1)
(for all i)
(i=1,2,……, ), (i= )
While the basic hypothesis is the unit root in each of the cross sections, the alternative hypothesis is that some of the cross sections do not contain unit roots.
When the primary differences of both and , the equation is as follows:
(2)
CIPS statistics is expressed as the average of CADF statistics. It is shown as follows:
(3)
The cointegration test used Westerlund and Edgerton (2008) cointegration test. Westerlund and Edgerton (2008) made a regression estimate based on the Fully Modified Least Squares Estimator (FMOLS) proposed by Pedroni. Estimates using LM statistics. The equation is as follows:
(4) If , it is equal to the total of + . The model by adding LM is as follows:
(5) In equation, partial total method expresses the long term variance of . While the main hypothesis of
cointegration is as available in terms of
cointegration for all i, is as does not have
cointergration for some i.
If the assumption of heterogeneity is made, variables are not stationary, and if there are co-integration relationships between variables, they are done by the Common Correlated Effects Mean Group (CCEMG) method developed by Pesaran (2006). Dumitrescu and Hurlin (2012) developed Granger causality testing for heterogeneous panels. The illustration of the equation is as follows:
(6) The main and alternative hypothesis is as follows:
i=1,………,N
The main hypothesis expresses that there is no casuality from X to Y for all panels.
i=1,……….,
i=
Alternative hypothesis expresses that there is no causality relations in some units.
4. Empirical Results
Table 3: CIPS Unit Root Test Results (Level)
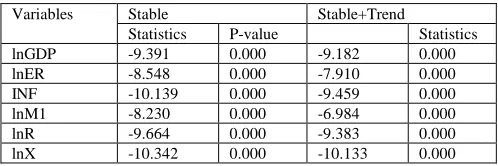
Table 4: CIPS Unit Root Test Results (First Difference)
In order to see some unit root tests, heterogeneity or homogeneity of variables, it would be useful to look at the homogeneity test of Pesaran and Yamagata (2008). This test will take place when the time dimension (T) is greater than the observation number (N). Our analysis is valid because it provides this condition. The current hypothesis of this test is based on the assumption that all parameters are the same, ie equal to zero.
The alternative hypothesis is that the cross-section units are different from each other..
(7) Table 5: Homogeneity Test Results
Homogeneity Test Statistics P value
5.611 0.000
5.773 0.000
Homogeneity test results, homogeneity of the variables will be rejected. The panel cross-section coefficients are heterogeneous.
Pesaran (2004) proposed to determine whether there is a correlation between the units. The proposed model determines the cross-sectional dependence between variables.
Table 6: Pesaran (2004) Cross Sectional Dependency Test Results LNX
CD Test Value p-value
LM(Breusch&Pagan,1980) 854.376 0.000
CD LM(Pesaran,2004) 153.248 0.000
CD (Pesaran,2004) 28.570 0.000
Bias-adjusted CD 4.482 0.000
The null hypothesis of this test was rejected. So there is a cross-sectional dependence between variables.
According to the cross-sectional dependency test developed by Pesaran (2004), a cointegration test will be performed considering the cross-sectional dependence after the cross-section is found.
Table 7: Westerlund and Edgerton (2008) Cointegration test result (1)
Constant Statistics
6.617 0.437 0.000
Table 8: Westerlund and Edgerton (2008) Cointegration Test Results (2)
Constant+Trend Statistics
13.755 0.001 0.000
In order to perform the Westerlund and Edgerton(2008) co-integration test, the variables need not be stationary.
According to Westerlund and Edgerton (2008)
cointegration test, the cointegration relationship between the variables of export and monetary policy determinants was determined in both constant and constant and trend models. The main determinant of the cointegration test was the boostrap value of the LM test.
Estimation of the coefficients of the cointegration test will be made through the proposed CCEGM method for heterogeneous panels.
Table 9: Estimation of coefficient through CCEGM Estimation
All Panel GDP ER INF M1 R
Coefficient -0.526* 0.032* -0.001 0.057* 0.044**
Standard Deviation
0.124 0.039 0.000 0.060 0.016
t value -0.42 0.82 -2.49 0.96 2.72
*%1 and %5 shows significancy level. ** %5 shows significancy level.
According to the results in Table 9, long-term regression coefficients between exports and independent variables are expressed. According to the results of the whole panel, the effect of economic growth on exports is found to be negative in the estimation of the long-term relationship, while the exchange rate, M1 money supply and interest rate effect on exports are positive. Nevertheless, the effect of inflation on exports seems insignificant.
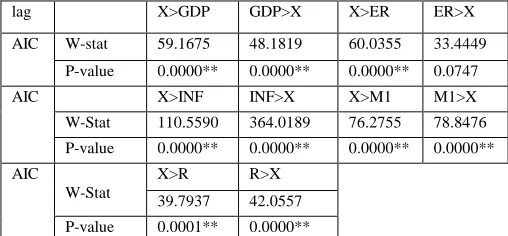
The causality test developed by Dumitrescu and Hurlin (2012) for heterogeneous panels will be used in this study. AIC information criterion was chosen as the delay length. In the table below, the results of the causality analysis of Dumitrescu and Hurlin (2012) were reported. According to the results, a positive and bidirectional relationship was found between economic growth and exports. Between exchange rates and exports, a one-way relationship between exchange rate and exports was determined. Inflation, M1 money supply and interest rate and exports were found to be positive and bidirectional.
Variables Constant Constaant+Trend
Statistics P-value Statistics P-value
lnGDP 0.791 0.785 0.854 0.804
lnER -0.962 0.168 -2.337 0.010
INF -5.223 0.000 -3.859 0.000
lnM1 -0.606 0.272 -1.068 0.143
lnR -1.823 0.034 -2.640 0.004
lnX -1.311 0.095 -0.093 0.463
Variables Stable Stable+Trend
Statistics P-value Statistics
lnGDP -9.391 0.000 -9.182 0.000
lnER -8.548 0.000 -7.910 0.000
INF -10.139 0.000 -9.459 0.000
lnM1 -8.230 0.000 -6.984 0.000
lnR -9.664 0.000 -9.383 0.000
Table 9: Dumitrescu and Hurlin (2012) Panel Casuality Test Results
lag X>GDP GDP>X X>ER ER>X
AIC W-stat 59.1675 48.1819 60.0355 33.4449
P-value 0.0000** 0.0000** 0.0000** 0.0747
AIC X>INF INF>X X>M1 M1>X
W-Stat 110.5590 364.0189 76.2755 78.8476
P-value 0.0000** 0.0000** 0.0000** 0.0000**
AIC
W-Stat
X>R R>X
39.7937 42.0557
P-value 0.0001** 0.0000**
** The rejection of the current hypothesis was realized as 1% and 5%..
5. Results
In this study, for the period of 1996q1-2018q2 the effects of monetary policy determinants (economic growth, exchange rates, inflation, money supply, interest rate) on the export are analyzed in Brazil, Russia, India, China,
South Africa and Turkey (BRICS-T).
In this direction, it is resulted that it is heterogeneous panel in homogeneity test and our econometric analysis has been shaped in this direction. According to the results of cross-sectional dependence, the cross-cross-sectional dependence between the variables was determined. Westerlund and Edgerton (2008) showed that the co-integration test results revealed that the variables were co-integrated; In other words, it was determined that the variables act together in the long term. According to Dumitrescu and Hurlin (2012) causality analysis, a positive and bi-directional relationship was found between economic growth and exports. Between exchange rates and exports, a one-way relationship between exchange rate and exports was found. Inflation, M1 money supply and interest rate and exports were found to be positive and bidirectional. Therefore, monetary policy makers should consider the export factor. Monetary policy makers must ensure an environmental condition where all segments make production.
References
[1] Acet, H., Güvenek, B. and Soydal, H. (2006). Güvenilirlik İhtiyacı ve Devletin Regülasyonu. “Selçuk Üniversitesi Sosyal Bilimler Meslek Yüksekokulu Dergisi”, Vol. 9, No. 1-2, 501-519. [2] Acet, H., Eroğan, S. and Köksal, M. (2016). İhracat, İthalat ve Büyüme Arasındaki Nedensellik İlişkisi: Türkiye Uygulaması. “Selçuk Üniversitesi İktisadi ve İdari Bilimler Fakültesi Sosyal ve Ekonomik Araştırmalar Dergisi”, Year.2016, No. 31, pp.141-165.
[3] Alptekin, V. (2009). Türkiye’de Dış Ticaret - Reel Döviz Kuru İlişkisi: Vektör Otoregresyon (Var) Analizi Yardımıyla
Sınanması. “Niğde Üniversitesi İİBF Dergisi”, Vol.2, No. 2, pp.132-149.
[4] Alsu, E. (2006). “Döviz Kurları, Enflasyon ve Faiz Oranlarının Dış Ticaret Üzerindeki Etkileri Türkiye örneği (1985-2005)”.M.S. Thesis, Gaziantep Üniversitesi, Sosyal Bilimler Enstitüsü, İktisat Anabilim Dalı, Gaziantep.
[5] Arize, A. C. (1994). Cointegration Test of a Long-Run Relation Between the Real Effective Exchange Rate and the Trade Balance. “International Economic Journal”, 8(3), pp.1-9. [6] Ay, A., Erdoğan, S. and Mucuk, M. (2003). İhracatın Ekonomik Büyüme Üzerine Etkisi: Türkiye Örneği (1969-2002). “Selçuk Üniversitesi Sosyal Bilimler Meslek Yüksekokulu Dergisi”, Vol. 6, No. 1, pp. 117-127.
[7] Barak, D. and Naimoğlu, M. (2018). Reel Döviz Kurunun Dış Ticaret Üzerine Etkisi: Kırılgan Beşli Örneği, “Ömer Halisdemir Üniversitesi İktisadi ve İdari Bilimler Fakültesi Dergisi”, Vol. 11, No. 2, pp.82-95.
[8] Bayraktutan, Y. ve Arslan, İ. (2003). Türkiye’de Döviz Kuru, İthalat ve Enflasyon İlişkisi: Ekonometrik Analiz(1980-2000). “Afyon Kocatepe İİBF Dergisi”, Vol. 5, No. 2, pp. 89-104. [9] Breusch, T.S. and Pagan, A.R. (1980) The Lagrange multiplier test and its applications to model specification in econometrics, Review of Econometric Studies, 47 (1), pp. 239-253.
[10] Dumitrescu, E. and Hurlin, C. (2012) Testing for Granger non-causality in heterogeneous panels, Economic Modelling, 29 (2012), pp. 1450–1460.
[11] Gümüş, M. (2017). BRIC Ülkelerinde İhracat Ve Büyüme Arasındaki İlişki: Panel Veri Analizi. “International Academic Journal”, Cilt: 1, Sayı: 1, 64-75.
[12] Heller, Peter S. and Porter, Richard C. (1978). Exports and Growth. “ Journal of Development Economics”, 5 (1978), pp. 191-193.
[13] In, F. and Menon, J. (1996). The Long-Run Relationship Between the Real Exchange Rate and Terms of Trade in OECD Countries, “Applied Economics”, Vol. 28, No. 9, pp.1075-7080. [14] Kalaycı, İ. (2011). 2008 Küresel Finansal Krizi Sonrasında Dış Ticarette Korumacılık: Paradigma Kayması (mı?). “Maliye Dergisi”, No.161, pp.76-103.
[15] Kravis, I. B. (1970). Trade as a Handmaiden of Growth: Similarities Between The Nineteenth and Twentieth Centuries. “The Economic Journal”, Vol. 80, No. 320, pp. 850-872. [16] O’Neil, J. (2001), Building Beter Global Economic BRICs. Goldman Sachs Global Economics Paper No 66.
[17] Pesaran, M.H. (2004). General diagnostic tests for cross section dependence in panels, “CESifo Working Paper Series”, 1229.
[18] Pesaran, M.H. (2006). Estimation and inference in large heterogeneous panels with a multifactor error structure, Econometrica, Vol. 74, No. 4, pp.967–1012.
[19] Pesaran, M.H. (2007) A simple unit root test in the presence of cross-section dependence, Journal of Applied Econometrics, 22 (2), 265-312.
[20] Pesaran, M. H., Yamagata, T. (2008) Testing slope homogeneity in large panels, Journal of Econometrics, 142(1), pp. 50–93.
Analizi (1990-2015). Finans Politik & Ekonomik Yorumlar; Cilt: 54,Sayı: 626, 69–87.
[22] Sandalcılar, A. R. (2012). BRIC Ülkelerinde Ekonomik Büyüme Ve İhracat Arasındaki İlişki: Panel Eşbütünleşme Ve Panel Nedensellik. “Süleyman Demirel Üniversitesi İktisadi Ve İdari Bilimler Fakültesi Dergisi”, Vol. 17, No. 1, pp.161-179. [23] Shirvani, H. and Wilbratte, B. (1997). The Relationship Between The Real Exchange Rate and The Trade Balance: An Empirical Reassessment, “International Economic Journal”, 11(1), pp.39-50.
[24] Westerlund, J. and Edgerton, D. L. (2008). A Simple Test for Cointegration in Dependent Panels with Structural Breaks. “Oxford Bulletin of Economics and Statistics”, 70, pp.665-704. [25] Yapraklı, S. (2010). Türkiye’de Esnek Döviz Kuru Rejimi Altında Dış Açıkların Belirleyicileri: Sınır Testi Yaklaşımı. “Ankara Üniversitesi SBF Dergisi”, Vol. 65, No. 4, pp.141-163.
Zeynep Karaçor is a Professor at the Faculty of Economics and Administrative Sciences, University of Selçuk, Turkey. Her main research interests include economics. Her books are “Ekonomi Politikası ve Türkiye”, “Finansal Kriz Üzerine Öngörülebilirlik ve Politikalar”,“Konya İli Gelir Dağılımı”, “Enflasyonist Bekleyiş ve Toplumsal Uzlaşma Kuram ve Türkiye Ekonomisi Üzerine Bir Uygulama”