PhD Dissertation
International Doctorate School in Information and Communication Technologies
DISI - University of Trento
Cyber-Physical Systems: Two Case Studies in
Design Methodologies
Luca Rizzon
Advisor:
Prof. Roberto Passerone
Universit`a degli Studi di Trento
Abstract
To analyze embedded systems, engineers use tools that can simulate the performance of software components executed on hardware architectures. When the embedded system functionality is strongly correlated to physical quantities, as in the case of Cyber-Physical System (CPS), we need to model physical processes to determine the overall behavior of the system. Unfortunately, embedded systems simulators are not generally suitable to evaluate physical processes, and in the same way physical model simulators hardly capture the functionality of computing systems. In this work, we present a methodology to concurrently explore these aspects using the metroIIdesign framework. The methodology
provides guidelines for the implementation of these models in the design environment. To demonstrate the feasibility of the proposed approach, we applied the methodology to two case studies. A case study regards a binaural guidance system developed to be included into a smart rollator for older adults. The second case consists of an energy recovery device which gets energy from the heat dissipated by a high performance processor and power a smart sink able to provide cooling or to serve as a wireless sensing node.
Keywords
Contents
1 Introduction 1
1.1 CPS Design Challenges . . . 1
1.2 Structure of the Thesis . . . 3
2 Design Methodology 5 2.1 State of the Art . . . 5
2.2 MetroII Design Framework . . . 7
2.3 MetroII building blocks . . . 8
2.4 Proposed Design Methodology . . . 9
3 Audio Guidance Interface 13 3.1 Context of the Project . . . 13
3.1.1 System Functionalities . . . 14
3.1.2 Related work . . . 15
3.1.3 Author Contribution . . . 16
3.1.4 Chapter Structure . . . 16
3.2 Acoustic Interface . . . 17
3.2.1 Rendering spatial sounds . . . 19
3.2.2 Propagation Model . . . 20
3.2.3 Interaural Time Difference . . . 20
3.2.4 Interaural Level Difference . . . 21
3.2.5 Rendering Sensation of Elevation . . . 22
3.2.6 Reverberation . . . 22
3.3 Modeling the Audio Guidance Interface . . . 23
3.4 Physical Model . . . 26
3.5 Cyber Model . . . 26
3.6 Functional Model . . . 27
3.7 Architectural Model . . . 28
3.9 Results . . . 29
3.10 Processing of moving sounds . . . 31
3.11 Analysis of moving sounds . . . 32
3.11.1 Case without the Doppler Effect . . . 33
3.11.2 Case with Doppler Effect . . . 36
3.11.3 Summary . . . 39
3.12 Experimental Evaluation . . . 39
3.12.1 Discussion . . . 46
4 TERS 49 4.1 Context of the Project . . . 49
4.1.1 Author Contribution . . . 51
4.1.2 Chapter Structure . . . 52
4.2 Prototype Development . . . 52
4.2.1 Target host platforms . . . 52
4.2.2 Characterizing harvesting module . . . 53
4.2.3 Description of the Conditioning Circuit . . . 60
4.2.4 TERS as Wireless Monitoring Node . . . 62
4.2.5 TERS as Passive CPU Cooler . . . 66
4.2.6 TERS as Active CPU Cooler . . . 67
4.2.7 Characterization of the harvesting module and conditioning circuit 71 4.3 Modeling TERS . . . 73
4.4 Physical Model . . . 74
4.5 Cyber Model . . . 75
4.6 Functional Model . . . 76
4.7 Architectural Model . . . 76
4.8 Mapped Systems . . . 79
4.9 Results . . . 79
5 Conclusion 83 5.1 Summary . . . 83
5.2 Future work . . . 84
List of Tables
3.1 Pinna model coefficients . . . 22
3.2 Signal to Noise Ratio of the standard and proposed implementations com-pared to the ideal one. SNR of the proposed implementation against the standard one. . . 39
3.3 Average error (cm) for each experimental condition. . . 43
3.4 Average time (in seconds) for each experimental condition. . . 43
3.5 Average travelled length (meters) for each experimental condition. . . 45
3.6 Average speed (m/sec) for each experimental condition. . . 45
List of Figures
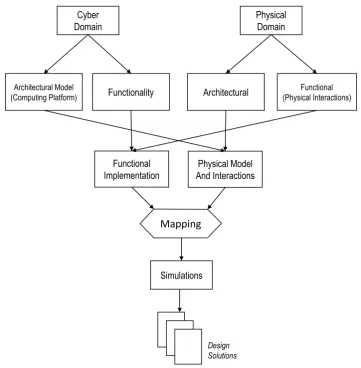
2.1 Proposed workflow to model cyber-physical systems by separating func-tional and architectural models of the computing and physical parts of the system and conducting the simulations with the same design environment . 10
3.1 The vertical polar coordinate system. . . 20
3.2 Intuitive graphical representation of the Image Source Method implemen-tation. . . 24
3.3 The metroII model for the binaural guidance system. . . 25
3.4 The binaural guidance estimated execution time. The blue line represents the maximum execution time required to perform continuous playback. On the bars, orange is the planner execution time, blue is the time required by the IMU, grey is the audio processing time, while yellow is the blocking playback time. . . 30
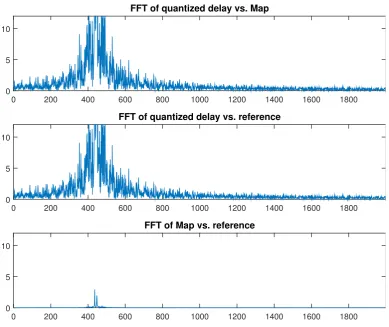
3.5 Fourier transform of the difference between the standard and the proposed algorithm (top), the standard and the baseline (center), and the proposed vs. the baseline (bottom) for a circular trajectory. . . 33
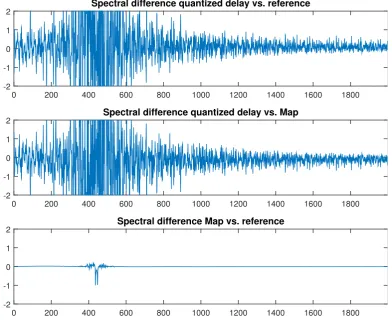
3.6 Difference between the spectra of the quantized delay algorithm vs. the reference (top). Difference between the spectra the proposed algorithm and the quantized delay algorithm (center). Comparison of the proposed algorithm and the baseline (bottom). . . 34
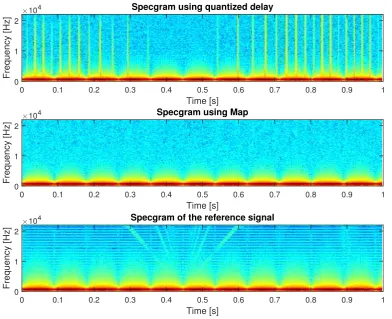
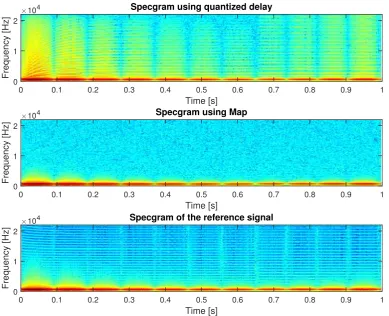
3.7 Spectrograms of one second of signal for the quantized delay algorithm (top), the proposed algorithm (center), and the baseline (bottom) when the virtual sound source moves along a circular trajectory. . . 35
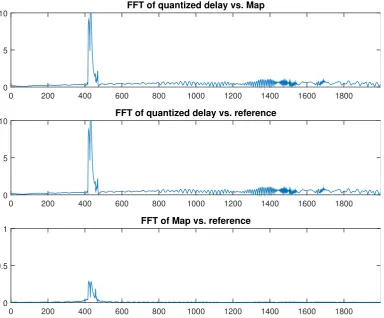
3.9 Difference between the spectra of the quantized delay algorithm vs. the baseline (top). Difference of the FFTs of the proposed algorithm and the standard case (center), and the spectral difference of the proposed non–
quantized algorithm and the reference (bottom). . . 37
3.10 Spectrogram of one second of signal for the quantized delay algorithm (top), the proposed algorithm (center), and the baseline (bottom) when the vir-tual sound source moves along a linear trajectory. . . 38
3.11 Different metrics as function of Guidance and Path: (a) average error (cm), (b) average time (s), (c) average length (m), (d) average speed (m/s). . . . 42
3.12 Some examples of qualitative results for different guidance algorithms: (a) mechanical, (b) haptic, (c) audio, (d) binaural. Dash line represents the user trajectory, the continuous line represents the suggested path. . . 44
4.1 Thermoharvester schematic made of 2 Peltier cells, spreaders and sink in stacked fashion. We put thermal grease in between each layer of different materials to guarantee maximum thermal contact. . . 54
4.2 Output power of the Nextreme TEG placed on top of the Pandaboard while running the benchmark application. The continuous line represents the thermal gradient as difference between the hot side and the heat-sink. . 55
4.3 Output power of the Micropelt on Pandaboard. . . 55
4.4 Output power of a single Peltier cell on Pandaboard. . . 56
4.5 Output power of the two–stage Peltier cells on Pandaboard. . . 56
4.6 Output power of the Nextreme on Arndale. . . 56
4.7 Output power of the Micropelt on Arndale. . . 57
4.8 Output power of a single Peltier cell on Arndale. . . 57
4.9 Output power of the two–stage Peltier cells on Arndale. . . 57
4.10 Average output power per benchmark’s stage. . . 58
4.11 Average ∆T per benchmark’s stage. . . 59
4.12 Total benchmark execution time per configuration. . . 59
4.13 Total impedance matched energy per configuration. . . 60
4.14 Electronic diagram of the conditioning hardware circuit that converts and stores the energy generated by the TEG, and supplies the Wireless Sensor Network (WSN). . . 61
4.15 Schematic representation of the interconnection between the wireless node and the sensors. . . 62
4.17 Voltage in the storage capacitance and transmission events with fCLK =
1.7 GHz, and CPUload = 100%. . . 64
4.18 Voltage in the storage capacitance and transmission events with fCLK =
1.2 GHz, and CPUload = 50%. . . 65
4.19 Voltage in the storage capacitance and transmission events with fCLK =
1.7 GHz, and CPUload = 50%. . . 66
4.20 Measured power consumption of the prototype node during a sense and send event. . . 66 4.21 CPU temperature trend in three configuration: with and without the heat
sink, and with the proposed prototype on top. . . 68 4.22 Voltage stored in two 50 F supercap in time, parallel versus series
configu-rations. . . 69 4.23 Long term stability of the passive cooling with 100% CPU load @ 1.5 GHz.
Time required to recharge the supercap. . . 70 4.24 Active cooling, fan activity of 30 s allows 13 min overclocking @ 22.5◦ C. . 71 4.25 Active cooling, fan activity of 10 s allows 13 min overclocking @ 20◦ C. . . 72 4.26 Relation between thermal gradient and extracted power. Green dots
rep-resent measured values, the orange line reprep-resents the fitting polynomial used by the simulator . . . 73 4.27 ThemetroIImodel for the thermoelectric energy recovery system applied
to the ARM CPU. The figure includes both the Sense Task and the Cool-ing Task that can be implemented alternatively. . . 77 4.28 Average number of cooling (in red) and sensing events (in blue) in a week
for different configurations of the monitoring device applied on top of the Arndale CPU. Seconds the CPU spent in overclock (represented by bars). . 80 4.29 Average number of cooling and sensing events (in red and blue respectively)
Chapter 1
Introduction
1.1
CPS Design Challenges
Embedded Systems (ESs) are computing devices specifically designed, and optimized to perform a specific task. This term highlights how ESs are in opposition to general com-puting platforms, which are designed to execute a variety of different tasks that can differ significantly one to the other. PDAs, smartphones, car ECUs, avionics, industrial au-tomation systems, home auau-tomation, among many others are all examples of instances of ESs. Those applications encompass different domains, therefore they differ in require-ments and attributes, however they share common design challenges. For example, mobile devices require low energy consumption profile to guarantee an acceptable battery life-time without compromising the device size or weight. In the case of systems from which the individual’s safety depends, such as for example cars ABS, or avionics system, the execution time of a certain task is crucial, therefore the execution time of a task, and its probability of being interrupted from other events, are of fundamental importance, as opposed to the case of personal computers.
1.1. CPS DESIGN CHALLENGES CHAPTER 1. INTRODUCTION
are generally studied with models which differ significantly. The cyber domain is made of sequential operations, that are punctuated in discrete time (i.e. the clock), physical process can be concurrent and modeled with expression in the domain of real numbers.
For engineers developing CPS it is of fundamental importance to design the cyber as well as the physical part of the system taking into account both the computational unit features, and the results of the interaction with the physical world. Both aspects, in fact, affect important system metrics, such as energy efficiency, efficient utilization of limited computational resources (memory, processors, speed), real-time constraints, and predictability of the outcome. Embedded systems modeling can be used for verification, for power consumption estimation, and to select the best hardware architecture for the design. Typically, these tools are event–based since this approach is more practical to simulate hardware interrupts, or message exchange between components. On the contrary, to model physical phenomena we need tools which are able to handle a different domain to include models typical of the physical world, such as for example differential equations. Thus, due to the intrinsic difference that exists between the cyber and physical domain, design tools and simulators designed to model one world are typically not suitable to model the other, and vice versa [36]. Therefore, the current practice is to study the two worlds separately, with the risk of not properly modeling how the two interact. Moreover, only very few description of studies applied to real cases have been presented in the literature [32].
In this thesis, we propose a methodology to integrate computational models and physical models using a design strategy inspired by the function/architecture co-design paradigm: while cyber and physical components are conceptually separated, they are in-tegrated over two mapping steps to result in an overall system model. We support the methodology using themetroIIdesign exploration tool [15]. In particular, we explore the functionalities offered by the metroIIdesign framework and how to use them in practice
by studying how to analyze two very different case studies, to identify and outline best design practices that can be adopted to express and combine the cyber/physical features in metroII. The proposed practices can be adapted or extended to model other, equally
diverse systems.
We explore the functionalities of the metroII design framework by studying how to
simulate two very different systems, with the objective of outlining practices that we adopted to be able to express system features through the elements already defined in
metroII. To illustrate the approach, we will describe the design of two systems very
CHAPTER 1. INTRODUCTION 1.2. STRUCTURE OF THE THESIS
We describe the design of an auditive guidance interface developed to be used in a smart walker for the older adults. The auditive guidance system generates spatial 3D sounds to give instructions to the user of the walker regarding the displacement of the suggested path to follow stimulating higher level of cognition. To provide a convincing effect, while keeping the computational requirement acceptable for the application, we developed a sound generation software based on a simplified sound propagation model and we take advantage of user head movement to increase the level of realism. However, the interface must generate sound within a time limit, otherwise it will not be effective from a perceptual viewpoint. Since the interface software cooperates with other software components of the assistive device, and the device is equipped with several computing units, we adopted the design methodology to evaluate the execution time for different configurations.
Then, we will describe the design of a energy recovery system for data centers CPUs. The system scavenges the energy from the heat dissipated by a data center processor to power a smart heat sink. The smart sink is equipped with a microcontroller system with radio capability and a convention fan. According to the configuration, the smart sink provides two functionalities. It can work as a wireless sensor network node, to provide environmental data center monitoring by sending data it samples from its on– board sensors to a data collector. Alternatively, it can power the fan to provide active cooling to the data center CPU. The fan is activated following a strategy that allows the CPU to not overheat during a period during which the CPU is overclocked. With this system it is possible to improve the data center management, but the behavior of the smart sink depends on the amount of energy it can scavenges. Although the tasks of the data center CPU and of the smart sink are independent, they influence each other through a physical interaction.
1.2
Structure of the Thesis
This thesis is organized as follows.
Chapter 2 illustrates the state of the art in Cyber-Physical Systems design methodolo-gies, and design tools. Moreover, it describes the main features of the design tool we have chosen for this research, and described the proposed methodology.
1.2. STRUCTURE OF THE THESIS CHAPTER 1. INTRODUCTION
Chapter 4 illustrates a second case study: the design of a thermo energy harvesting system that scavenges energy from high–performance processors to supply a very low–power device. The initial part of the chapter is dedicated to the description of the parts that compose the system and their characterization that allow us to get models useful to describe the system. The second part of the chapter illustrates the application of the design methodology to the design of the system and discusses the results.
Chapter 2
Design Methodology
2.1
State of the Art
Several design methodologies have been presented in the literature and applied success-fully to cope with the design challenges of CPS. In Platform-Based Design (PBD), the design moves from the application space to the architectural space through a mapping process [52]. The approach is based on the separate definition of the functionality of the system, and of the possible implementation platforms. The two are then combined by
mapping the functionality on the different platform architectures to assesses the perfor-mance of interest in a structured way [18]. The PBD paradigm can be enforced using contracts [47]. In this case, the design methodology is carried out in two steps. The first consists in the definition of the cyber and the physical architecture, followed by an explo-ration of the target platforms. In our work, we follow the PBD paradigm and extend it to a two-step mapping process to separately specify and then combine cyber and physical components.
Model-Based Design (MBD) addresses the problem of designing complex systems start-ing from a model that represents the system behavior usstart-ing numerical methods, models or measurements. Jensen et al. discuss the MBD approach in the context of CPS, by dividing the design process into steps, from physical modeling, to simulation, software synthesis and validation [29]. The authors exemplify the methodology with Ptolemy II, a mod-eling and simulation environment for heterogeneous embedded systems which supports MBD [12, 53]. Our approach is more structured, and defines precise roles for the architec-tural and the functional elements of the models. ThemetroIIdesign tool, which we use
2.1. STATE OF THE ART CHAPTER 2. DESIGN METHODOLOGY
combines the construction of a model with a simulation of the system and network, and estimates the behavior of the system mapped onto a target platform. The implementation platform introduces delays that may affect the execution of real-time systems. The tool integrates the simulation of Discrete Events –typical of cyber components– with different physical time models, to perform timing verification, and generate executable software. An alternative approach, proposed by Noyer et al., includes the adoption of three different design tools in the workflow: 1) a tool for timing analysis, 2) a tool that supports Model Driven Development, and 3) a tool for Requirement Management (RM) [46].
The Matlab design environment, which follows the MBD approach, supports CPS de-velopment through Simulink or SimScape. Here, simulations and implementations are coded in two different languages. On the contrary, we aimed to develop a design environ-ment that can reuse the same C/C++ code for both impleenviron-mentations and simulations. An alternative approach to the one presented in this work is based on the adoption of
Modelica [24]. Modelica is a powerful tool for modeling and simulation of mechanical, electrical, thermal, control and hydraulic systems. In its standard version, it does not provide simulation of computing systems, but since it is designed to be domain neutral, it is flexible enough to support the description of such kind of systems. Recently, a support library called Modelica EmbeddedSystems was released, which represents an extension of
Modelica from the physical domain toward the digital domain. A design approach that combines Modelica and metroII has been developed [54], but it keeps the two designs separated and makes them communicate via CORBA.
Another framework for building complex systems by composition of components is Behavior-Interaction-Priority (BIP) [8]. In BIP, the system specification is organized in three layers. The first layer describes the components in isolation, the second layer is used to specify the interaction of components activation through connectors, and the top layer is used to express the priorities that characterize the overall system architectures. To support CPS design,BIP can interact withSimulink physical models by using translators to convert Simulink blocks into BIP specifications [65].
Interme-CHAPTER 2. DESIGN METHODOLOGY 2.2. METROII DESIGN FRAMEWORK
diate Format (IF) to exchange models betweenMatlab/Simulink and the C language [71]. Standards can alternatively be used for tool interoperability. The Functional Mockup Interface (FMI) is a tool-independent standard aimed to ease the collaboration in design projects where different tools and workflows are used. Using FMI, the designer distin-guishes between the functionality of the component (code or binaries), and its interface data. Tools supporting FMI allow engineers to import models and co-simulate them to perform design validation, promoting the exchange of simulations model across tools [7]. Our methodology is orthogonal to this approach, which could be conveniently used to extend the integration capabilities.
2.2
MetroII Design Framework
A generic CPS can be seen a system where embedded computers can monitor and ma-nipulate physical world, and the physical quantities can affect computation, usually with feedback loops. For a CPS engineer, it is important to consider and to model both the behavior of computation processes and the evolution of physical quantities. From the cyber side, for example, it is important to understand the time required to perform a task, the amount of memory required, or the physical size of the device. From the physi-cal side, to model thermal trend, the mechaniphysi-cal, or to capture the behavior the system under control. The physical architecture under control can be composed of a hydraulic, electrical or mechanical components. However, the cyber and the physical world belongs to two different domain, in fact, most of cyber processes can be model in discrete time and evolve in a sequential manner; on the contrary the physical world is modeled as real processes that can be concurrent in time. Systems resulting from the combination of the two heterogeneous world exhibit a superimposition of the two domains, and must be modeled accordingly.
2.3. METROII BUILDING BLOCKS CHAPTER 2. DESIGN METHODOLOGY
2.3
MetroII building blocks
In our work, we adopt the metroII design framework [15]. metroII is a design
frame-work which support PBD. It is written in SystemC which is a C++ library that provides an interface for event-driven simulation, meaning it allows a designer to simulate con-current processes written in plain C++ syntax. A metroII system design is made of a
Functional and anArchitectural model, to promote reusability and separation of concerns. The Functional Model expresses what the design does in algorithmic terms, such as the control strategy. The Architectural Model describes how the system is implemented, the hardware platform where the control algorithm executes, including embedded processors, sensors, actuators, communication primitives, operating systems, firmware, and drivers. While the functional model can be used to perform control validation, the architectural model contains values and formula used to model the physical quantities of interest, to simulate physical time, power consumption, associated costs, and other features of inter-est.
In metroII, functional and architectural models are described as netlists of
CHAPTER 2. DESIGN METHODOLOGY 2.4. PROPOSED DESIGN METHODOLOGY
it must contain a required port to interface to a memory architectural component. The basic behavior of components is initially specified in SystemC, then encapsulated by wrapping the code to provide metroII interfaces. The components of a metroII system are concurrent, and synchronize through events. Each method is associated to a pair of begin and end events, which mark the start and end points of the procedure execution. The execution of a metroII system is orchestrated by an event scheduler,
which triggers the methods of the components. Additional events are used to charac-terize quantities, which model non-functional aspects such as execution time and power consumption. Annotators, which are similar to event schedulers, are used to label quan-tities with values corresponding to the event triggering, providing the means to conduct performance analysis. In particular, end events are associated with tags expressing time the annotator uses to evaluate the execution time in the target architecture. The event scheduler can be used to specify the order of execution of operations. Moreover, through the event scheduler it is possible to specify if a component can execute only a function at a time or, on the contrary, if it can execute more operation concurrently.
Event synchronization is specified through constraints. In particular, architectural components are synchronized with the functional components through mapping con-straints, which schedule functions and their respective architectural implementations (tasks) simultaneously. This mechanisms implements a function/architecture co-design paradigm: functions synchronize with the architecture, which progresses according to the modeled quantities, to produce an estimate of the system performance. Likewise, abstract functional communication primitives, such as a blocking FIFO, can be synchronized to an architectural implementation, such as a shared memory.
2.4
Proposed Design Methodology
The building blocks provided bymetroII to model ESs can be used to model CPSs. To
model the cyber part of a system, designers implements the typical workflow for embedded systems design. This consists of modeling the functionality of a system in the functional model, and defining the architecture that can execute the functionality in the architectural model. Then, the tool provide a matching of the functionality onto the architecture to perform the functional-architecture co-design.
2.4. PROPOSED DESIGN METHODOLOGY CHAPTER 2. DESIGN METHODOLOGY
Simulations
Architectural (Physical Interactions)Functional
Physical
Domain
Architectural Model
(Computing Platform) Functionality
Cyber
Domain
Physical Model And Interactions
Functional
Implementation
Mapping
Design Solutions
Figure 2.1: Proposed workflow to model cyber-physical systems by separating functional and architectural models of the computing and physical parts of the system and conducting the simulations with the same
design environment
CHAPTER 2. DESIGN METHODOLOGY 2.4. PROPOSED DESIGN METHODOLOGY
functional functions. A physical process that influences (or is influenced by) the behavior of the functionality of the system is modeled as a functional component. A special provi-sion must be made if a physical process is defined only in the physical functional model. In that case, the designer must include also a virtual (or counterpart) component in the physical architectural model, to allow the mapping constraints to schedule and capture its execution, even if the component is isolated from other components from the point of view of the architecture.
In the architectural model of the design, the message exchange between components is used to connect provided and required objects as in traditional ESs design. In addition, interfaces are used to forward physical quantities between components that physically interact. For example, to model how the temperature of a component A influences the actions of another component B in one of our case studies, component A contains a required port to a shared memory, andB has a provided port to the same memory. The interface is used byB to receive temperature values from A.
Once the design is completed, the overall functional model contains the functionality of the computing part of the system, with components and ports that model the interactions of physical processes with the system functionality. The architectural model contains the definition of the computing platform together with the physical models and interactions between physical and computing worlds. The metroII scheduler is used to coordinate
the execution, the same way as in the design of embedded system. However, events that are triggered by physical processes (i.e., a value reaches a threshold) are ignored by the
metroIIscheduler, but are fired from direct, concurrent function calls performed by an
Chapter 3
Audio Guidance Interface
In this chapter we describe how the proposed design methodology has been applied to the design of a auditive guidance interface developed for a smart walker. The first part of the chapter is dedicated to the description of the implementation of the interface, while the second part focuses on the description of the design model. Subsequently, we illustrate the analysis of the quality of the generated sounds from a technical viewpoint, and an experimental evaluation in which the acoustic guidance is compared with other type of interfaces implemented in the smart walker. The smart walker we considered mounts several computing units and several software components are needed to properly implement the functionalities. The software components can be executed from any of the computing devices, so it is possible to implement different combinations of hardware and software that will exhibit different performance. The objective of our research work is to identify the combination that allows us to obtain a guidance signal effective and pleasant to hear for the user. For this purpose, we have extended the functional architecture analysis to accommodate the presence of the user in the design model.
3.1
Context of the Project
3.1. CONTEXT OF THE PROJECT CHAPTER 3. AUDIO GUIDANCE INTERFACE
interfaces to provide navigation. Main goal of the project is to provide elderly with a tool that helps them to diminish the stress of carrying out daily activities, therefore benefits of social life and slow down the aging process.
While the mechanical (or physical) part of thec-Walker serves as physical support for people suffering from weakness of the lower limbs, its cyber part overcomes the issue of orientation, memory attention, and understanding of places by providing guidance stimuli to the user. Overall, the c-Walker main features are:
1. the identification of the path across the space that best supports the user preferences and goals;
2. self localization inside the environment;
3. the detection of anomalies along the way, and the possibility to locally reshape the path accordingly;
4. provision of guidance to the user with active, and passive user interfaces.
The system has been designed to work in indoor environment, for example in shopping malls, airports, hospitals, or medical centers.
The user of the c-Walker selects the places he/she wants to visit using a touchscreen mounted between the handlebars. The system computes the optimal route using informa-tion stored in a map database. When the user starts walking, the c-Walker use different sensors to localize itself inside the environment, and compares its real–time position with the planner route. Planned route may change along the way according to the dynamic of the scene. If the user does not deviates from the planner route, the system does not pro-vide guidance, and behave as a conventional walker. On the contrary, if the user deviates from the optimal route, the system intervenes by actuating the User Interface (UI): the touchscreen, a pair of wearable haptic bracelets and a headphone. If the user deviates significantly, the system intervenes using active actuators: the motorized steering front wheel and the brakes on rear wheels.
3.1.1 System Functionalities
The data processing flow of thec-Walker can be summarized in three steps. First, environ-mental information is captured using sensors, stored and processed on embedded boards. Then, the data is processed to decide the best route. Lastly, the system communicate to the user information about the route through different media.
CHAPTER 3. AUDIO GUIDANCE INTERFACE 3.1. CONTEXT OF THE PROJECT
Inertial Measurement Unit (IMU), RFID reader), and high level sensors (camera and depth sensor). To process the best route, the system includes a long–term and a short– term planners. The long–term planner finds a path that connect the desired destination with the current location inside the map, satisfying user preferences. The short–term planner utilizes real–time information, such as the presence of anomalies or crowded areas. The short–term planner introduces a “local” modification of the long–term plan required to react to potential risks detected using cameras and depth sensors (i.e. Kinect).
The UI includes: a visual interface, haptic bracelets, acoustic interface and the mechan-ical guidance. The visual interface shows information of navigation via the touchscreen by drawing a map of the surroundings, highlighting the current position, the proposed path and showing an arrow pointing to the direction the system suggests to follow. The touchscreen is also used to take the user inputs. The haptic and acoustic interfaces raise the user attention in correspondence of turns or significant deviations from the optimal trajectory. To signal to the user to take a left turn (or a right turn), the haptic bracelet worn on the left forearm (or right forearm, in the other case) vibrates. To indicate to the user to turn left, the headphones reproduce a positional sound in the corresponding location. To synthesize positional sound we implemented different software, including a binaural rendering algorithm based on sound propagation model. Using these interfaces, thec-Walker has just an assistive role, in fact, the user is in charge of the decision about the route to follow, and can override the device suggestions. We refer to the acoustic and haptic interfaces aspassive interfaces. On the contrary, the mechanical guidance plays an
active role, since it can force a change of the direction.
3.1.2 Related work
Robotic walkers have gained an undisputed popularity in the research community on ambient assisted living [34, 66, 37]. Closely related to DALi is the Assistants for Safe Mobility (ASSAM) project [4], where a system consisting of a set of modular navigation assistants deployed on several devices is used to encourage physical exercise. ASSAM has a major focus on the seamless transition from indoors to outdoors, whileDALi specifically considers large indoors environment. Also, the behaviour of people in the surroundings is not considered in ASSAM.
3.1. CONTEXT OF THE PROJECT CHAPTER 3. AUDIO GUIDANCE INTERFACE
3.1.3 Author Contribution
In the context of the DALi project, we focused on the design and development of the audio interfaces. To navigate the c-Walker user through sound stimuli, we decided to adopt an interface based on the synthesis of 3D sound to be reproduced via headphones. We also developed an alternative guidance system in which the direction information is encoded as a difference in amplitude of the left and right channels, and the amount of turn is encoded as the amount of stimuli in the unit time. A description of the sound synthesis software implementation for rendering spatial sound on the horizontal plane has been published in [58]. In particular, the paper addresses the evaluation of the computation time required to generate spatialized sound for two different versions of the model on two computer architectures (a laptop and an embedded platform). A deepen analysis of the sound synthesis algorithm, accompanied by a description of the reverberation algorithm, and an initial evaluation study performed through an on–line questionnaire and results has been published in [59]. An exhaustive description of the c-Walker can be found in [57] and in [49]. Those two articles include an explanation of all the guidance interface including the one based on binaural audio. The description of an experimental study designed to evaluate the performance of user traveling across a space using one of the different guidance interfaces and the analysis of the results can be found in [43]. The personal contribution of the author is related to the binaural guidance interface and the different audio interface implementations used for the experimental evaluation.
3.1.4 Chapter Structure
The rest of this Chapter is structured as follows. In section 3.2 we introduce the role of the auditive guidance interface and how humans can judge the position where sound originates. Reflecting the human ability of recognizing spatial sounds in real world, we then describe how to reproduce the same sensation via headphones using adequate algo-rithms. The propagation model (described in detail in section 3.2.2) we adopted combines monaural cues, useful to recognize the left/right displacement of sounds, with binaural cues, most useful to judge the elevation of sounds, and a reverberation algorithm to control the sensation of immersion. Section 3.3 is devoted to the description of the de-sign exploration carried out using the proposed methodology with the dede-sign environment
metroII. In Section 3.10 we describe an implementation details that allows the algorithm
CHAPTER 3. AUDIO GUIDANCE INTERFACE 3.2. ACOUSTIC INTERFACE
we conducted to estimate the performance of the system in guiding non–disabled people across an unknown environment.
3.2
Acoustic Interface
The primary role of thec-Walker is to convey information about the environment to the user through haptic, visual and acoustic interfaces, assisting the user to follow a path or to move within a safe area avoiding obstacles. Besides the aforementioned passive interfaces, thec-Walker includes active motion control implemented through front caster wheels and brakes on the back wheels. To improve user’s comfort during movements, and ensure the user remains in control of the device, active guidance is activated only when the user approaches the boundaries of an area, or an obstacle. While the user is within the correct path, only passive interfaces are active.
Traditional acoustic navigation systems provide the user with instructions in the form of speech, such as “turn left”, or “go straight”. The limitation of this approach, especially for those who are visually impaired, is that the system does not an enhanced spatial representation of the surroundings. Our goal is to provide informations that can be easily interpreted to make an independent decision regarding the path to follow. Therefore, we have followed a different approach in which the audio stimuli is synthesized to convey to the user spatial location of the safest path and to stimulate higher level of cognition of the listener. This goal is achieved by processing signal with 3D sound techniques, which make sounds reproduced over headphones to appear as if they are originating from a precise point in space. In this way, sounds can be used to direct the attention of the user towards the path to be followed.
The ability of humans to interpret the position in space where a sound originates is calledlocalization. In real world, localization relies on the body shape and displacement of the human ears. In particular, the external ears behave as directional sound filters. Thus, they introduce modifications of the incoming sounds, resulting in differences in amplitude and phase at the two ears (binaural cues), and spectral cues (monaural cues). The brain interprets the cues to determine the direction of arrival of sound waves. By reproducing the same phenomena involved in this natural process using signal processing technique, it is possible to generate synthetic sounds that give the sensation of distance and direction even if the signal are heard through headphones.
3.2. ACOUSTIC INTERFACE CHAPTER 3. AUDIO GUIDANCE INTERFACE
expensive, they require high quality speakers and microphones. Moreover, it is required to build a mechanical setup to hold the instrumentation in precise spatial points. Preferably, measurements are performed in anechoic chamber to minimize noise and reverberation, and recording sessions takes a lot of time during which the listener is required no to move his head because head movements would produce a loss in accuracy of the collected data. Even if several free databases of HRTFs exists, the impulse response are highly subjective because they are based on anthropomorphic features that change from person to person.
Another approach is based on modeling the sound propagation phenomena and syn-thesize HRTFs based on anthropometric information. This gives us more flexibility, since we are not tied to discretized measurement point as happens for measured HRTF, and we can tune the model parameters to fit the individual user. This solution is also convenient for an embedded implementation because it is considered faster to compute. This aspect is very important, given that the sound position must be updated in real–time as the user moves in the environment. Moreover, the interface delay must be limited to ensure a correct interpretation of the guidance stimuli while the user moves his/her head. This approach makes possible to synthesize a sound that provide a continuous reference point that the user can follow. Alternatively, the sound may be activated only when the user is requested to change direction, contextually with the haptic feedback implemented on the
c-Walker.
In order to render more realistic sounds, and especially to counteract the perception of inside the head locatedness that afflicts synthetic 3D sounds, we introduced some amount of reverberation. This is accomplished using the Image Source Method which consist of replicating the sound as virtual images resulting from the reflections of the sound waves on the walls. The replicas are attenuated to account for the loss in energy due to the absorption and the longest path with respect to the direct sound. More complex rever-beration algorithm are not necessary. Not only they are more computationally intensive, but it has been shown that only the first order reflections are useful to help with the localization process, while heavy reverberation on the contrary may cause confusion to the listener.
CHAPTER 3. AUDIO GUIDANCE INTERFACE 3.2. ACOUSTIC INTERFACE
discriminate ambiguous sound position in real world, therefore it is useful to recreate the same possibility even in the synthetic guidance interface to make it more natural.
3.2.1 Rendering spatial sounds
As discussed in the introduction of this chapter, the most accurate method to recreate 3D sound is based on measured HRTF, or their Fourier transform (HRIR). HRTFs represent the response of the human ears and body for a given direction of the incoming sound and individual anthropometry. Because this response changes from person to person, HRTFs have to be measured for each individual. Nonetheless, there exist databases of freely available HRTFs for research purposes [1, 70, 16].
The use of this method requires large memory to store the filter coefficients and the resulting filtering process is computationally demanding. Another disadvantage of HRTF– based sound rendering is that it lacks the sensation of distance and movement; therefore these effects have to be separately implemented by means of proper algorithms (e.g., Doppler effect, reverberation) [13, 22]. Moreover, measure responses are obtained in dis-crete spatial locations around the listener. To spatialize sounds in intermediate positions that were not measured, there is the need for techniques to estimate HRTFs by interpo-lation of adjacent contributions. Therefore, additional processing would introduce delay and approximations.
For mobility aids, a high accuracy of representation is not required, but a sensation of spaciousness and displacement must be provided. Our work is also motivated by the intent of lowering computational needs, in order to permit the implementation on an embedded system. For this reason, we have adopted a model-based approach in which we reproduce the sound wave propagation. The goal is to create a model with a reasonable good spatial resolution, and a low complexity. This also avoids having to measure the actual response.
3.2. ACOUSTIC INTERFACE CHAPTER 3. AUDIO GUIDANCE INTERFACE
3.2.2 Propagation Model
To provide an authentic spatial representation, sounds must be processed so that they give a sensation of direction and spaciousness of the scene. The sensation of direction depends on the relative position between the listener and the sound event, and on the listener’s anthropometric features. The sensation of distance and spaciousness in the scene can be rendered by combining two methods. The primary cue of range comes from the amplitude of the incoming sound, which decreases linearly with the distance. However, this cue alone is not sufficient for accurate range judgments, and humans in daily life take advantages of reverberation cues in solving the task of range recognition. Reverberation depends on the room size, its geometry, the materials on the surfaces and the presence of other objects. Contrary to directional cues, this aspect is not subjective, so there is no need for individualization.
3.2.3 Interaural Time Difference
Analyzing how HRTFs are composed, it turns out thy are the result of the superimposition of multiple effects. Thus, it is possible to create each effect separately and sum the contributions to generate an artificial sound that contains all the cue to obtain a convincing effect. We first analyze the left/right displacement of sounds. One of the major cues for sound localization is the Interaural Time Difference (ITD) that is the transient time difference between the two ears due to the differential distance between ears and the sound source.
Horizontal plane
azim uth
range 0°
right
left θ
r -90°
+90°
Figure 3.1: The vertical polar coordinate system.
We use a polar coordinate system as shown in Figure 3.1. The signal on the con-tralateral ear channel is delayed to account for the interaural time difference ∆T, given by
∆T = a
c(sinθ+θ), (3.1)
CHAPTER 3. AUDIO GUIDANCE INTERFACE 3.2. ACOUSTIC INTERFACE
and θ is the azimuthal angle, which takes value 0 in front of the listener, negative values on the left hand side and positive values on the right. For an average human head radius of 8.75 cm, the maximum delay at θ = ±90◦ is 660 µs. With a sampling frequency of Fs= 44.1 kHz, the maximum delay corresponds to about 29 samples.
3.2.4 Interaural Level Difference
Another cue for the localization of sounds lying on the horizontal plane is the Interaural Level Difference (ILD) or Interaural Intensity Difference (IID). In fact, sounds impinging the ear coming from different paths are attenuated according to the different length of the path, and due to the presence of the head of the listener. The effect of the path is easily inserted in the model considering the attenuation in amplitude is equivalent to the inverse of the path length. The shadowing effect introduced by the head is frequency dependent. However, this effect can be modeled as a single pole/single zero filter.
The interaural level difference is accounted by the shadowing effect introduced by the listener’s head, computed using a low pass filter on the signal of the contralateral ear, with the transfer function:
H(ω, θ) = 1 +j
αω 2ω0
1 +j2ωω
0
. (3.2)
The coefficientα, which depends on θ, controls the location of the zeros and is defined as:
α(θ) =
1 + αmin 2
+
1− αmin
2
cos θ θmin
180◦
!
with the values αmin = 0.1 and θmin = 150◦ to produce a convincing approximation
of a spherical head model [10]. In our implementation, the software computes for each given value of θ the correct coefficients that model the frequency dependent low pass phenomenon introduced by the listener’s head. This model does not account for the reflection of sound on the shoulders, which are typically included in measured HRIRs, and which would require a larger number of taps. Measured HRIRs, however, only consider a listener facing forward, and are not accurate when the head is turned or tilted. Thus, not including these reflections in the model makes it less computationally demanding and excludes contributions that may introduce confusion when the listener head is not facing forward.
3.2. ACOUSTIC INTERFACE CHAPTER 3. AUDIO GUIDANCE INTERFACE
3.2.5 Rendering Sensation of Elevation
While the left/right sensation is based mainly on differences in amplitude and time at the two ears, the sensation of sound elevation is a monaural cue. To recognize the elevation of a sound source, the human brain bases the judgment on reflections that originated from the interaction of impinging sound wave with the external ear or pinna. In fact, the folds of the pinna introduce some “echoes” that depend on the direction of arrival of sound waves. To model the effect of the pinna reflections, the software introduces six attenuated and delayed replicas of the direct sound. The elevation angle, φ, takes value φ = 0 for sound sources lying on the horizontal plane, and positive values for locations above the horizon. In this model, the components due to reflections that originate from the interaction of sound waves with the shoulder are ignored. In particular, the time delay for the nth replica depends on both the azimuthal and elevation angles, and it is defined
as:
τn(θ, φ) =Ancos(θ/2) sin[Dn(90◦−φ)] +Bn
where An represents the amplitude of the replica,Bn is a time offset, and Dn is a scaling
factor. All values are expressed in number of samples atFs. To implement the algorithm,
we use the model values from the previous work done by Brown and Duda [10]. Said values have been obtained by experimental measurements of three subjects, and from the empirical study it has been shown that only the variable Dn must be adapted to the
individual listener. We included in our sound synthesis software the model for a generic head including the common model values reported in the literature. In Table 3.1, we report variable values for the calculation of the time delay (τ) and the reflection coefficient (ρn)
for the n replicas.
Table 3.1: Pinna model coefficients
n ρn An Bn Dn
2 0.5 1 2 1
3 -1 5 4 0.5
4 0.5 5 7 0.5
5 -0.25 5 11 0.5
6 0.25 5 13 0.5
3.2.6 Reverberation
CHAPTER 3. AUDIO GUIDANCE INTERFACE3.3. MODELING THE AUDIO GUIDANCE INTERFACE
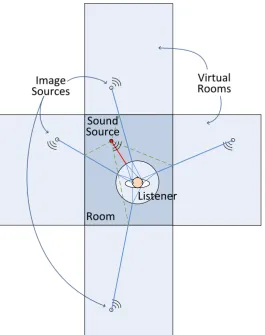
sensation of perceiving the sound as coming from inside the listener’s head instead of coming from the surrounding space [5]. There exist many reverberation techniques [42]. Many of them are very complex and are able to produce at the output an effect very similar to the reverberation of the real room [31]. Unfortunately, this translates into a time demanding and memory hungry implementation. Moreover, these reverberation algorithms are parameterized on room geometry, size and materials but do not take into account the position of sound source and observer inside the room. This means they do not increase the sensation of locatedness. Our choice for reducing the computational complexity of the system and in the meantime taking care of relative positions of sound elements in the room is to adopt the so-called Image Source Method (ISM) [9]. In the ISM each wall is equivalent to a reflective surface. A sound wave reflecting off a wall is equivalent to having a virtual source on the mirror image of the original, behind the wall (see Figure 3.2). In our work a simple ISM technique is implemented, considering only four contributions inside a virtual rectangular room whose dimensions are proportional to the distance of the farther objects to be rendered. This means that the resulting sound is made by the superimposition of five virtual sound sources.
3.3
Modeling the Audio Guidance Interface
The c-Walker is equipped with several interconnected computing platforms including a Beaglebone, a Beagleboard, and a laptop. The software application is made of several independent modules that carry out the different tasks that compose the overall appli-cation. Some of the modules can be active or disabled according to the functionality of interest. For example, the software that perform the guidance using acoustic signals can work without activating other guidance interfaces, or can be active when also the haptic guidance is active, or can be switched off is it is not needful. As a consequence, the computing requirements of the overall application may change according to which of the modules is enabled. Each application module can be mapped in any of the computing platforms, and the performance (i.e. the execution time) change accordingly. The objec-tive of this analysis, is to use the design environmentmetroIIto evaluate the execution
time of the application to identify the optimal mapping of the software components into the computing platforms.
3.3. MODELING THE AUDIO GUIDANCE INTERFACECHAPTER 3. AUDIO GUIDANCE INTERFACE
Virtual Rooms
Room Image
Sources
Listener Sound
Source
Figure 3.2: Intuitive graphical representation of the Image Source Method implementation.
on the headphone arches. The auditive guidance signal are processed using the algorithm described in previous sections.
CHAPTER 3. AUDIO GUIDANCE INTERFACE3.3. MODELING THE AUDIO GUIDANCE INTERFACE
Processor SoundCard
Imu_Task
Planner_Task
audioProc_Task Playback_Task
Person_Task MAPPING
Constraints Solvers
Audio processing FIFO playback FIFO person
FIFO IMU FIFO
FIFO Planner FIFO
Constraints Solvers
updatePlan getIMUcoordinates
computeSound reproduceSound
movePlan moveHead listentoSound
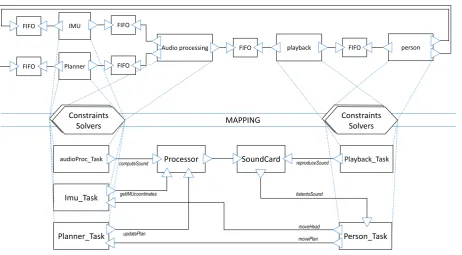
Figure 3.3: ThemetroIImodel for the binaural guidance system.
efficacy. Moreover, the audio processing and the planning algorithms have their periodicity and execution time which depend also on the computing platform. The the composition of the two software module into the target architecture can have performance such as to make the continuous reproduction of the guidance stimuli possible or not possible. We mapped several platform to identify the combinations that allows the system to reproduce the guidance stimuli without interruptions.
The general block diagram of the complete system is shown in Figure 3.3. Referring to the proposed methodology, we created a cyber model consisting of all the software com-ponents that express the functionality, as well as their corresponding architectural tasks. In addition, we have included a Processor and the SoundCard as architectural compo-nents to represent the computing platform. The physical part is needed to describe the physical time and the movements, or rather the variation of the spatial coordinates. The movements of the users are described by thePerson component. To reflect its interaction with other components, and to map it correctly inmetroII, thePerson component is
in-cluded in the architectural as well as in the functional model. The functional components are extended to include the description of physical interactions. In case a designer aims at modeling the precise human behavior [44], details regarding sound localization perfor-mance and degree of cooperation of the human can be implemented within the Person
3.4. PHYSICAL MODEL CHAPTER 3. AUDIO GUIDANCE INTERFACE
3.4
Physical Model
Since physical quantities of interest (i.e., time) are handled inside the metroII architec-tural model, physical model components belong to the architecture. The audioProc Task, the Imu Task, the Planner Task, and the playback Task have a dual role: they represent the architectural component of their functional counterparts, and they receive, modify, and forward physical data. The physical model includes the presence of the user of the
c-Walker that is represented by the thread implemented within thePerson Task compo-nent. The presence of this component models the interaction of the user with the binaural guidance system. From one side, the user receives the guidance sound stimuli which con-vey spatial information encoded as the spatial location of the virtual sounds. On the other hand, the user movements change the position in space of the assistive device, and these variations are captured by the Planner Task. The person can also move his/her head independently, and this is monitored by the IMU Task. The physical model is completed including the interfaces to communicate with the Processor and theSoundCard.
From a functional viewpoint, the interface between the playback and the person trans-mits the sequence of samples representing the sound signal. But, from the physical point of view, the interface between the SoundCard and the Person Task component models the exchange of spatial coordinates. In order to model the presence of the user, and to model the feedback between the sound reproduction and the subsequent movements of the user, a functional Person component is added to the cyber model of the system. Within the Person component it is possible to map the Person Task behavior to close the loop of the system output toward the inputs.
3.5
Cyber Model
The cyber model consists of the software components of the binaural guidance system, and the hardware components that support their execution. In particular, the Audio Processing component contains the algorithm that transforms a monaural audio signal into a binaural stimulus. The computation works on a period buffer which is then fed to the sound card to be reproduced. The size of the period buffer matters, because it influences the latency of the computation. Once a number of samples of audio output equal to the SoundCard period buffer size has been produced, they are forwarded to the playback component. The playback component models the reproduction of the audio signal.
TheAudio Processing component receives inputs from theIMU and thePlanner. The
com-CHAPTER 3. AUDIO GUIDANCE INTERFACE 3.6. FUNCTIONAL MODEL
putes the optimal trajectory for the user, and by knowing the actual position of the
c-Walker, provides to theAudio processing component the spatial coordinates of the next position to reach, i.e., the spatial location of the virtual sound source the audio process-ing component has to compute in the subsequent time interval. The Audio processing
aligns the absolute spatial coordinates according to the user head orientation and starts processing sound. The cyber model is completed including aProcessor and aSoundCard. The Processor supports the execution of all the software components,
3.6
Functional Model
The functional model we considered includes the following components:
IMU the communication with the Inertial Measurement Unit, used to monitor the lis-tener’s head orientation;
Planner which represents the algorithms used to determine the suggested trajectory, this calculation depends on the planned path, the real user trajectory and dynamics of the environment.
audioProcessing this module represents the audio synthesis algorithm, and it is used to encapsulate the time required to synthesize a chunk of sound;
Playback representing the reproduction of the auditive stimulus, and it lasts for the same amount of time of the audio chunk size.
Person represent the presence of the user/listener; this component closes the loop from the Playback and the pair IMU and Planner and the person encloses the physical part of the system under investigation.
3.7. ARCHITECTURAL MODEL CHAPTER 3. AUDIO GUIDANCE INTERFACE
audioProcessing component model the execution of the algorithm described in the previ-ous sections used for the generation of the navigation stimuli. The playback model the transfer of data from the memory location where samples were saved from the audioPro-cessing component, to the sound card buffer for the reproduction. The computation of the projected virtual sound source, the processing of the audio, and its reproduction follow a dataflow model, with the person movements expressed as consequence of the stimuli he/she listens to, and captured as inputs of the virtual sound source new coordinates. All the functional components communicate with each other through corresponding FIFO
elements. The scheduler controls the execution of the system by firing events according to the availability of resource and connections of the elements.
3.7
Architectural Model
The architectural model of the system is composed of:
Processor : the processor is used to represent the execution element of the cyber part of the system;
SoundCard : representing the interface between the processor, which synthesize the sound, and the listener component.
In addition to the components listed above, the architectural model includes aTask component
for each one of the functional components (for a total of seven architectural components), to capture the implementation of functional components and map it into the architec-ture. Architectural components communicate each other through shared memory. The
CHAPTER 3. AUDIO GUIDANCE INTERFACE 3.8. MAPPED SYSTEMS
3.8
Mapped Systems
We have estimated the performance of the system onto two different architectures. The first is a traditional laptop with a 2.53 GHz dual core CPU and 4 GB of RAM, to have a baseline performance model on a relatively high power device. The second platform is BeagleBoard–xM, equipped with a 1 GHz ARM Cortex–A8 core and 512 MB of RAM, which we have considered as representative of a class of small size, low power devices. Because of its small dimension, the BeagleBoard would be preferable if the system were to be engineered to be wearable, rather than being carried on the c-Walker.
The mapping of functional onto architectural components is labeled with execution time values, which were measured on the target platforms through profiling. Besides the two platforms, we also mapped four different configurations for the Planner, which differ in terms of the minimum dimensions of the grid used to represent the environment map. This affects both the accuracy of the route determination, as well as the computation time. The communication with the IMU can be configured in two ways: 1) considering only azimuthal angles, or 2) using values of roll, yaw and pitch. The first is associated with the rendering of binaural sounds laying on the horizontal plane only, while the second is associated to the reproduction of full 3D sounds. Their implementations differ, as well as, of course, the performance. The sound processing time depends on the size of the sound buffer, which determines the period of the computation. Longer buffers allow for longer computation time, but introduce latency. Finally, the playback time depends on the semantics of the playback system call: it is considered to be equal to the duration of the processed sound chunk for a blocking call, or is considered equal to 0 if the playback is called by a non-blocking function (we neglect the call and return time).
3.9
Results
3.9. RESULTS CHAPTER 3. AUDIO GUIDANCE INTERFACE 0 250 500 750 1000 1250 1500 B1 P1 B1 P2 B1 P3 B1 P4 3D B1 P1 3D B1 P2 3D B1 P3 3D B1 P4 3D B1 P1-b p 3D B1 P2-b p 3D B1 P3-b p 3D B1 P4-b p B2 P1 B2 P2 B2 P3 B2 P4 3D B2 P1 3D B2 P2 3D B2P3 3D B2 P4 3D B2 P2-b p 3D B2 P2-b p 3D B2 P3-b p 3D B2 P4-b p B4 P1 B4 P2 B4 P3 B4 P4 3D B4 P1 3D B4 P2 3D B4 P3 3D B4 P4 b b 3DB 4 P1 b b 3DB 4 P2 b b 3DB 4 P3 b b 3DB 4 P4 Del ay in m ill isec o n d s Mapped Systems
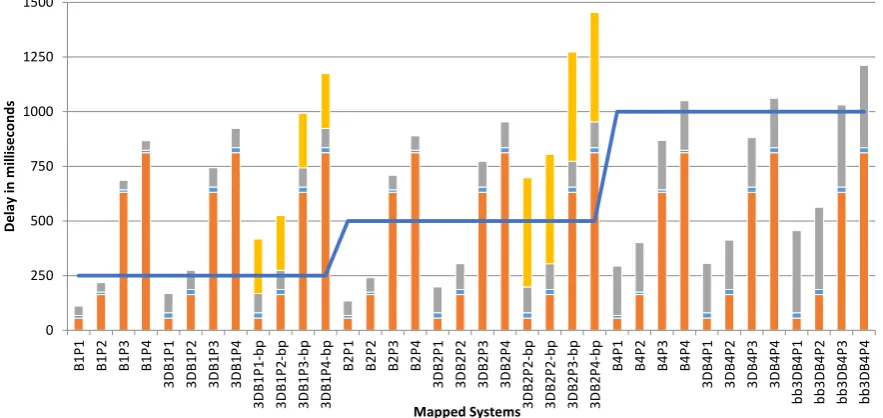
Figure 3.4: The binaural guidance estimated execution time. The blue line represents the maximum execution time required to perform continuous playback. On the bars, orange is the planner execution
time, blue is the time required by the IMU, grey is the audio processing time, while yellow is the blocking playback time.
tridimensional sound rendering, as opposed to using the horizontal plane only. The sound buffer size is configured using three different values: 250 ms (labeled as B1), 500 ms (B2) or 1 second long (B4). The “-bp” suffix denotes a blocking playback call.
CHAPTER 3. AUDIO GUIDANCE INTERFACE 3.10. PROCESSING OF MOVING SOUNDS
to adopt the notebook, because the implementations on the BeagleBoard do not respect the 50 ms deadline for the correct interpretation of the guidance sounds in any of the implementations. A more powerful portable platform should therefore be investigated for a wearable implementation.
3.10
Processing of moving sounds
The binaural sound synthesis algorithm has been implemented adopting the techniques described in the previous sections. To improve the user feeling, and to ensure a proper operation of the guidance system even while the user moves the head, we included the possibility of rendering sound movements. However, rendering moving sounds using HRTF poses some problems either they are measured or synthetically generated. The generation of binaural sounds is obtained by means of digital filters. When the virtual sound source moves from one position to another, the filter coefficients must change accordingly. Thus, moving sounds are rendered using time–varying filters. Moreover, traditional 3D sound generation techniques does not include the computation of the time delay of the incoming sounds which would make the sensation of distance more authentic. In our software, the time delay depends on the distance between the sound source and the listener’s ears, and may change in time according the movements. As a result, processing fast changes of the time delay, or updating the filters coefficients, will results in clicks, pops, or clipping of the output sound signals.
When synthesizing digital sound, the time is discretized at the sampling frequency. This means that there would be a data of sound amplitude (sample) for each time pe-riod, and generally the data is stored in arrays (playback buffer). But in general, when modeling physic of sound waves, time delays may correspond to a non-integer multiple of the sampling period. In this case, the non-integer delay must be rounded to the nearest integer in order to put the sound sample in the corresponding position of the playback buffer. As a consequence of this approximation some annoying phenomena originate. To remove these noises one can introduce a low–pass filter in cascade to the rendering filters to remove high–frequency impurities. However, this introduces phase distortions that could mitigate the feeling of spaciousness. Moreover, if the resulting sound is made of many contributions, the result is prone to quantization errors.
3.11. ANALYSIS OF MOVING SOUNDS CHAPTER 3. AUDIO GUIDANCE INTERFACE
sorted sequence of two floating point values: the sample amplitude, and the sample delay. With a given time period, corresponding to the playback buffer size, the pair sequence is sampled with the playback sampling frequency, corresponding to 44.1 kHz, by linear interpolation of adjacent samples.
Considering the the delays only, the interpolated ITD or the overall time delay com-puted for the specific spatial location may correspond to a non–integer sample delay, which is not realizable using conventional, integral–tapped delay line, or buffer implemented as arrays. With traditional implementation, the non–integer delay must be rounded to the nearest integer value, and abrupt changes in delay times for closely neighboring spatial location could result from this type of ITD quantization error. The problem is exacer-bated if the trajectory of the sound sources change quickly. Moreover, changes in the left and right HRTF filters themselves could produce a disruption in the output.
Our implementation treats each sample as a pair of amplitude and delay values, car-rying the advantages of the interpolated delay lines, a well-known structure used in the implementation of some physical models which allows for a non-integer sample delay [63]. It is important to note that interpolated delay lines attenuate the high-frequency com-ponents of sounds, and therefore the systems overalls intended spatialization effects may be altered due to the interpolated delay lines spectral coloration. Nonetheless, informal listening seems to suggest that use of interpolated delay lines does not appreciably change the spatialization of most sounds [13]. Thanks to this implementation, we not only have reduced the number of filtering components, removed the quantization noise, and reduced the system complexity, but we also made possible the reproduction of the Doppler effect without overhead.
3.11
Analysis of moving sounds
CHAPTER 3. AUDIO GUIDANCE INTERFACE 3.11. ANALYSIS OF MOVING SOUNDS
3.11.1 Case without the Doppler Effect
0 200 400 600 800 1000 1200 1400 1600 1800
0 5 10
FFT of quantized delay vs. Map
0 200 400 600 800 1000 1200 1400 1600 1800
0 5 10
FFT of quantized delay vs. reference
0 200 400 600 800 1000 1200 1400 1600 1800
0 5 10
FFT of Map vs. reference
Figure 3.5: Fourier transform of the difference between the standard and the proposed algorithm (top), the
standard and the baseline (center), and the proposed vs. the baseline (bottom) for a circular trajectory.
In this study, we considered sounds moving along a circular (fixed radius) trajectory around the listener’s head. Since the distance between the center of the head and the sound source is constant during the experiment, there is no Doppler effect. In particular, we compare:
1. sounds obtained using quantized delay, as usually happens when storing digital sam-ples on buffers,
2. sounds obtained using the described approach where digital sound processing is done simulating analog time resolution and discretized at the end of the processing chain,
3. the baseline or reference case, that should represent the real–world case, obtained using the traditional approach, but using a very high sampling frequency.
In particular, for the last case, we use a sampling frequencyFs0 = 1000×Fs= 44.1 MHz.
corre-3.11. ANALYSIS OF MOVING SOUNDS CHAPTER 3. AUDIO GUIDANCE INTERFACE
sponding the the musical note A and is used as a general tuning standard for musical pitch.
In Figure 3.5, from top to bottom, we show the Fourier transform of the signals resulting from the sample–by–sample difference of 1. the standard quantized delay and the proposed algorithm (labeled as Map), 2. the standard approach and the reference obtained at Fs0, 3. the proposed algorithm and the reference. The baseline signal has been down–sampled after synthesis with linear interpolation to match the sampling frequency of the other two cases. The difference of the FFT of the signal obtained with the quantized delay and the reference one is large and corrugated. The difference between the signal obtained with the proposed approach and the case with quantized delay is harsh as well. The comparison between the Mapand the baseline instead is smooth and has a much lower maximum.
0 200 400 600 800 1000 1200 1400 1600 1800
-2 -1 0 1
2 Spectral difference quantized delay vs. reference
0 200 400 600 800 1000 1200 1400 1600 1800
-2 -1 0 1
2 Spectral difference quantized delay vs. Map
0 200 400 600 800 1000 1200 1400 1600 1800
-2 -1 0 1
2 Spectral difference Map vs. reference
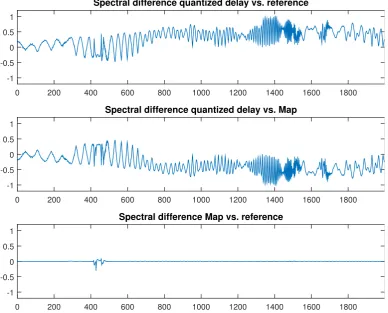
Figure 3.6: Difference between the spectra of the quantized delay algorithm vs. the reference (top).
Difference between the spectra the proposed algorithm and the quantized delay algorithm (center). Com-parison of the proposed algorithm and the baseline (bottom).