* Corresponding author. E-mail address: [email protected], [email protected] (K. Seifpanahi-Shabani).
Journal Homepage: ijmge.ut.ac.ir
Experimental study of lead (II) removal using polymorphous silica
adsorbents
Saleh Nosrati
a, Kumars Seifpanahi-Shabani
a, *, Mohammad Karamoozian
a aFaculty of Mining, Petroleum and Geophysics, Shahrood University of Technology, Shahrood, IranABSTRACT
Adsorption of lead(II) as a major heavy metal pollutant onto nano-adsorbents of Andalusite, Kyanite and Sillimanite was studied in a batch system. Nano-adsorbents were prepared via crushing, using a planetary ball mill and then characterized by different analyses such as: SEM, XRD, XRF and FT-IR. Major factors affecting the adsorption process were studied including pH, adsorbents dosage, initial metal concentration and temperature. Afterward, the adsorption process was studied isothermally, kinetically, and thermodynamically. The results show that aluminum silicates polymorphs are efficient adsorbents for removal of lead(II) and the removal exceeds 90%. The Freundlich isotherm model was best fitted with the experimental data. Chemisorption may control the rate of adsorption due to following the pseudo-second-order kinetic model. Thermodynamic investigation proved low randomness, exothermic and spontaneous nature of the process.
Keywords : Andalusite, Kyanite, Sillimanite, Adsorption, Lead(II) ion
1.
Introduction
With the development of industry, heavy metal pollution has become a serious problem. The toxicity, difficulty of degradation and immigration of heavy metals have made them an important hazard [1]. Mining industry threats environment in different aspects. One of them is the procedure of ore dressing and smelting which produces large amounts of wastewater and mining tails enriched in heavy metals and threats nearby groundwater, streams and farming lands [2]. Lead (Pb) is considered as one of the most toxic heavy metals. Even at very low concentrations, it can cause serious problems for different parts of the human body such as the brain, kidneys and the circulatory system which can increase the possibility of cancer, anemia and intellectual disabilities [3]. Due to anthropogenic activities, specially mining, in the last two centuries, there has been an extensive release of lead in nature [4].
Among the different methods have been used to remove Pb(II) [5– 11], adsorption is a cost-effective and a capable processing technique for wastewater with low lead concentrations [12]. Aluminosilicates Polymorphs have the same chemical composition (Al2SiO5), but
different crystallographic systems [13, 14] and they are widely used as refractory materials [15–17]. Fig. 1 shows the effect of temperature-pressure conditions on the formation of aluminosilicates.
How aluminums distribute, depending on their coordination number, would cause crystallographic differences. Kyanite (Al[6]Al[6]SiO5), Andalusite (Al[6]Al[5]SiO5) and Sillimanite (Al[6]Al[4]SiO5) are crystalized in triclinic, orthorhombic and orthorhombic systems, respectively. A schematic diagram of three polymorphs of aluminum silicates is shown in Fig. 2.
Literature review shows that Kyanite has been used as a natural adsorbent for pollutants removal [19–21], but not as a nano adsorbent. Therefore, this paper aims to use polymorphs of aluminum silicate named Andalusite, Kyanite and Sillimanite as nano adsorbents for the removal of Pb(II) ion as a major pollutant.
2.
Materials and Methods
2.1.Materials
Andalusite, Kyanite and Sillimanite raw materials were obtained from the Hamadan aluminosilicatemine, Iran. All used reagents were of analytical grade and the solutions were prepared with deionized water. The lead solutions were prepared with 99% lead nitrate, (Pb(NO3)2)
manufactured by Merck Company and all other chemicals including sodium hydroxide and chloridric acid as well.
Fig. 1. Effect of Temperature-pressure conditions on the formation of aluminosilicates [18].
2.1. Adsorbents Preparation
After being washed with distilled water, the raw samples were heated at 100⁰C for 8 hours. Then, they were crushed using a planetary ball mill (Narva-MPM-2*250H) for 5 hours in 550rpm. To distinguish the nano sized particles, SEM (LEO-1455VP) analysis was used. Fig. 3 shows the procedure.
Article History:
Fig. 2. Crystallography of Kyanite, Sillimanite and Andalusite minerals [18].
Fig. 3. The procedure of preparation of nano adsorbents with physical treatments.
2.2.Nano adsorbents Characterization
To investigate the chemical and physical properties of Andalusite, Kyanite and Sillimanite nanoparticles (ANPs, KNPs and SNPs, respectively), different analyses were carried on, including XRF, XRD, SEM and FT-IR.
The chemical composition of modified ANPs, KNPs and SNPs analyzed by Shimadzu XRF-1800 are shown in Table 1. According to
Table 1, the major components are Al2O3, SiO2 and Fe2O3.
The XMD300-Unisantis analyzer used to investigate XRD patterns of ANPs, KNPs and SNPs which are shown in Fig. S1. According to XRD curves, major peaks consist of SiO2, Fe2O3 and Al2O3 are occur at 24○,
44○ and 67○ (2ϴ), respectively. Fig. S2 shows the surface morphology of modified ANPs, KNPs and SNPs using the SEM analysis (LEO-1455VP model). A similar vision is obvious for three nano adsorbents with granular, spherical and homogenous particles whose size is less than 100nm, totally.
Also, FT-IR curves were carried out to demonstrate the presence of different functional groups on adsorbents surface. Fig. S3 shows FT-IR spectra of nano adsorbents. For ANPs, KNPs and SNPs, seven main common absorption bands are observed at 458cm−1(B1), 607cm−1(B2),
976cm−1(B3), 1398cm−1(B4), 1629 cm−1 (B5), 3128 cm−1 (B6) and
3431cm−1(B7). BandsB1 and B2are deformation vibration of silica
tetrahedron and the vibration of Al–O octahedron. Band B3is attributed
to symmetrical and asymmetrical vibration of silica tetrahedron [22]. BandB4is the deformation band of molecular water. BandB5 is
attributed to the molecular adsorbed water. Band B6 is OH-related [23].
BandB7is related to OH defects on oxygen sites [24]. The intensity
ofB4, B5 andB6bands is closely related to the water content, similar to
other silicate materials, such as volcanic tuffs, diatomite, perlite and zeolites [25].
Table 1. XRF analyze of ANPs, KNPs and SNPs. Analyte ANPs (wt. %) KNPs (wt. %) SNPs (wt. %)
Al2O3 46.31 40.82 34.41
SiO2 34.37 32.13 38.35
Fe2O3 13.78 11.58 13.16
TiO2 1.92 2.26 3.50
MgO 0.03 5.98 2.81
ZrO2 0.31 3.09 2.14
CaO 0.75 0.68 0.86
MnO 0.02 0.27 0.15
P2O5 0.03 0.99 0.92
Na2O 1.00 1.71 1.34
K2O 1.48 0.49 1.75
Total 100 100 100
In order to understand the adsorption mechanism, it is necessary to study the zero point of charge. When pH ˃ pHzpc, the surface charge is
negative and when pH ˂ pHzpc, the surface charge of an adsorbent is
positive [26]. Based on experimental studies, the comparison of zero points of charge of Andalusite, Kyanite and Sillimanite are illustrate in
Fig. 4.
Fig. 4. Zero points of charge of Andalusite, Kyanite and Sillimanite.
According to Fig. 4, the zero points of charge of Andalusite, Kyanite and Sillimanite occur at pH 5.2, 5.9 and 8, respectively.
2.3.Experimental Studies
According to equation 1, a stock solution was made using an appropriate quantity of Pb(NO3)2. Then, the solutions of desired
concentrations were made by diluting the stock solution, using equation 2:
𝑚𝑔 𝑠𝑎𝑙𝑡 = 1000 ∗ (𝑚𝑜𝑙𝑒𝑐𝑢𝑙𝑎𝑟 𝑤𝑒𝑖𝑔ℎ𝑡 𝑎𝑡𝑜𝑚𝑖𝑐 𝑛𝑢𝑚𝑏𝑒𝑟⁄ ) (1)
𝑁1𝑉1= 𝑁2𝑉2 (2)
Where N1 and V1 are respectively the concentrations of stock solution
and the volume taken from it; and N2 and V2 are the concentration and
𝑅𝑒𝑚𝑜𝑣𝑎𝑙(%) = (𝐶0−𝐶𝑡
𝐶0 ) × 100 (3)
2.4.1. Effect of pH
At different pH values, metal ions appear in different forms. Because of that, pH plays an important role in the adsorption of metals on adsorbents surfaces. Depending on the pH of solution, Pb(II) can be presented in the form of Pb2+, Pb(OH)+, Pb(OH)20 and Pb(OH)3-1 [27].
When pH range is 1.8 to 5.8, lead presents as Pb2+ and when pH
approaches 6, a small portion of Pb(OH)+ forms [28] and for pH>6,
precipitation is the predominant process in the system [29]. Generally, in order to remove Pb(II) from an industrial wastewater, the optimum pH range is around 5-6. Based on the literature review and Fig. 4, we decided to study the effects of pH on adsorption at 4, 5 and 6. According to the surface charge of adsorbents and the charge of Pb in this range of pH, we estimated that adsorption best happens at 6 for ANPs and KNPs but for SNPs there should be no adsorption. The effect of pH on adsorption of Pb(II) is shown in Fig. 5A-C.
Fig. 5. Effect of pH on adsorption of Pb(II) onto ANPs (A), KNPs (B) and SNPs (C).
Based on Fig. 5A-C, maximum adsorption happens at pH 6 as expected. The increase in the amount of removal with pH increase from 4 to 6 could be due to the change of surface charge of adsorbents from positive to negative. At pH 6, the charge of Pb is positive and the surface charge of adsorbents is negative and the electrostatic interaction is the cause of adsorption.
According to Fig. 4 and the range of pH, we expected the same results as in Fig. 5 for two adsorbents, ANPs and KNPs. The ability of SNPs to adsorb Pb in pH 6, shows that the isoelectric point should be somewhere between pH 5-6. This opposition could be explained with the fact that the surface properties of aluminosilicate minerals are determined by the combination of Si-O and Al-O bonds. Therefore, it is expected that their ZPCs lie between pH 2 and 9. The ZPCs of these polymorphs depend
on the Si/Al ratio in their surface region. The presence of Li, Ca, K and Na ions in some aluminosilicate minerals may introduce deviation [30].
2.4.2. Effect of Adsorbents Dosage
Considering pH 6 as the optimum point, the effect of adsorbents dosage on the adsorption process was studied by decreasing the amount of adsorbents from 0.5 to 0.35, 0.2 and 0.05 gr. The results are shown in
Fig. 6A-C.
Fig. 6. Effect of adsorbents dosage on adsorption of Pb(II) by ANPs (A), KNPs (B) and SNPs (C).
According to Fig. 6, as the amount of adsorbents decreases, the adsorption efficiency and kinetic rate decrease due to the lack of adsorption surface.
2.4.3. Effect of Initial Pb(II) Concentration
At pH 6, the effect of pollutant concentration on adsorption process was studied at concentrations 15, 30 and 60 mg/L. The amount of adsorbents used in this part was 0.5g. The results are shown in Fig. 7A-C.
According to Fig. 7, the efficiency will decrease as the pollutant concentration increases. Increasing the pollutant concentration versus a constant amount of adsorbents would increase the pollutant/adsorbent ratio which results in the lack of adsorption surface.
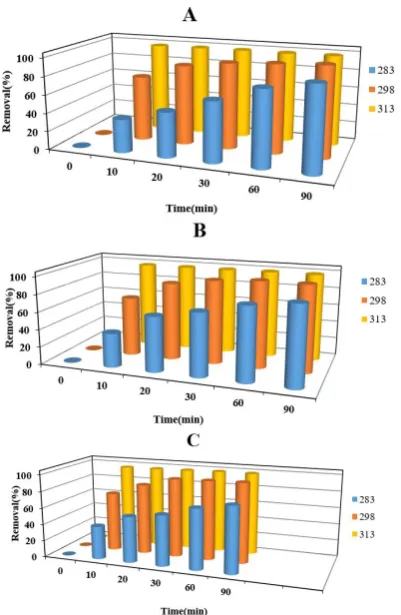
2.4.4. Effect of Temperature
The effect of temperature was studied at 283, 298 and 313⁰K using 0.5g of each adsorbent at pH 6 with an initial concentration of 30mg/L. The results are shown in Fig. 8A-C, emphasizing that at higher temperatures, the uptake occurs faster than the equilibrium time.
2.4.Adsorption Isotherms
Fig. 7. The effect of initial Pb(II) concentration on the adsorption process by ANPs (A), KNPs (B) and SNPs (C).
Fig. 8. The effect of temperature on adsorption of Pb(II) by ANPs (A), KNPs (B) and SNPs (C).
Table 2. Isotherm models and their linear forms. Isotherm
Model Equation A Linear Form Plot Ref.
Langmuir 𝒒𝒆=
𝒒𝒎𝑲𝑳𝑪𝒆 𝟏 + 𝑲𝑳𝑪𝒆
𝑪𝒆 𝒒𝒆
= 𝟏
𝑲𝑳𝒒𝒎
+ 𝟏
𝒒𝒎
𝑪𝒆
𝑪𝒆 𝒒𝒆vs.
𝑪𝒆 [31]
Freundlich 𝒒𝒆= 𝑲𝑭𝑪𝒆𝟏 𝒏⁄ 𝐥𝐧(𝒒𝒆) = 𝐥𝐧 𝑲𝑭+
𝟏
𝒏𝐥𝐧 𝑪𝒆 𝐥𝐧 𝒒𝒆vs. 𝐥𝐧 𝑪𝒆 [32]
Temkin 𝒒𝒆=
𝑹𝑻
𝒃 𝐥𝐧(𝑲𝑻𝑪𝒆)𝒒𝒆= 𝑹𝑻
𝒃 𝐥𝐧 𝑲𝑻+ 𝑹𝑻
𝒃 𝐥𝐧 𝑪𝒆 𝒒𝒆vs. 𝐥𝐧 𝑪𝒆 [33]
In Table 2, qe is the amount adsorbed at equilibrium (mg/g) and Ce is
the equilibrium concentration of solution (mg/l). For the Langmuir isotherm, qm is a constant related to the area occupied by a monolayer
of the adsorbate, reflecting the maximum adsorption capacity (mg/g) and KL is a direct measure of the intensity of adsorption (l/mg). In the
Freundlich isotherm, KF ((mg/g)(l/mg)1/n and n (dimensionless) are
constants incorporating all factors affecting the adsorption process such as the adsorption capacity and intensity, respectively. In the Temkin isotherm, R is the gas constant (8.314 J/Mol K), T is the absolute temperature (K), KT is the equilibrium binding constant (l/mg) and b is
the Temkin constant related to the heat of sorption (J/Mol). In Fig. 9A-C, the diagrams of isotherm modeling are shown.
Isotherm constants are shown in Table 3 as follow:
Table 3. Langmuir, Freundlich and Temkin isotherm parameters for adsorption of Pb(II) by ANPs, KNPs and SNPs.
Adsorbent Langmuir Freundlich Temkin
(mg/g) m
q KL R2 KF n R2 B KT R2
ANPs 82.645 0.446 0.786 24.824 1.475 0.974 15.980 5.200 0.930
KNPs 47.620 0.566 0.997 17.022 2.040 0.998 11.172 4.743 0.995
SNPs 256.410 0.043 0.780 10.981 1.140 0.922 19.559 1.500 0.857
According to Table 3, the adsorption of Pb(II) by aluminosilicate nanoparticles obeys the Freundlich equilibrium model due to its high correlation coefficient (R2).
2.5.Adsorption Kinetics
In order to study the speed of adsorption, we used pseudo first and second order kinetic models to investigate the adsorption of Pb(II) onto ANPs, KNPs and SNPs. Kinetic models and their linear form are shown in Table 4.
Table 4. Kinetic models and their linear form.
Kinetic Model Equation A linear form Plot Ref.
Pseudo-first order
𝑑𝑞𝑡
𝑑𝑡 = 𝑘1(𝑞𝑒− 𝑞𝑡)
ln(𝑞𝑒− 𝑞𝑡)
= ln 𝑞𝑒− 𝑘1𝑡 ln(𝑞𝑒− 𝑞𝑡) vs. 𝑡 [34]
Pseudo-second order
𝒅𝒒𝒕
𝒅𝒕= 𝒌𝟐(𝒒𝒆− 𝒒𝒕)𝟐
𝒕 𝒒𝒕
= 𝟏
𝒌𝟐𝒒𝒆𝟐
+𝟏 𝒒𝒆
𝒕 𝒕 𝒒𝒕vs.
𝒕 [35]
In Table 4, qe and qt are the amounts of adsorbed particles on the
adsorbent (mg/g) at equilibrium and at time t, respectively, k1 is the rate
constant of first-order adsorption (min-1) and k2 is the rate constant of
second-order adsorption (g/(mg min)). The diagrams for isotherm modeling of pseudo-first and second order are shown in Fig. 10A-B.
Fig. 10. Diagrams of pseudo-first-order (A) and pseudo-second-order (B) kinetic modeling.
The values of parameters obtained by kinetic models together with the amount of adsorption at equilibrium (qe Exp) are shown in Table 5.
Based on Table 5, the values of experimental qe are closer to pseudo
second order qe. Moreover, the high value of correlation coefficient
proves that the adsorption of Pb(II) onto ANPs, KNPs and SNPs follows the pseudo second order kinetic model. Therefore, chemisorption may be the rate controlling step.
Table 5. Pseudo-first and second order kinetic model parameters for adsorption of Pb(II) onto ANPs, KNPs and SNPs.
Adsorbent
Kinetic Constant
qe Exp. (mg/g) Pseudo-first-order Pseudo-second-order
(1/min) 1
K qe
(mg/g) R2 (g/mg/min)K2 (mg/g)qe R2 ANPs 0.060 7.990 0.875 0.030 15.060 0.998 14.780 KNPs 0.044 5.812 0.507 0.031 15.010 0.998 14.625 SNPs 0.085 8.644 0.895 0.035 14.663 0.998 14.360
The adsorption kinetic of Pb(II) was studied using an intra-particle diffusion model (equation 4) [36]:
𝑞𝑡=
𝑘𝑖
𝑚𝑡
0.5+ 𝐶 (4)
Where C is the intercept related to the thickness of the boundary layer, m is the mass of sorbent (g), qt the amount of solute adsorbed at
time t (mg/g) and Ki is the initial rate of intra-particle diffusion (mg/(l
s1/2)).
In the case of an intra-particle diffusion model, the plot of qt vs. square
root of contact time may result in a straight line, passing through the origin, indicating that the intra-particle diffusion is the sole rate limiting step [37]. Those plots are shown in Fig. 11.
Fig. 11. Intra-particle diffusion kinetic modeling of Pb(II) adsorption onto ANPs, KNPs and SNPs.
Fig. 11 illustrates multiline plots, showing that two steps are taking place. The first portion is the gradual adsorption stage where intra-particle diffusion is controlled by rate and the following portion is the final equilibrium stage where intra-particle diffusion slows down due to the low concentration in the solution. The intercept values show the possibility of some boundary layer operations. The external surface portion, i.e., film diffusion, is absent due to the completion before 10 minutes. It can be demonstrated that ANPs are more effective compared with KNPs and SNPs. The Ki values were estimated from the slopes of linear parts in Fig. 11 as presented in Table 6.
Table 6. Parameters of intra-particle diffusion model for the adsorption of Pb(II) onto ANPs, KNPs and SNPs.
Adsorbent Ki 1 r12 Ki 2 r22
ANPs 27.615 0.978 1.21 0.528
KNPs 30.231 0.999 4.447 0.887
SNPs 26.212 0.991 3.576 0.963
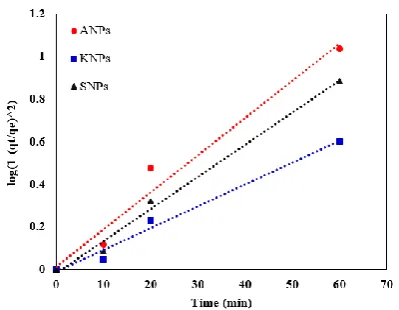
To prove the absence of the film diffusion step, the experimental data was plotted using the Boyed equation. If the plots are linear and pass through the origin, the slowest (rate controlling) step in the adsorption process is the internal diffusion [38]. Fig. 12 presents the Boyed plot.
Fig. 12. Boyed plot for the adsorption of Pb(II) onto ANPs, KNPs and SNPs.
2.7. Thermodynamic Study
The effect of temperature on the adsorption of Pb(II) onto ANPs, KNPs and SNPs was estimated by determining the free energy change (ΔG⁰), enthalpy change (ΔH⁰) and entropy change (ΔS⁰). Thermodynamic parameters were calculated using the following equations [39]:
𝐾𝑑= 𝑞𝑒
𝐶𝑒 (5)
∆𝐺° = −𝑅𝑇 ln 𝐾𝑑 (6)
ln 𝐾𝑑= ∆𝑆°
𝑅 −
∆𝐻° 𝑅
1
𝑇 (7)
∆𝐺° = ∆𝐻° − 𝑇∆𝑆° (8)
Where Kd is the equilibrium constant (L/mol), R is the gas constant
(8.314 J/mol K) and T is the temperature (K). Considering the relationship between ΔG⁰ and Kd, ΔH⁰ and ΔS⁰ were determined from
the slope and the intercept of the Van`t Hoff plots of ln(Kd) vs. 1/T.
The calculated thermodynamic parameters are presented in Table 7. Table 7. Values of thermodynamic parameters for adsorption of Pb(II) onto
ANPs, KNPs and SNPs.
Adsorbent ΔH (kJ/mol) ΔS (J/mol K) 283⁰K ΔG (kJ/mol) 298⁰K 313⁰K ANPs -23.361 0.008 -25.713 -25.838 -25.963 KNPs -30.354 0.014 -34.566 -34.566 -34.778 SNPs -65.245 0.126 -102.904 -102.904 -104.800
Negative values of ΔG⁰ confirm the spontaneous nature of the adsorption process. In addition, the increase in the negative ΔG⁰ values with an increase of temperature indicates that the adsorption process becomes more favorable at higher temperatures. For all the reactions, the enthalpy values are negative, showing that the adsorption process is exothermic. Low positive values of entropy prove a low randomness at the solid/solution interface.
3.
Conclusion
For a long time, Andalusite, Kyanite and Sillimanite minerals have been used as refractory materials. In this study, we used these minerals as the adsorbents to remove Pb(II) after being prepared and crushed to reach a nonmetric size. In order to be characterized, different methods were used such as: XRD, XRF, SEM and FT-IR. Major components of the adsorbents were Al2O3, SiO2 and Fe2O3. This paper investigated the
adsorption of Pb(II) onto ANPs, KNPs and SNPs based on the effects of pH, initial Pb concentration, adsorbent dosage, and temperature. Kinetic and equilibrium data was studied as well. The results showed that the best adsorption happened at pH 6, and the higher temperature had a better effect together with higher adsorbent and lower pollutant concentrations. The adsorption process obeyed the Freundlich isotherm and the pseudo second order kinetic models. Thermodynamic investigations showed that process was spontaneous, exothermic with
low randomness at solid/solution interface. This study proved that ANPs, KNPs and SNPs had a high adsorption capacity and adsorption rate for the removal of Pb(II). Therefore, they could be potential candidates for the removal of heavy metals from wastewaters.
Acknowledgment
The authors are grateful to the financial and technical supports provided by the Shahrood University of Technology.
REFERENCES
[1] L. Ning, Y. Liyuan, D. Jirui, and P. Xugui, “Heavy Metal Pollution in Surface Water of Linglong Gold Mining Area, China,” Procedia Environ. Sci., vol. 10, no. 5, pp. 914–917, 2011.
[2] X.-F. Hu, Y. Jiang, Y. Shu, X. Hu, L. Liu, and F. Luo, “Effects of mining wastewater discharges on heavy metal pollution and soil enzyme activity of the paddy fields,” J. Geochemical Explor., vol. 147, pp. 139–150, 2014.
[3] X. Li, Z. Wang, Q. Li, J. Ma, and M. Zhu, “Preparation, characterization, and application of mesoporous silica-grafted graphene oxide for highly selective lead adsorption,” Chem. Eng. J., vol. 273, pp. 630–637, 2015.
[4] J. Pareja-Carrera, R. Mateo, and J. Rodríguez-Estival, “Lead (Pb) in sheep exposed to mining pollution: Implications for animal and human health,” Ecotoxicol. Environ. Saf., vol. 108, pp. 210–216, 2014.
[5] O. Ait Ahmed, Z. Derriche, M. Kameche, A. Bahmani, H. Souli, P. Dubujet, and J. M. Fleureau, “Electro-remediation of lead contaminated kaolinite: An electro-kinetic treatment,” Chem. Eng. Process. Process Intensif., vol. 100, pp. 37–48, 2016.
[6] K. K. Bhatluri, M. S. Manna, A. K. Ghoshal, and P. Saha, “Supported liquid membrane based removal of lead(II) and cadmium(II) from mixed feed: Conversion to solid waste by precipitation,” J. Hazard. Mater., vol. 299, no. Ii, pp. 504–512, 2015.
[7] C.-V. Gherasim, J. Křivčík, and P. Mikulášek, “Investigation of batch electrodialysis process for removal of lead ions from aqueous solutions,” Chem. Eng. J., vol. 256, pp. 324–334, 2014.
[8] S. Mehdipour, V. Vatanpour, and H. R. Kariminia, “Influence of ion interaction on lead removal by a polyamide nanofiltration membrane,” Desalination, vol. 362, pp. 84–92, 2015.
[9] M. Tsunekawa, M. Ito, S. Yuta, S. Tomoo, and N. Hiroyoshi, “Removal of lead compounds from polyvinylchloride in electric wires and cables using cation-exchange resin,” J. Hazard. Mater., vol. 191, no. 1–3, pp. 388–392, 2011.
[10] A. Gholami, A. R. Moghadassi, S. M. Hosseini, S. Shabani, and F. Gholami, “Preparation and characterization of polyvinyl chloride based nanocomposite nanofiltration-membrane modified by iron oxide nanoparticles for lead removal from water,” J. Ind. Eng. Chem., vol. 20, no. 4, pp. 1517–1522, 2014.
[11] S. Li, Y. Wei, Y. Kong, Y. Tao, C. Yao, and R. Zhou, “Electrochemical removal of lead ions using paper electrode of polyaniline/attapulgite composites,” Synth. Met., vol. 199, pp. 45– 50, 2015.
[12] H. Ren, Z. Gao, D. Wu, J. Jiang, Y. Sun, and C. Luo, “Efficient Pb(II) removal using sodium alginate–carboxymethyl cellulose gel beads: Preparation, characterization, and adsorption mechanism,” Carbohydr. Polym., vol. 137, pp. 402–409, Feb. 2016.
[14] L. C. Zhou and Y. M. Zhang, “Flotation separation of Xixia andalusite ore,” Trans. Nonferrous Met. Soc. China (English Ed., vol. 21, no. 6, pp. 1388–1392, 2011.
[15] T. Wala, B. Psiuk, J. Kubacki, K. Stec, and J. Podwórny, “Mullitization process of andalusite concentrates - Role of natural inclusions,” Ceram. Int., vol. 40, pp. 5129–5136, 2014.
[16] T. V. V. Kumar, S. Prabhakar, and G. B. Raju, “Adsorption of oleic acid at sillimanite/water interface.,” J. Colloid Interface Sci., vol. 247, no. 2, pp. 275–281, 2002.
[17] S. Prabhakar, G. Bhaskar Raju, and S. Subba Rao, “Beneficiation of sillimanite by column flotation-a pilot scale study,” Int. J. Miner. Process., vol. 81, pp. 159–165, 2006.
[18] C. Klien, B. Dutrow, and J. Dana, The 23rd ed. of the Manual of Mineral Science. Hoboken: J. Wiley & Sons, 2008.
[19] C. Varlikli, V. Bekiari, M. Kus, N. Boduroglu, I. Oner, P. Lianos, G. Lyberatos, and S. Icli, “Adsorption of dyes on Sahara desert sand,” J. Hazard. Mater., vol. 170, pp. 27–34, 2009.
[20] M. Ajmal, R. a K. Rao, R. Ahmad, J. Ahmad, and L. a K. Rao, “Removal and recovery of heavy metals from electroplating wastewater by using Kyanite as an adsorbent,” J. Hazard. Mater., vol. 87, no. 1–3, pp. 127–137, 2001.
[21] R. A. K. Rao, M. A. Khan, and B. H. Hameed, “Sorption/desorption studies on some natural minerals for the removal of toxic organic pollutants from aqueous solution,” Chem. Eng. J., vol. 152, no. 2–3, pp. 421–427, 2009.
[22] H. Zhu, H. Deng, and C. Chen, “Flotation separation of andalusite from quartz using sodium petroleum sulfonate as collector,” Trans. Nonferrous Met. Soc. China, vol. 25, no. 4, pp. 1279–1285, 2015. [23] R. Karanth, “FT-IR Spectroscopic Investigation of Hydrous
Components in Sillimanite from Eastern Ghat Granulite Belt, India,” Gondwana Res., vol. 2, no. I, pp. 89–94, 1999.
[24] M. Wildner, A. Beran, and F. Koller, “Spectroscopic characterisation and crystal field calculations of varicoloured kyanites from Loliondo, Tanzania,” Mineral. Petrol., vol. 107, no. 2, pp. 289–310, 2013.
[25] K. Seifpanahi Shabani, F. Doulati Ardejani, K. Badii, and M. E. Olya, “Preparation and characterization of novel nano-mineral for the removal of several heavy metals from aqueous solution: Batch and continuous systems,” Arab. J. Chem., 2013.
[26] W. Liu, C. Yao, M. Wang, J. Ji, L. Ying, and C. Fu, “Kinetics and thermodynamics characteristics of cationic yellow X‐GL adsorption on attapulgite/rice hull‐based activated carbon nanocomposites,” Environ. Prog. Sustain. Energy, vol. 32, no. 3, pp. 655–662, 2013.
[27] X. Li, Z. Wang, Q. Li, J. Ma, and M. Zhu, “Preparation , characterization , and application of mesoporous silica-grafted graphene oxide for highly selective lead adsorption,” Chem. Eng. J., vol. 273, pp. 630–637, 2015.
[28] Y. Liu, L. Xu, J. Liu, X. Liu, C. Chen, G. Li, and Y. Meng, “Graphene oxides cross-linked with hyperbranched polyethylenimines:
Preparation, characterization and their potential as recyclable and highly efficient adsorption materials for lead(II) ions,” Chem. Eng. J., vol. 285, pp. 698–708, Feb. 2016.
[29] M. A. P. Cechinel, S. M. A. G. Ulson De Souza, and A. A. Ulson de Souza, “Study of lead (II) adsorption onto activated carbon originating from cow bone,” J. Clean. Prod., vol. 65, pp. 342–349, Feb. 2014.
[30] M. Fuerstenau, G. Jameson, and R. Yoon, “Froth Flotation: A Century of Innovation; Society for Mining, Metallurgy, and Exploration: Littleton, CO, 2007.
[31] A. a. Yakout and H. M. Albishri, “Solvo-thermal synthesis, characterization of aluminon-functionalized magnetic nanoparticles and investigation of its adsorption performance for Cr(VI) and Cr(III),” J. Taiwan Inst. Chem. Eng., vol. 000, pp. 1–9, 2015.
[32] X. Lu, J. Jiang, K. Sun, J. Wang, and Y. Zhang, “Influence of the pore structure and surface chemical properties of activated carbon on the adsorption of mercury from aqueous solutions,” Mar. Pollut. Bull., vol. 78, no. 1–2, pp. 69–76, 2014.
[33] J. Shah, M. R. Jan, A. U. Haq, and M. Zeeshan, “Equilibrium, kinetic and thermodynamic studies for sorption of Ni (II) from aqueous solution using formaldehyde treated waste tea leaves,” J. Saudi Chem. Soc., vol. 19, no. 3, pp. 301–310, 2015.
[34] S. Saadat, A. Karimi-Jashni, and M. M. Doroodmand, “Synthesis and characterization of novel single-walled carbon nanotubes- doped walnut shell composite and its adsorption performance for lead in aqueous solutions,” J. Environ. Chem. Eng., vol. 2, no. 4, pp. 2059–2067, 2014.
[35] A. Bhat, G. B. Megeri, C. Thomas, H. Bhargava, C. Jeevitha, S. Chandrashekar, and G. M. Madhu, “Adsorption and optimization studies of lead from aqueous solution using g -Alumina,” Biochem. Pharmacol., vol. 3, no. 1, pp. 30–39, 2015.
[36] O. Moradi, V. K. Gupta, S. Agarwal, I. Tyagi, M. Asif, A. S. H. Makhlouf, H. Sadegh, and R. Shahryari-ghoshekandi, “Characteristics and electrical conductivity of graphene and graphene oxide for adsorption of cationic dyes from liquids: Kinetic and thermodynamic study,” J. Ind. Eng. Chem., vol. 28, pp. 294–301, 2015.
[37] F. Nekouei, H. Noorizadeh, S. Nekouei, M. Asif, I. Tyagi, S. Agarwal, and V. K. Gupta, “Removal of malachite green from aqueous solutions by cuprous iodide–cupric oxide nano-composite loaded on activated carbon as a new sorbent for solid phase extraction: Isotherm, kinetics and thermodynamic studies,” J. Mol. Liq., Sep. 2015.
[38] C. O. Ijagbemi, M.-H. Baek, and D.-S. Kim, “Montmorillonite surface properties and sorption characteristics for heavy metal removal from aqueous solutions.,” J. Hazard. Mater., vol. 166, pp. 538–546, 2009.
![Fig. 1. Effect of Temperature-pressure conditions on the formation of aluminosilicates [18]](https://thumb-us.123doks.com/thumbv2/123dok_us/8956789.1866157/1.595.313.540.459.590/fig-effect-temperature-pressure-conditions-formation-aluminosilicates.webp)