DEMOGRAPHIC RESEARCH
VOLUME 30, ARTICLE 14, PAGES 413-428
PUBLISHED 7 FEBRUARY 2014
http://www.demographic-research.org/Volumes/Vol30/14/ DOI: 10.4054/DemRes.2014.30.14
Descriptive Finding
Male and female sterility in Zambia
Athena Pantazis
Samuel J. Clark
© 2014 Athena Pantazis & Samuel J. Clark.
This open-access work is published under the terms of the Creative Commons Attribution NonCommercial License 2.0 Germany, which permits use, reproduction & distribution in any medium for non-commercial purposes, provided the original author(s) and source are given credit.
1 Introduction 414
2 Background 414
2.1 Sterility in Africa 414
2.2 Zambia and the Gwembe Tonga 415
3 Data 417
4 Methods 418
5 Result 422
6 Discussion 425
7 Acknowledgments 426
Male and female sterility in Zambia
Athena Pantazis1
Samuel J. Clark2
Abstract
BACKGROUND
Population measures of sterility are traditionally constructed for women, despite fertility and sterility being conditions of the couple. Estimates of male sterility provide insight into population-level sterility, and complement estimates based solely on women.
OBJECTIVE
This study seeks to estimate male sterility for the Gwembe Tonga of Zambia using male birth histories collected by the Gwembe Tonga Research Project from 1957 to 1995, while providing context by estimating female sterility for the Gwembe Tonga, as well as female sterility in all of Zambia, from Zambian DHS data (1992, 1997, 2001-02, and 2007).
METHODS
Sterility is measured using the Larson-Menken subsequently infertile indicator. Estimates are produced using discrete time event history analysis.
RESULTS
The odds of sterility were higher for women than men, though women’s odds of sterility were only 1.5 times that of men’s in the middle reproductive years. The odds of sterility increased steadily with age for both men and women, and across all datasets. However, women’s sterility increased much more sharply with age than men’s did, and women’s odds of sterility were higher than men’s at all reproductive ages.
1
Department of Sociology, University of Washington, Seattle, WA USA
2 Department of Sociology, University of Washington, Seattle, WA USA. Institute of Behavioral Science
1. Introduction
Population measures of fertility and sterility are usually constructed from birth histories from women, and thus limited to the population of women, rather than the general population. However, fertility or its absence are conditions experienced by a couple, and the causes of sterility can be related to the male partner, the female partner, or both partners. Medical studies (Folkvord, Odegaard, and Sundby 2005) and anthropological studies (Gerrits 1997, Dryer et al 2004) provide direct evidence of male sterility in multiple locations in Africa. Determining whether sterility is due to male or female disorders is often difficult, and generally less is known about the prevalence of male sterility (McFalls and McFalls 1984). McFalls and McFalls (1984) estimate between 20 and 60% of couple infertility across populations is accounted for in whole or in part by male sterility. As sterility, primary or secondary, is potentially related to either the male or female member of the couple, estimating male sterility can provide a more complete picture of population-level sterility than female estimates alone.
This analysis aims to describe the sterility of Gwembe Tonga men by applying Larsen and Menken’s (1989, 1991) subsequently infertile measure, using incomplete birth histories. Data for the Gwembe Tonga provide a unique opportunity to estimate male sterility, because male birth histories were recorded. Juxtaposed with measurement of sterility for the women in the same population, this analysis seeks to describe sterility among the entire Gwembe Tonga population. Measures of female sterility from Zambia Demographic and Health Surveys (ZDHS) data from 1992, 1996, 2001-02, and 2007 are also presented to provide national context for the Gwembe Tonga analysis.
2. Background
2.1 Sterility in Africa
ethnic group in Africa. Bongaarts et al (1984) cite substantial variation in measured primary sterility across Africa, varying from 3% to 20% or higher, and noted substantial variation within countries. Similarly, Jensen (1995) found substantial differences in secondary sterility rates in two Kenyan communities.
2.2 Zambia and the Gwembe Tonga
Zambia is a landlocked country in southern Africa with an estimated mid-year 2013 population of over 14 million. Life expectancy remains among the lowest in the world (52 years) with maternal mortality and infant mortality rates among the highest (World Factbook 2013). Fertility rates in Zambia are high; total fertility was estimated at 6.2 in 2007. Contraceptive use has increased from 15% of women in 1992 to 41% in 2007, 33% using a modern method in 2007 (CSO et al 2009). Relatively little information about sterility in Zambia has been published. Using parity progression ratios to analyze Zambian censuses, Sunil and Pillai (2002) found that the proportion of women who were sterile increased from 0.12 in 1980 to 0.15 in 1990, with evidence of regional variation. The authors estimated that sterility rates in Southern Province, where the Gwembe Tonga live, increased from 0.11 to 0.14 between 1980 and 1990 (Sunil and Pillai 2002).
Table 1: Population size, marital and birth history descriptive statistics for women and men in the Gwembe Tonga and Zambia DHS
(1992, 1996, 200102, and 2007) datasets
Women Men
Gwembe Tonga 1992 ZDHS* 1996 ZDHS 2001-02 ZDHS 2007 ZDHS Gwembe Tonga 1996 ZDHS 2001-02 ZDHS 2007 ZDHS
Individuals aged 20 and over 2206 4800 5637 5487 5269 1900 1307 1591 4829
Ever married 1768 4516 5219 5063 4747 1258 1041 1341 3910
Married individuals used in
analysis** 1405 3615 4071 3416 2264 1021 Not included in analysis
Mean age first marriage (SE) 19.9
(0.16) 17.2 (0.05) 17.5 (0.05) 17.7 (0.05) 18.1 (0.05) 25.6 (0.24) 22.8 (0.13) 22.6 (0.11) 22.9 (0.07)
Women married more than once (%) 143 (8%) 1186 (26%) 1346 (26%) 1240 (25%) 1009 (21%) 1,083 (84%) 349 (34%) 524 (39%) 994 (27%)
Men with more than 1 wife (%)
Not applicable
337
(27%) 93 (10%)
122 (10%)
284 (8%) Percent of polygynists with
exactly 2 wives 68% 94% 84% 91%
Mean age in years at first birth (SE) 20.4 (0.07) 18.1 (0.05) 18.3 (0.04) 18.3 (0.04) 18.5 (0.04) 25.0 (0.18) Not available
Mean birth interval (SE) 2.7
(0.02) 2.8 (0.97) 2.8 (1.04) 2.9 (1.01) 3.0 (1.02) 2.4 (0.02)
Proportion with last closed birth
interval ≥ 5 years 5.6% 21.2% 23.5% 21.0% 21.5% 4.2%
Mean number of live births (SE) 4.1
(0.08) 4.6 (0.04) 4.5 (0.04) 4.4 (0.04) 4.3 (0.04) 4.5 (0.16) 4.8 (0.12) 5.0 (0.11) 4.7 (0.05) Mean number of living children
(SE) 3.1 (0.06) 3.8 (0.4) 3.6 (0.03) 3.7 (0.03) 3.6 (0.03) 3.3 (0.11) 3.9 (0.10) 4.1 (0.09) 4.0 (0.05)
Proportion childless§ 8.10% 2.41% 2.73% 2.74% 2.53% 17.10% Not available
* The 1992 ZDHS did not contain a male sample.
** For the Gwembe Tonga, these are people continuously married for 5 years preceding each observation included in analysis; for the ZDHS, these are women who married at least 5 years prior to the observation and were still married at the time of the survey.
3. Data
Data for the Gwembe Tonga come from the Gwembe Tonga Research Project, begun by Elizabeth Colson and Thayer Scudder in 1956, with yearly data on unions and births through 1995. Four villages are included in the dataset, and the sample includes all the inhabitants of these villages, as well as individuals born to or marrying members of the sample, or migrating into the villages. Individuals left the sample through death or by moving away (Clark 2001). These data are ideal for estimating sterility for men because birth histories are separately available for both men and women. To compare sterility estimates for the Gwembe Tonga with Zambia, Demographic and Health Survey data from 1992 (ZDHS 1992), 1996 (ZDHS 1996), 2001-02 (ZDHS 2001-02) and 2007 (ZDHS 2007) are used. Analysis was restricted to currently married individuals at least 20 years of age in the ZDHS, because divorce dates were not available, and periods of marriage and separation could not be identified in those data. All individuals who had ever been married, men and women, over 20 years old were included from the Gwembe Tonga data, with analysis limited to observations for which the individual had been married for five consecutive years prior to the observation. Years when an individual was separated after the first union or the first years of any union were excluded from analysis to ensure exposure to pregnancy, following Larsen and Menken (1989, 1991). Analysis was limited to individuals aged 20 years or over, following the recommendation of Larsen and Menken (1991), based on their sensitivity analysis, which found a substantial difference in true and assigned age at sterility for ages below 20 years.
2001-02 and 2007 ZDHS data. Later ZDHS datasets did not have observations for the earliest time periods. Over 50% of observations in the 2007 ZDHS were in the last time period, and for the 2007 ZDHS, time periods were collapsed to 1973-1999 and 2000-07 to accommodate sparseness in certain age and time period categories.
4. Methods
This analysis uses Larsen and Menken’s (1989, 1991) method for measuring population sterility, defined as the inability to have a live birth, to estimate sterility of Gwembe Tonga men and women. The measure is implemented in the same manner for both men and women. This analysis is the first of which the authors are aware that estimates male sterility at the population level using a measure that has been exclusively used for women, but can be applied here because of the availability of male birth history data. Larsen and Menken’s subsequently infertile indicator measures the proportion of individuals who are subsequently infertile after a certain age, using incomplete birth histories. For this measure, infertility is defined as an individual being observed for a specified time T without giving birth, despite being sexually active and not using contraception. This method estimates the proportion of individuals who become sterile between age a and age a + T, at some age a*. An indicator for sterility was assigned for each person-year. For person-years that meet the criteria for inclusion in the dataset (age 20 years or older, married at least five years earlier, followed for the following five years), an individual was sterile if, in the last, open birth interval, the individual did not give birth during any of the following five years.
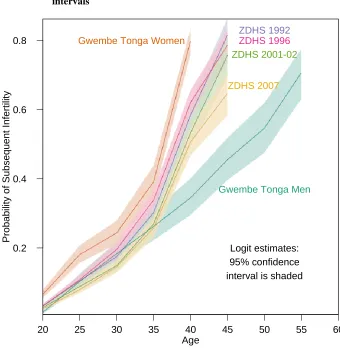
estimates of sterility from the ZDHS datasets are well below those of the Gwembe Tonga (Figure 1).
Figure 1: Predicted probability of being infertile by age with 95% confidence intervals
There are some limitations to this measure. Some sexually inactive individuals may be included, even when only including those who are married continuously. Excluding never-married and divorced individuals from the measure is likely to
20 25 30 35 40 45 50 55 60
0.2 0.4 0.6 0.8
Age
P
ro
b
a
b
ili
ty
o
f
S
u
b
s
e
q
u
e
n
t
In
fe
rt
ili
ty
Gwembe Tonga Men Gwembe Tonga Women
ZDHS 1992 ZDHS 1996 ZDHS 2001-02
ZDHS 2007
underestimate infertility; evidence suggests that subfecund women are more likely to be divorced than fecund women (Larsen and Menken 1994). Contraception further complicates the measure, as women who are practicing contraception could be counted as sterile, despite being fecund. Larsen (1994) outlined contraceptive use conditions in which the subsequently infertile measure could be estimated with negligible bias, but adequate detail about contraceptive use for determining whether these conditions are met is not available in the ZDHS (and often not available generally). In this analysis, two ways of dealing with contraceptive use were used for the ZDHS data, and are discussed briefly in the results.
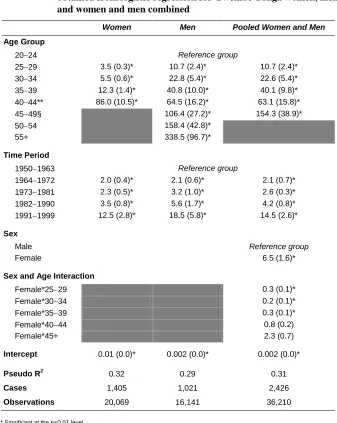
Table 2: Odds ratios (with standard errors) for being subsequently infertile obtained from logistic regression for Gwembe Tonga women, men and women and men combined
Women Men Pooled Women and Men
Age Group
2024 Reference group
2529 3.5 (0.3)* 10.7 (2.4)* 10.7 (2.4)* 3034 5.5 (0.6)* 22.8 (5.4)* 22.6 (5.4)* 3539 12.3 (1.4)* 40.8 (10.0)* 40.1 (9.8)* 4044** 86.0 (10.5)* 64.5 (16.2)* 63.1 (15.8)* 4549§ 106.4 (27.2)* 154.3 (38.9)* 5054 158.4 (42.8)*
55+ 338.5 (96.7)*
Time Period
19501963 Reference group
19641972 2.0 (0.4)* 2.1 (0.6)* 2.1 (0.7)* 19731981 2.3 (0.5)* 3.2 (1.0)* 2.6 (0.3)* 19821990 3.5 (0.8)* 5.6 (1.7)* 4.2 (0.8)* 19911999 12.5 (2.8)* 18.5 (5.8)* 14.5 (2.6)*
Sex
Male Reference group
Female 6.5 (1.6)*
Sex and Age Interaction
Female*2529 0.3 (0.1)*
Female*3034 0.2 (0.1)*
Female*3539 0.3 (0.1)*
Female*4044 0.8 (0.2)
Female*45+ 2.3 (0.7)
Intercept 0.01 (0.0)* 0.002 (0.0)* 0.002 (0.0)*
Pseudo R2 0.32 0.29 0.31
Cases 1,405 1,021 2,426
Observations 20,069 16,141 36,210
* Significant at the p<0.01 level
5. Results
The primary objective of this analysis is to produce estimates of sterility for men: something that is not generally done, because birth-history data for men are very uncommon. Male sterility by age is presented in Figure 1, along with estimates of female sterility from the Gwembe Tonga and ZDHS datasets. These estimates are from the regressions in Table 2 and 4 for each dataset and include 95% confidence intervals. The predicted probabilities can be interpreted as the proportion of the population experiencing sterility in an age group. Fewer men are experiencing sterility at any age than women. For example approximately 40% of Gwembe Tonga women are sterile by age 35, while sterility among Gwembe Tonga men does not reach that level until age 45. These age-specific differences between men and women are made explicit in Table 3, which provides the odds of being sterile for a woman compared to a man from the pooled model. While much higher at the youngest and oldest ages, in the middle of reproductive years, aged 30 to 34, women are only 1.5 times more likely to be sterile than men, indicating that their increased risk of sterility is felt most in their early and late reproductive years.
Table 3: Odds ratios of being subsequently infertile for women compared to men by age, computed from the logistic regression with interaction term for the pooled Gwembe Tonga men and women data
Age Odds
2024 7.4
2529 2.2
3034 1.5
3539 2.0
4044 5.8
45 and older 15.6
earlier ZDHS data were sterile in the last age groups, whereas about 70% of men were sterile in the last age group, which was similar to women in the later ZDHS data (see Table 2 and Figure 1). This steady increase was true in the pooled model for men and women as well. From Figure 1 we can see that the steady increase of the probability of being sterile with age is evident in all groups, but that the increase is much steeper for women than it is for men. Even though women in the later ZDHS surveys have probabilities of sterility at both young and old ages that are similar to Gwembe Tonga men, the slope of their increase in sterility with age is similar to that of the Gwembe Tonga women and earlier ZDHS samples.
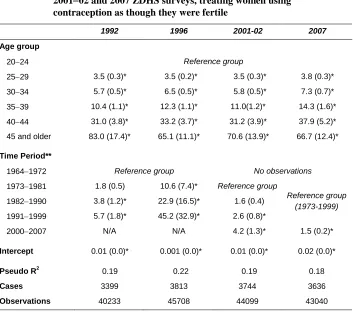
Contraceptive use among the Gwembe Tonga was negligible during the period under analysis (Sam Clark and Thayer Scudder, personal communication), so this was ignored in their estimates. Modern contraceptive use was increasing throughout Zambia in the period covered by the ZDHS surveys. For the four ZDHS datasets, the results shown in Table 4 consider all current users of contraception to be fertile. This represents a minimum level of sterility in the populations, as presumably a non-negligible proportion of women using contraception may be sterile but considered fecund. The models were also run (not shown) excluding all contraceptive-users from the risk set entirely, which resulted in higher levels of sterility. In 1992, when only 16% of married women were using any method of contraception at the time of the survey, the estimated probability of sterility is similar for the two approaches, but by 2007, when 33% of married women were using contraception, the proportion of women who were sterile differed significantly between the two approaches, indicating a sizeable effect of contraceptive use on the measure (which was documented in Larsen 2000). For comparison and discussion, only the estimates treating all contraceptive-users as fertile are used, representing the minimum estimate of sterility.
Table 4: Odds ratios (with standard errors) for being subsequently infertile obtained through logistic regression for women from the 1992, 1996, 200102 and 2007 ZDHS surveys, treating women using
contraception as though they were fertile
1992 1996 2001-02 2007
Age group
2024 Reference group
2529 3.5 (0.3)* 3.5 (0.2)* 3.5 (0.3)* 3.8 (0.3)*
3034 5.7 (0.5)* 6.5 (0.5)* 5.8 (0.5)* 7.3 (0.7)*
3539 10.4 (1.1)* 12.3 (1.1)* 11.0(1.2)* 14.3 (1.6)*
4044 31.0 (3.8)* 33.2 (3.7)* 31.2 (3.9)* 37.9 (5.2)*
45 and older 83.0 (17.4)* 65.1 (11.1)* 70.6 (13.9)* 66.7 (12.4)*
Time Period**
19641972 Reference group No observations
19731981 1.8 (0.5) 10.6 (7.4)* Reference group
Reference group (1973-1999)
19821990 3.8 (1.2)* 22.9 (16.5)* 1.6 (0.4)
19911999 5.7 (1.8)* 45.2 (32.9)* 2.6 (0.8)*
20002007 N/A N/A 4.2 (1.3)* 1.5 (0.2)*
Intercept 0.01 (0.0)* 0.001 (0.0)* 0.01 (0.0)* 0.02 (0.0)*
Pseudo R2 0.19 0.22 0.19 0.18
Cases 3399 3813 3744 3636
Observations 40233 45708 44099 43040
* Significant at the p<0.01 level
6. Discussion
The Gwembe Tonga Research Project dataset provides a unique opportunity to estimate male sterility, and to compare the sterility of men with that of women. Our findings demonstrate that the prevalence of male sterility increases steadily with age, though not as sharply as for women. While sterility is generally less common among men, the difference is not constant over the life course. In fact, women’s odds of being sterile are only moderately higher than men’s in the middle of the reproductive years.
Demographic and Health Surveys (Pullum, 2006). Even with these two potential sources of upward bias in the estimates for the ZDHS samples, sterility estimates for the ZDHS women were lower than those for the Gwembe Tonga women.
This study shows that men’s sterility increases with age in a manner similar to the age-related increase for women. However, men’s probability of sterility increases much more slowly than women’s, which is expected due to men’s longer reproductive period. In the final age group, men and women alike reached very high probabilities of sterility.
7. Acknowledgments
References
Allison, P. (1984). Event History Analysis: Regression for longitudinal event data. Newbury Park, CA: Sage Publications.
Bongaarts, J., Frank, O., and Lesthaeghe, R. (1984). The Proximate Determinants of Fertility in Sub-Saharan Africa. Population Development and Review 10(3): 511537. doi:10.2307/1973518.
Central Statistical Office (CSO), Ministry of Health (MOH), Tropical Diseases Research Centre (TDRC), University of Zambia, and Macro International Inc (2009). Zambia Demographic and Health Survey 2007. Calverton, Maryland, USA: CSO and Macro International Inc.
Clark, S.J. (2001).An Investigation into the Impact of HIV on Population Dynamics in Africa. [Ph.D. dissertation]. Philadelphia: University of Pennsylvania, Department of Demography.
Clark, S.J., Colson, E., Lee, J., and Scudder, T. (1995). Ten Thousand Tonga: A Longitudinal Anthropological Study from Southern Zambia, 19561991. Population Studies 49(1): 91-109. doi:10.1080/0032472031000148266.
Colson, E. (1971). The social consequences of resettlement: The impact of the Kariba resettlement upon the Gwembe Tonga. Manchester: University of Manchester for University of Zambia.
Dryer, S.J., Abrahams, N., Mokoena, N.E., and van der Spuy, Z.M. (2004). You are a man because you have children: experiences, reproductive health knowledge and treatment-seeking-behavior among men suffering from couple infertility in South Africa. Human Reproduction 19(4): 960967. doi:10.1093/humrep/ deh195.
Ericksen, K. and Brunette, T. (1996). Patterns and predictions of infertility among African women: A cross-national survey of twenty-seven nations. Social Science and Medicine 42(2): 209220. doi:10.1016/0277-9536(95)00087-9.
Folkvord, S., Odegaard, O.A., and Sundby, J. (2005). Male infertility in Zimbabwe. Patient Education and Counseling 59(3): 239243. doi:10.1016/j.pec.2005.08. 003.
Gerrits, T. (1997). Social and cultural aspects of infertility in Mozambique. Patient Education and Counseling 31(1): 3948. doi:10.1016/S0738-3991(97)01018-5. Jensen, A. (1995). The status of women and the social context of reproduction. Journal
of International Development 7(1): 6179. doi:10.1002/jid.3380070105.
Larsen, U. (2000). Primary and secondary infertility in sub-Sarharan Africa. International Journal of Epidemiology 29(2):285291. doi:10.1093/ije/29.2.285. Larsen, U. and Menken, J. (1989). Measuring Sterility from Incomplete Birth Histories.
Demography 26(2): 185201. doi:10.2307/2061519.
Larsen, U and Menken, J (1991). Individual-Level Sterility: A New Method of Estimation with Application to Sub-Saharan Africa. Demography 28(2): 229247. doi:10.2307/2061277.
McFalls, J.A. and McFalls, M.A. (1984). Disease and Fertility. Orlando, FL: Academic Press.
Pullum, T.W. (2006). An Assessment of Age and Date Reporting in the DHS Surveys, 19852003. Methodological Reports No. 5. Calverton, Maryland: Macro International.
Sunil, T.S. and Pillai, V.K. (2002). Sterility in Zambia. Annals of Human Biology 29(4): 414421. doi:10.1080/03014460110100919.
The World Factbook 20132014 (2014). Washington, DC: Central Intelligence Agency
Zambia Demographic and Health Survey, 1992 (1993). Columbia, MD: University of Zambia, Zambia Central Statistics Office and Macro International, Inc.
Zambia Demographic and Health Survey, 1996 (1997). Calverton, MD: Zambia Central Statistics Office and Macro International, Inc.
Zambia Demographic and Health Survey, 2001-2002 (2003). Calverton, MD: Zambia Central Statistics Office, Zambia Central Board of Health and ORC Macro. Zambia Demographic and Health Survey, 2007 (2009). Calverton, MD: Zambia Central