PERFORMANCE EVALUATION OF RELAYED
ENHANCED LTE-ADVANCED NETWORK USING
DECODE AND FORWARD PROTOCOL
*Mohammed Bashir A. Alwahid,
**Dr. Fath Elrahman Ismael Khalifa
*Nano for Measurement & Calibration Center, Khartoum, Sudan
** Sudan University of science & technology College of Engineering, School of electronic
ABSTRACT
The increasing demand on mobile service providers to support high rate applications has prompted the development of 4G networks. LTE Advanced is one of the promising technologies to meet the rising demand. This paper studies performance of LTE Advanced Network through relay deployment to enhance cell edge coverage and using of decode and forward (DF) protocol by evaluating of many scenarios using Matlab program, and WINNER-II which is used to investigate different channel model or propagation environments. Results have shown that cooperative relay number has significant effect in enhancing network performance. And by using couple of modulation types QPSK, 16QAM and 64QAM for relay link and access link, 64QAM has higher BER even by increasing SNR.
Keywords:LTE-A; Relay; Decode and forward; M-QAM;Soft-Bit Maximum Ratio Combiner;
INTRODUCTION
A. Preface
The International Telecommunications Union Radio communications (ITU-R) defines the requirements for the International Mobile Telephony - Advanced (IMT-A), in order to enable the standardization process for 4th generation wireless cellular technologies. Two working group have been developed; Third Generation Partnership Project (3GPP) who initiated Long Term Evolution-Advanced (LTE-A) standards and IEEE.802.16 Working Group with its WiMAX 802.16m standards. These technologies promise to achieve high spectral efficiency with improved peak data rates and enable enhanced network coverage with good throughput both in downlink and uplink. In 3GPP community, the LTE-A Release-10 compliant networks are termed as to fulfill the IMT-A requirements [1][2]. The standards of LTE-A propose several enhancement techniques to provide a quality-of-service (QoS) to the mobile users with low deployment constraints including Carrier Aggregation (CA), Extended-Multiple-Input Multiple- Output (E-MIMO), Coordinated Multi-point Transmission (CoMP), Relaying, and so on.
systems employ higher bandwidth with the same amount of transmit power and use higher carrier frequencies with infrastructure designed for lower carrier frequencies. One solution to improve coverage as component included in LTE-A is to use the fixed relays to transmit data between the eNodeB and the Mobile Stations or User Equipment through multi hop communication [3].
The LTE-A is backward compatible with existing LTE system and support the existing LTE enabled UEs. It provides higher bitrates in a cost efficient way and, at the same time, completely fulfill the requirements set by ITU for IMT Advanced (4G) [4] as increased peak data rate, Down Link 3 Gbps, Up Link 1.5 Gbps, and higher spectral efficiency, from a maximum of 16bps/Hz in Release8 to 30bps/Hz in Release10.
B. Long Term Evolution
LTE system needs to provide long term efficient solutions comparatively to its predecessor’s technologies, in order to enable improved network coverage and capacity. The evolution towards LTE in principle began with Release 98 specifying GSM and then continued with Release 99. Release 99 specifies UMTS with CDMA air interface. The technology moved to all-IP network development in Release 4. UMTS networks development moved to HSPA introduced in 2002 by Release 5 (HSDPA) and Release 6 (HSUPA). The improvements in mobile technologies went on by HSPA+ which is described in Release 7 and together with Release 8, LTE was introduced in 2008 as all-IP network [5]. LTE is designed to utilize Orthogonal Frequency Division Multiple Access (OFDMA) in the downlink; whereas, single carrier-Frequency Division Multiple Access (SC-FDMA) is chosen in the uplink due to its low Peak-to-Average Power Ratio (PAPR). OFDM meets the demands for spectrum flexibility and provides cost-efficient solutions for carriers with high peak data rates due to the orthogonally between the subcarriers. The transmitter introduces Cyclic Prefix (CP) to avoid inter-symbol interference (ISI) caused by multipath [5].
C. Related Works
amplify-and-forward (AF), decode-and-amplify-and-forward (DF) and detect-and-amplify-and-forward (DeF) concluded using optimal Maximum likelihood detection for all the protocols, DF performs better than both AF and DeF and when the simplest combing method MRC is applied, AF has the best performance.
The larger constellations are used between eNB and RN link to achieve high data rates at relay. However, because of the mobility of the users, the link(s) from RNs to UE is smaller constellations to ensure reliable transmission. Study [8] proposed the “soft-bit maximum ratio combiner” (SBMRC) as a low complexity diversity combining scheme for signals with different modulation levels. SBMRC exhibits BER performance that is very close to the optimal maximum likelihood detector (MLD), but with much reduced complexity. If full channel state information (CSI) is available at BS, deciding whether to communicate through relays or directly, and optimizing the modulation levels for all the transmitting nodes, can improve the end-to-end throughput drastically; such optimization is studied extensively (for instance, [9], [10]). The cases when only the relays are used are studied in [8]. However, in this paper both relay and direct links are used for transmission.
SYSTEM DESIGN
In this section, we describe network layout, coding algorithm, modulation techniques, and combination method of modulation levels.
A. Network layout:
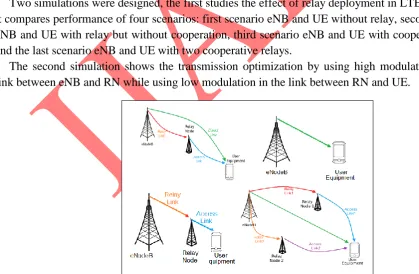
Two simulations were designed, the first studies the effect of relay deployment in LTE Advanced, it compares performance of four scenarios: first scenario eNB and UE without relay, second scenario eNB and UE with relay but without cooperation, third scenario eNB and UE with cooperative relay and the last scenario eNB and UE with two cooperative relays.
The second simulation shows the transmission optimization by using high modulation level in link between eNB and RN while using low modulation in the link between RN and UE.
Figure 1: Scenarios of the first simulation LTE Advanced network
Four scenarios of two cooperative relays with different modulation levels were taken: 64QAM-16QAM, 64QAM-QPSK, 16QAM-QPSK and QPSK-QPSK.
B. Coding and decoding Algorithms
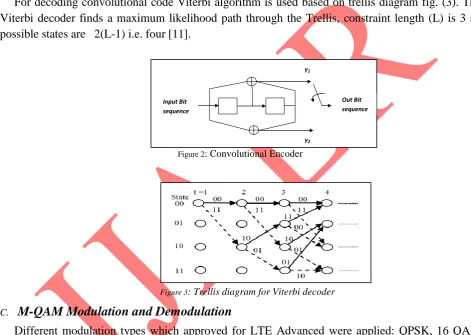
In communication system, error detection and correction has importance to issue reliability and efficiency of data transmission. The convolutional encoder with Viterbi decoder is more powerful structure for forward error correction technique [7]. Convolutional code of 1/2 rate is applied in this paper as in (1); the encoder block diagram is shown in fig. (2).
Code rate = k/n = (1)
For decoding convolutional code Viterbi algorithm is used based on trellis diagram fig. (3). The Viterbi decoder finds a maximum likelihood path through the Trellis, constraint length (L) is 3 so possible states are 2(L-1) i.e. four [11].
Figure 2: Convolutional Encoder
Figure 3: Trellis diagram for Viterbi decoder
C. M-QAM Modulation and Demodulation
Different modulation types which approved for LTE Advanced were applied: QPSK, 16 QAM and 64 QAM. The following mathematical model maps K bits into a Gray coded M-QAM symbol [8][12], for different modulation levels, 4-QAM, 16-QAM, and 64-QAM Gray coded symbols shown in (2), (3) and (4):
(2)
(3)
(4)
Where
s ϵ{1,-1}, 𝑑𝑀 is a constant used to fix the energy per bit to unity and it is given by (5):
(5)
Input Bit sequence
Out Bit sequence Y1
For example, d4 = 1, d16 = 0.6325, and d64 = 0.378
For the Gray coded 𝑀-QAM schemes to extract soft-bits from soft-symbols the Log-Likelihood
Ratio (LLR) can be well approximated by (6) the recursive expression [8] [12] [13] [14]:
(6)
Where,
the extracted soft bit.
is the channel coefficient.
received vector.
D. Diversity Combining Scheme:
Soft-bit maximum ratio combiner (SBMRC) is used to combine signals of different modulation levels, which exhibits BER performance that is very close to the optimal maximum likelihood
detector (MLD), but with less complexity [8] [12], the SBMRC decides on the bit 𝑙, for 𝑙∈ {0, 1,
...,𝐶 − 1}, according to (7) criterion:
(7)
Where 𝑙 is a sum of the soft-bits received from different links and is given by (8):
(8)
RESULTS AND DISCUSSION
Two simulations were designed using Matlab program and Wireless World Initiative New Radio (WINNER) Matlab coded source to introduce different propagation environments.
A. Effect of relays number
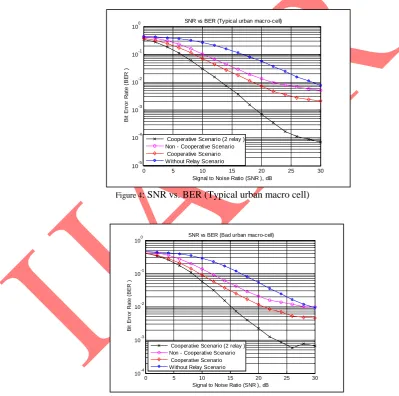
The first simulation contains the four scenarios depicted in fig. 1, it studies the effect of cooperative relay number in the network performance using decode and forward protocol.
average reduction in BER of two cooperative relays scenario over the three previous scenarios is 82%, 74% and 66% respectively.
Fig. 5 shows that in bad urban macro cell environment scenario of without-relay has higher BER through varying values of SNR, then Non-cooperative scenario, then cooperative-with one relay scenario and lastly cooperative-with two relay. The average reduction in BER of two cooperative relays scenario over three scenarios as follow: over without-relay scenario is more than 74%, over with relay but without cooperation is 64% and over with cooperative relay is 51%. It’s clear that by comparing the Typical Urban macro cell with the Bad, the BER in the former achieved with less SNR than that of the later in the four scenarios.
Figure 4: SNR vs. BER (Typical urban macro cell)
Figure 5: SNR vs. BER (Bad urban macro cell)
The average reduction related to fig. 6 of suburban macro cell in BER of two cooperative relays scenario over without-relay, with-relay but without cooperation and with cooperative relay are 75%, 63% and 49% respectively. By comparing fig. 6 of suburban macro cell to fig. 4 and 5, it’s clear that all the relay scenarios perform much better than the without relay scenario and increasing the number of cooperative relays enhance SNR vs. BER.
0 5 10 15 20 25 30
10-5 10-4 10-3 10-2 10-1 100
Signal to Noise Ratio (SNR ), dB
B it E rr o r R a te ( B E R )
SNR vs BER (Typical urban macro-cell)
Cooperative Scenario (2 relay ) Non - Cooperative Scenario Cooperative Scenario Without Relay Scenario
0 5 10 15 20 25 30
10-4 10-3 10-2 10-1 100
Signal to Noise Ratio (SNR ), dB
B it E rr o r R a te ( B E R )
SNR vs BER (Bad urban macro-cell)
B. Optimizing transmission by different modulation levels
This simulation consists of four scenarios have eNB and UE and two cooperative relays use DF protocol with different modulation. The direct link in all scenarios uses QPSK modulation while relay and access links are set as follow:
a) The First scenario uses QPSK modulation in relay and access links.
b) The Second scenario is 64QAM in relay links and QPSK in access links.
c) The Third scenario is 16QAM in relay links and QPSK in access links.
d) The Fourth scenario is 64QAM in relay links and 16QAM in access links.
Figure 6: SNR vs. BER (Suburban macro cell)
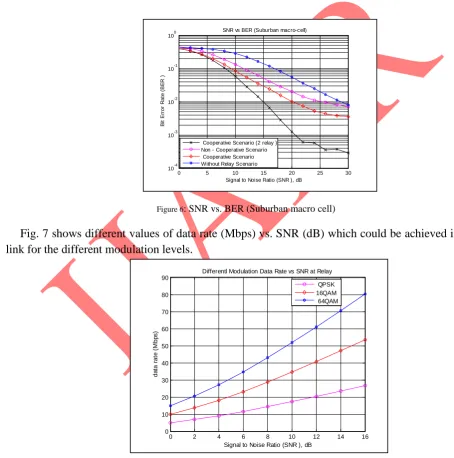
Fig. 7 shows different values of data rate (Mbps) vs. SNR (dB) which could be achieved in relay link for the different modulation levels.
Figure 7: Different Modulation’s Data rate vs. SNR
Typical urban micro cell appeared in fig. 8 illustrates variations in curves of SNR vs. BER for the couple of modulation levels. 64QAM-16QAM scenario has the much BER, and also BER remains
0 5 10 15 20 25 30
10-4 10-3 10-2 10-1 100
Signal to Noise Ratio (SNR ), dB
B it E rr o r R a te ( B E R )
SNR vs BER (Suburban macro-cell)
Cooperative Scenario (2 relay ) Non - Cooperative Scenario Cooperative Scenario Without Relay Scenario
0 2 4 6 8 10 12 14 16 0 10 20 30 40 50 60 70 80 90
Signal to Noise Ratio (SNR ), dB
d a ta r a te ( M b p s)
constant above SNR 12dB, then, 64QAM-QPSK scenario come with BER near 5*10-3 and BER remains constant above 15dB SNR, then, QPSK-QPSK scenario and at finally 16QAM-QPSK scenario. The average reduction in BER of 16QAM-QPSK over QPSK-QPSK is 57% up to SNR 16 dB, and above 16dB the average reduction in BER of QPSK-QPSK over 16QAM-QPSK is 54%.
It’s noticeable that up to SNR (16dB) in fig. 8, the data rate 40Mbps in relay link of 16QAM-QPSK scenario achieved with lesser BER than the couple 16QAM-QPSK-16QAM-QPSK of data rate 20Mbps.
Figure 8: SNR vs. BER of cooperative 2 relay (Typical Urban Micro cell)
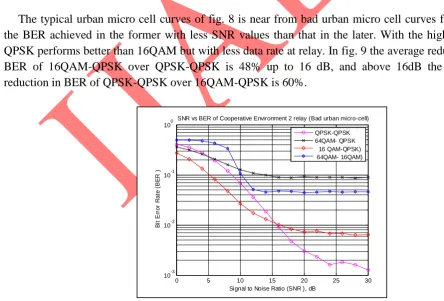
The typical urban micro cell curves of fig. 8 is near from bad urban micro cell curves fig. 9 but the BER achieved in the former with less SNR values than that in the later. With the higher SNR QPSK performs better than 16QAM but with less data rate at relay. In fig. 9 the average reduction in BER of 16QAM-QPSK over QPSK-QPSK is 48% up to 16 dB, and above 16dB the average reduction in BER of QPSK-QPSK over 16QAM-QPSK is 60%.
Figure 9: SNR vs. BER of cooperative 2 relay (Bad Urban Micro cell)
0 5 10 15 20 25 30
10-5 10-4 10-3 10-2 10-1 100
Signal to Noise Ratio (SNR ), dB
B
it
E
rr
o
r
R
a
te
(
B
E
R
)
SNR vs BER of Cooperative Environment 2 relay (Typical urban micro-cell) QPSK-QPSK 64QAM- QPSK 16 QAM-QPSK) 64QAM- 16QAM)
0 5 10 15 20 25 30 10-3
10-2 10-1 100
Signal to Noise Ratio (SNR ), dB
B
it
E
rr
o
r
R
a
te
(
B
E
R
)
The indoor to outdoor environment shown in fig. 10 is agreed somewhat with the previous fig.8 and 9, where in the two 64QAM scenarios increasing of SNR above 15 dB has trivial effect on BER, while in 16QAM-QPSK and QPSK-QPSK scenarios SNR vs. BER has semi linear relation, i.e. increase of SNR causes decrease of BER. The average reduction in BER of 16QAM-QPSK over QPSK-QPSK is 58% up to 16 dB, and above 16dB the average reduction in BER of QPSK-QPSK over 16QAM-QPSK is 63%.
Figure 10: SNR vs. BER of cooperative 2 relay (Indoor to Outdoor)
The results have explained by using 64QAM modulation in environments increase data rate at relay, but the BER is high and constant even with increasing of SNR. When 16QAM or QPSK are used in relay link the BER decrease and decrease more with increasing of SNR.
CONCLUSION
We have studied performance of LTE Advanced through deployment of relays using decode and forward protocol in down link. Matlab program is used to design LTE-A network with WINNER-II Matlab coded source to introduce different channel models. Two main simulations were designed. The output result of the cooperate and non-cooperate transmission simulation illustrated that relay scenarios perform much better than without-relay scenario and increasing the number of cooperative relays enhance SNR vs. BER in all simulated propagation environments. The average reduction in BER of two relays scenario over less relay scenarios was about 66%. The results of different couples of modulation levels simulation which consists of two cooperative relays have shown by using 64QAM modulation in spite of increasing data rate at relay, but the BER is high and constant even when increasing SNR. When 16QAM or QPSK are used in relay link the BER enhance and decrease more with increase of SNR. By increasing of SNR QPSK performs better than 16QAM but with less data rate at relay and the average reduction of BER of QPSK over 16QAM was 59%.
0 5 10 15 20 25 30
10-4 10-3 10-2 10-1 100
Signal to Noise Ratio (SNR ), dB
B
it
E
rr
o
r
R
a
te
(
B
E
R
)
REFERENCES
[1] Z. Mayer, “Optimizing Coordinated Multi-Point Transmission under Unreliable Backhaul”,
MSC thesis at Chalmers University of Technology, Gothenburg, Sweden 2013.
[2] A. Ghafar, N. Satiman, N. Fisal, S. Maharum, A. Saparudin, Rozeha, “Relay Architectures for
LTE-Advanced Network”, Universiti Teknologi Malaysia,
http://trg.fke.utm.my/members/nurulashikin/paper5.pdf.
[3] A. Quaium, “Evaluation of Relay-Enhanced LTE-Advanced Networks”, MSC thesis at Delft
University of Technology, April 2011, available at link:
http://repository.tudelft.nl/view/ir/uuid%3A37ef8678-061f-43f4-af2b-b96f9093f140/.
[4] J. Wannstrom, 3GPP “LTE-Advanced”, June 2013, available at:
http://www.3gpp.org/technologies/keywords-acronyms/97-lte-advanced.
[5] U. ÖZTÜRK “Coordinated Multipoint Transmission in Femtocell Systems”, M.Sc thesis,
School of Electrical Engineering, Aalto University 2011.
[6] M. Minelli, M. Coupechoux, J. Kelif, Maode P. Godlewski; “Relays-Enhanced LTE-Advanced
Networks Performance Studies”,
http://perso.telecom-paristech.fr/~coupecho/publis/sarnoff11relays.pdf.
[7] Y. Yang, B.Castel, P. MV, K. Kittichokechai, M. Yousofshahi and B. Asl, “Cooperative
relaying”, Royal Institute of Technology (KTH) in Stockholm, Sweden, spring of 2008.
[8] A. Bin Sediq and H. Yanikomeroglu, “Performance Analysis of Soft-Bit Maximal Ratio
Combining in Cooperative Relay Networks" in IEEE Transactions on Wireless Communications, Vol. 8, No. 10, October 2009.
[9] S. Hares, H. Yanikomeroglu, and B. Hashem, “Diversity- and AMC (adaptive modulation and
coding)-aware routing in TDMA multihop networks," in Proc. IEEE GLOBECOM, San Francisco, CA, USA, Dec. 2003.
[10] B. Can, H. Yanikomeroglu, F. Onat, E. Carvalho, and H. Yomo, “Efficient cooperative diversity
schemes and radio resource allocation for IEEE 802.16j," in Proc. IEEE WCNC, Las Vegas, USA, Apr. 2008.
[11] R. Pednekar,“Design and Implementation of Convolution Encoder with Viterbi Decoder”,
International Journal of Emerging Technologies in Computational and Applied Sciences (IJETCAS), September-November, 2013, pp. 84-89.
[12] A. Bin Sediq and H. Yanikomeroglu, “Diversity combining of signals with different modulation
levels in cooperative relay networks," in Proc. IEEE VTC2008-Fall, Calgary, Alberta, Canada, Sept. 2008.
[13] S. L. Goff, A. Glavieux, and C. Berrou, “Turbo-codes and high spectral efficiency modulation,"
in Proc. ICC’94, New Orleans, LA, USA, May 1994.
[14] K. S. Kim, K. Hyun, C. W. Yu, Y. O. Park, D. Yoon, and S. K.Park, “General log-likelihood