The Open Journal of Occupational Therapy
The Open Journal of Occupational Therapy
Volume 7
Issue 1 Winter 2019 Article 4
January 2019
The Sensory Processing 3-Dimensions Scale: Initial Studies of
The Sensory Processing 3-Dimensions Scale: Initial Studies of
Reliability and Item Analyses
Reliability and Item Analyses
Shelley Mulligan
University of New Hampshire - USA, [email protected]
Sarah A. Schoen
Rocky Mountain University of Health Professions - USA, [email protected]
Lucy Jane Miller
Star Institute for Sensory Processing Disorder - USA, [email protected]
Andrea Valdez
Star Institute for Sensory Processing Disorder - USA, [email protected]
Deborah Magalhaes
University of New Hampshire - USA, [email protected]
Follow this and additional works at: https://scholarworks.wmich.edu/ojot
Part of the Occupational Therapy Commons
Recommended Citation Recommended Citation
Mulligan, S., Schoen, S. A., Miller, L. J., Valdez, A., & Magalhaes, D. (2019). The Sensory Processing 3-Dimensions Scale: Initial Studies of Reliability and Item Analyses. The Open Journal of Occupational Therapy, 7(1). https://doi.org/10.15453/2168-6408.1505
This document has been accepted for inclusion in The Open Journal of Occupational Therapy by the editors. Free, open access is provided by ScholarWorks at WMU. For more information, please contact
The Sensory Processing 3-Dimensions Scale: Initial Studies of Reliability and The Sensory Processing 3-Dimensions Scale: Initial Studies of Reliability and Item Analyses
Item Analyses
Abstract Abstract
Background: The Sensory Processing 3-Dimensions Scale (SP-3D) is a performance-based measure for assessing sensory processing abilities and challenges, including sensory modulation, sensory
discrimination, and sensory-based motor disorders. Initial studies of reliability were conducted, and item response theory was applied to assist in refining the measure.
Methods: Descriptive and correlational methods were used to examine internal consistency of the scales and inter-rater reliability. Item response theory using Rasch analyses was applied to examine
unidimensionality of scales, model fit, and item difficulty.
Results: Internal consistency for most measures was acceptable, demonstrating the subtests, domains, and behavior scales as distinct constructs. Inter-rater reliability results were mixed, with fair to strong reliability coefficients for most sensory discrimination and postural and praxis subtests. Scales measuring sensory modulation and motor behaviors had moderate to poor inter-observer agreement. Rasch analyses supported subtests as unidimensional and identified the most rigorous items in the subtests.
Conclusions: Preliminary results show promise of the SP-3D as a stable, reliable tool. A need for
refinement of some operational definitions for behavior ratings was identified, and items to consider for elimination because of redundancy or ill-fit were exposed. Directions for research include refinement of the SP-3D and the need for further reliability and validity studies.
Comments
The authors disclose a contract with Western Psychological Services to publish the Sensory Processing Three Dimensions Scale described in this study. There has been no payment or royalties received.
Keywords Keywords
sensory processing, measurement, children
Cover Page Footnote Cover Page Footnote
The authors would like to thank the children and their parents who graciously gave of their time to participate in this study. We also thank the University of New Hampshire OT graduate students from the OT 886 course, Engagement in Research, who assisted with the data collection.
Credentials Display
Shelley Mulligan, PhD., OTR/L FAOTA; Sarah A. Schoen, PhD., OTR/L; Lucy Jane Miller, PhD., OTR; Andrea Valdez, BS; Deborah Magalhaes, BS
Copyright transfer agreements are not obtained by The Open Journal of Occupational Therapy (OJOT). Reprint permission for this Applied Research should be obtained from the
corresponding author(s). Click here to view our open access statement regarding user rights and distribution of this Applied Research.
DOI: 10.15453/2168-6408.1505
This paper reports on the development and reliability of the Sensory Processing 3- Dimensions scale (SP3D), a new assessment tool for measuring sensory processing behaviors, abilities, and
challenges in children 3 to 13 years of age (Miller, Schoen, & Mulligan, 2016). Sensory processing refers to the ability to receive, modulate, interpret, and integrate information through the sensory systems (visual, auditory, tactile, taste and smell, vestibular, and proprioception) and respond accordingly to meet the demands of everyday life (Ayres, 1972; Miller, Schoen, & Nielsen, 2012). Being able to process sensory information accurately and efficiently contributes to a child’s ability to perform daily occupations, including play, school-related activities, socialization, and basic activities of daily living. Sensory processing also contributes to a child’s ability to regulate his or her behavior for meeting environmental demands or expectations.
Sensory integration theory, pioneered by Ayres (1972), postulates how the brain processes sensation for producing desired motor and behavioral responses (Mailloux et al., 2011; Miller,
Anzalone, Lane, Cermak, & Osten, 2007). Ayres’ research focused on increasing our understanding of children with a wide range of disabilities, such as learning, emotional, and developmental disorders, by determining and explaining how underlying sensory integration and processing problems contribute to the many challenges these children face in their daily lives. Research suggests that approximately 10% to 20% of children display symptoms of a sensory processing disorder (SPD) (Ben-Sasson, Carter, & Briggs-Gowan, 2009; Miller et al., 2012). However, the prevalence of sensory processing problems is much higher (estimates of over 90%) in children with developmental disorders, such as autism (Chang et al., 2014). Despite the high prevalence of SPDs, there are few standardized, performance-based
assessment tools available for specifically measuring sensory processing differences or deficits. Performance-based assessment tools, such as the SP3D, along with structured clinical observations of postural and motor skills and parent or caregiver report of behaviors associated with sensory processing, are optimal for obtaining a comprehensive assessment of a child’s sensory processing abilities (Schaaf et al., 2014). The Sensory Integration and Praxis Test (Ayres, 1989) has long been the gold standard for evaluating sensory integration deficits in children from 4 to 8 years, 11 months of age (Schaaf et al., 2014). However, it is limited in scope in that it does not address sensory modulation, ideational praxis, or auditory discrimination, and relatively few items address vestibular and proprioceptive functions. In their review of measurement issues related to occupational therapy using sensory integration, Schaaf et al. (2014) concluded that assessment tools that address wider age ranges, provide standardized measurements of sensory-based postural and motor skills, and evaluate ideational praxis are needed. In addition, Schaaf et al. recommended the development of cost and time effective assessment tools that can be easily applied across a variety of practice settings.
The SP3D has been developed to measure all aspects of sensory processing and has evolved from a tool called the Sensory Processing scale (Schoen, Miller, & Sullivan, 2014), which was originally designed to measure only sensory modulation behaviors. The SP3D includes both a performance-based assessment and a respondent inventory (Miller, Schoen, Mulligan, & Sullivan, 2017). This paper reports on reliability studies completed with the performance-based measure only.
Overview of the Sensory Processing 3-Dimensions Scale
The SP3D measures three primary constructs or dimensions: (a) sensory modulation; (b) sensory discrimination; and (c) sensory-based motor abilities. The SP3D is organized by seven domains, and each domain has four to nine subtests. The test is currently targeted for evaluating the sensory
processing behaviors, abilities, and dysfunction in children 3 to 13 years of age (Miller et al., 2016), although researchers are exploring the possibility of extending the age range to adolescents and adults.
Sensory modulation behaviors and sensory discrimination abilities are measured by five sensory domains corresponding to the visual, tactile, proprioceptive, vestibular, and auditory sensory systems (gustatory and olfactory sensory systems are addressed in the SP3D inventory). Sensory modulation dysfunction, identified by the SP3D, refers to challenges in regulating, adapting, and grading behavioral responses that are appropriate to sensory situations experienced in daily life. It is organized by the subtypes consistent with the SPD nosology (Miller et al., 2007): (a) sensory overresponsivity, (b) sensory underresponsivity, and (c) sensory craving (sometimes referred to as sensory seeking). Sensory discrimination disorders are assessed for the visual, auditory, tactile, vestibular, and proprioceptive systems and are defined as problems in recognizing and interpreting differences or similarities in the qualities of sensory stimuli as they are experienced (Miller et al., 2007; Miller et al., 2017). Sensory-based motor abilities and dysfunction are measured by subtests in two domains, postural and praxis, which also correspond to the two types of sensory-based motor disorders described in the SPD nosology by Miller et al. (2007). In addition to obtaining performance-based scores for each of the subtests in the praxis and postural domains, ratings of motor behavior are also made to gather information on
qualitative aspects of the child’s movement and motor performance.
Validity evidence for the SP3D suggests that the tool can discriminate typically developing children from those with known sensory processing challenges and has acceptable concurrent validity with another measure of sensory processing, the Sensory Processing measure (Mulligan et al., 2018; Parham, Ecker, Kuhaneck, Henry, & Glennon, 2007). Furthermore, the SP3D scores from a sample of children of various ages showed age and developmental trends, thus demonstrating that sensory discrimination and praxis and postural abilities mature with age (Mulligan et al., 2018) and supporting the idea that sensory processing functions are developmental in nature. The main constructs measured by the SP3D, as well as its administration and scoring procedures, are described further in the Method section.
Method
This study investigated the internal consistency reliability, inter-rater reliability, and model fit of items in the subtests using the Rasch model for the SP3D. We aimed to gather preliminary evidence of the tool’s reliability and to gather data for guiding decisions for reducing the number of items, with the goal of shortening the administration time to under 60 min.
Participants
We recruited a convenience sample of 103 participants 4 to 13 years of age (mean = 7.5, SD = 2.6), including 64 males and 39 females. Signed informed consent from a parent was obtained (and assent from the children) prior to data collection. Forty-one participants were identified as having a SPD, 62 were typically developing, and a fairly equal distribution across four age groups was obtained (see Table 1). All procedures for this study were approved by the Institutional Review Board for the Protection of Human Subjects of the academic institution of the first author. The children identified as typically developing had never received any therapy, early intervention services, or specialized
educational services, and no developmental concerns or neurodevelopmental diagnoses were reported by a parent or caregiver. The children identified as having a SPD were recruited from therapy clinics where the child had been referred for occupational therapy services because of sensory processing concerns impacting his or her performance and functioning in daily life. SPD was verified based on the global
clinical impression of the referring occupational therapist following a comprehensive evaluation that included standard motor scales appropriate to age (Miller Function and Participation scales [Miller, 2006]; Bruininks-Oseretsky Test of Motor Proficiency-11[Bruininks & Bruininks, 2005]; and the Goal-oriented Assessment of Life Skills [Miller & Oakland, 2013]). Observations of gross motor play were also made, parent interviews were conducted, and results from standardized parent report measures of the child’s behavior were considered using the Short Sensory Profile (Dunn, 1999), the Adaptive Behavior Assessment System-2 (Harrison & Oakland, 2008), and the Behavior Assessment System for Children-2 (Reynolds & Kemphaus, 2004). Of the clinical sample, 7% had ADHD, and 13% had an autism spectrum disorder as coexisting conditions, based on a review of records and parent report, while the remainder had not been diagnosed with a neurodevelopmental disorder.
Table1
Subject Characteristics
Age Group Years
SPD N = 41 Typical N = 62
Total
Male Female Male Female
3-4 5 1 11 6 23
5-6 8 2 4 8 22
7-8 10 1 8 10 29
9-12 10 4 8 7 29
Total 33 8 31 32 103
Note. SPD = Sensory processing disorder.
Procedures
Most of the administrations of the SP3D were completed in a clinic setting during one 90 min session, with short breaks between domains, as needed. For convenience, some of the children were assessed in their homes or in their child care settings, if the setting provided an adequately quiet space and child-sized table and chairs. For some of the children, the administration was completed during two 40 to 60 min sessions that occurred over 2-weeks. The SP3D was administered by six occupational therapy clinicians and five occupational therapy students, who had been trained to administer and score the SP3D by one of the test authors. In addition, three occupational therapy graduate students were trained in the administration and scoring of the SP3D and participated in the inter-rater reliability portion of the study. Training included detailed review of the test manual, live practice administration with one to two children with feedback from the trainer, and review of videotaped administrations and scoring. Depending on the individual’s learning style and experience level with sensory integration assessment, training took 15 to 20 hr. Those administering and scoring the SP3D with children in the clinical sample were not blinded to participant diagnosis.
The Sensory Processing 3-Dimensions Scale
The SP3D assess sensory modulation by rating three atypical behavioral response patterns that may occur during the administration of subtests in the visual, auditory, tactile, proprioceptive, and vestibular domains. Behaviors associated with sensory overresponsivity are characterized by intense, exaggerated responses to sensory events that most children do not perceive as negative or noxious. Responses may last unreasonably long and may result in undesirable behaviors, such as withdrawal, avoidance, or aggression (Miller et al., 2017; Schoen, Miller, & Green, 2008). Sensory
underresponsivity behaviors are muted or slowed responses to sensory experiences. There may be an apparent lack of awareness and/or indifference or diminished responsivity. Finally, sensory craving atypical behaviors reflect a drive for greater or more intense sensory input than what one would normally want or that would naturally occur (Miller et al., 2017; Schoen, Miller, & Sullivan, 2014). Items for some of the SP3D subtests were selected or designed to provide specific types of sensory input with adequate intensity so that atypical responses would be elicited if problems or differences were present. For example, the Lightening Game, from the visual domain, requires the child to look at a strobe light, and the Round and Round Game asks the child to look at a spinning circular disc with contrasting black and white circles (like a bull’s-eye). The tactile domain’s Goo Game requires the child to handle a gooey substance. Modulation behaviors are observed, and atypical behaviors are scored as being either present or absent during each subtest. Scores are then obtained by summing the number of occurrences of atypical behaviors reflective of each of the three modulation disorder subtypes for the five sensory domains.
Sensory discrimination is also assessed by subtests in each of the five sensory domains. Sensory discrimination is the ability to perceive and interpret sensory information accurately in daily life through the recognition of qualitative and quantitative aspects of sensory features of objects and experiences processed through the sensory systems (Miller & Schaaf, 2008). Sensory discrimination abilities permit comparison of details and perception of similarities and differences in the sensory features of objects or experiences. A sensory discrimination disorder, then, is a problem in recognizing and interpreting differences or similarities in the qualities of sensory stimuli (Miller et al., 2007;Miller et al., 2017; Miller & Schaaf, 2008). The SP3D visual domain includes subtests for assessing figure-ground
discrimination, visual attention to detail, spatial relations, and position in space concepts. A score based on the number of items correct is calculated for each subtest, and then a composite discrimination score is calculated for each sensory domain by summing totals from each subtest. Tactile domain subtests examine stereognosis, finger identification, and the ability to recognize shapes drawn on the hand. The proprioceptive domain has subtests involving the performance of arm and hand movements with eyes open and with eyes closed, matching slow movements, and the ability to match the force and direction of movement. The vestibular domain has one discrimination subtest that examines static and dynamic balance and the maintenance of postures with eyes closed and with eyes open. The auditory domain includes subtests requiring the discrimination of words (i.e., they are the same or different; they rhyme or do not rhyme), phrases or sentence repetition, and the ability to discriminate sounds by matching sounds to corresponding pictures. Since test items that make up the sensory discrimination subtests involve the application and processing of sensory stimuli, they also provide a natural opportunity to observe how the child modulates the sensory input. Therefore, in addition to scoring the child’s performance for discrimination ability, modulation behaviors are also observed and scored for each of the subtests.
The postural and praxis domains of the SP3D address the two types of sensory-based motor disorders (Miller et al., 2007), and each has six subtests. Subtests included in the postural domain examine the child’s ability to sustain anti-gravity postures, muscle strength (pushups and standing broad jump), the ability to imitate motor sequences requiring bilateral coordination, and coordination of eye movements. Postural disorder occurs when an individual lacks the ability to stabilize his or her body during movement or at rest to the extent that he or she is unable to meet the demands of the environment or of a given motor task (Miller et al., 2007). Postural disorder is often characterized by abnormal
muscle tone, inadequate control of movement, or inadequate muscle contraction and tension for executing movements against gravity or resistance (Blanche, Reinoso, Chang, & Bodison, 2012).
Individuals with postural disorder may experience problems coordinating eye movements and often have trouble performing age appropriate fine motor, gross motor, and visual-motor skills.
The SP3D praxis domain assesses many areas of praxis, including (a) oral praxis, or the planning and executing of oral movements; (b) motor imitation of postures and sequencing of movements; (c) constructional praxis by copying and building designs made with craft sticks; (d) motor planning with objects; and (e) ideational praxis, such as the ability to recognize the affordances of a novel object and the use of gestures. Dyspraxia is characterized by deficits in conceptualizing, planning, sequencing, and/or executing motor actions, especially novel actions (Miller et al., 2007; Miller & Schaaf, 2008). Children with dyspraxia may be slow to initiate and position their bodies effectively for motor tasks and often present with poorly coordinated fine and gross motor performance. They may have difficulty with motor imitation and often seem unsure of where their bodies are in space, and have trouble judging their distance from objects, people, or both.
In addition to obtaining performance-based scores for each of the subtests in the postural and praxis domains, such as time in seconds to complete a task, or the number of items responded to correctly, observations of motor behaviors are made to gather qualitative data regarding the child’s motor abilities. Atypical motor behaviors are observed and scored under three categories: (a) poor posture/weak; (b) awkward; and (c) slow/few ideas. Poor posture/weak is indicated when a child’s muscles appear weak; the child may fatigue easily, struggle to keep an upright standing or sitting posture, or be unable to sustain the necessary muscle contraction to complete required motor tasks. In the awkward category, motor movements appear clumsy or uncoordinated and inefficient and may be poorly graded or jerky. Finally, in the slow/few ideas category, children may show difficulty creating and executing goal-directed motor plans and organizing motor behavior, and tasks are often completed with excessive cognitive effort rather than appearing automatic.
Data Analyses
Data analyses were conducted at the item, subtest, and domain levels. To examine internal consistency reliability among items in a subtest, and among subtests in a domain, standard coefficients using Cronbach’ alpha were computed. First, internal consistency reliability values were obtained for subtests with multiple items in the sensory domains measuring discrimination and for subtests in the postural and praxis domains. Second, internal consistency was assessed at the domain level by
considering the total scores for each of the sensory discrimination subtests in each sensory domain. In a similar way, we examined the subtest totals in the postural domain and the praxis domain as separate scales. Third, internal consistency reliability was examined for the atypical sensory modulation and atypical motor behavior scales by considering the ratings for each atypical behavioral pattern as a separate scale. Since few atypical behaviors were observed in the typically developing children in the sample, analyses for the modulation and motor behavior rating scales were performed with data only from children identified as having SPD. Atypical modulation behaviors included three scales: sensory overresponsivity, sensory underresponsivity, and sensory craving. Two behaviors were rated for each pattern. Atypical motor behavior also included three scales: poor posture/weak, awkward, and slow/few ideas.
To examine inter-rater reliability, six occupational therapy graduate students, trained in test administration and scoring, independently scored the same four full administrations of the SP3D from a
digital video file using their own computers. In some cases, more than one child was used to complete all seven domains of the SP3D as one administration. Three of the administrations were with typically developing children, and one full administration used two children with SPD. Intraclass correlation coefficients (ICC) and percent agreement of subtest total scores were used as estimates of inter-rater reliability and inter-observer agreement among the scores from the six raters for sensory discrimination and performance scores of the subtests of each domain. Percent agreement at the item level and Kappa values based on each of the atypical behavioral totals were calculated to examine consistency across raters with their ratings of motor and modulation behaviors. Mean ICC values are reported as opposed to the singular option, and the two-way random ICC model was applied, since a consistent sample of raters was used with each of the cases.
Item analyses were conducted using the Rasch model with 18 subtests; those having multiple items scored dichotomously as either passed or failed. Item fit was examined by considering MnSq infit and MnSq outfit values, item difficulty level, and to explore the unidimensionality of each subtest. For each item in a subtest, the analyses provided an estimate of item difficulty, the standard error of each item difficulty estimate, and goodness of fit statistics. Item fit was examined by MnSq infit values, which relate to the effects of unexpected scores, such as the case when items are passed that are too difficult for a person’s ability level. MnSq outfit values are affected by outlying scores. Items with MnSq values outside of 0.6 -1.4 were targeted for further study. Item analyses also involved an
examination of descriptive statistics, including frequencies, measures of central tendency, and measures of variability. Data were analyzed using SPSS version 23 (IBM Corporation, 2015), with the exception of the Rasch analyses and Kappa statistics, which were performed using Stata (StataCorp LLC, 2015).
Results
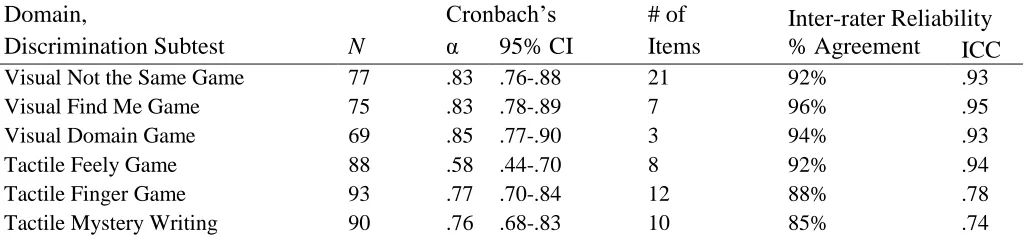
Internal consistency reliability for the items included in each of the sensory discrimination subtests are reported in Table 2. Cronbach’s alpha values were fair to strong with subtest
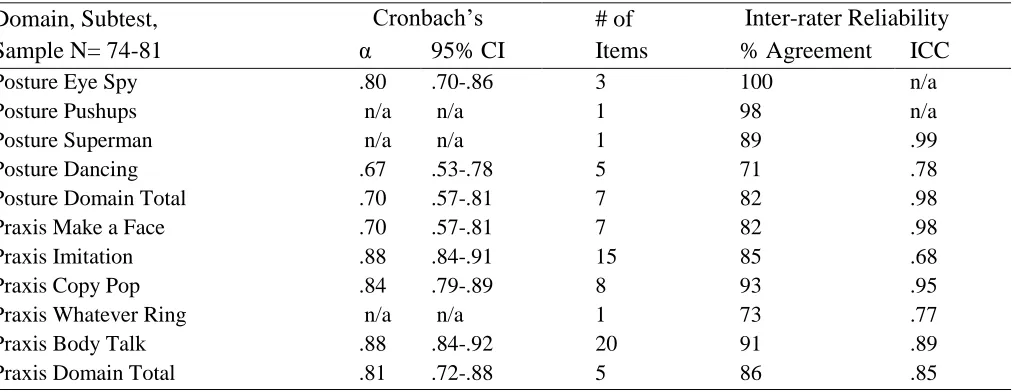
coefficients ranging from .58 (Tactile Feely Game) to .96 (Auditory Sounds and Words, Parts 3 and 4) and domain total α coefficients ranging from .60 (proprioception) to .91 (vestibular). The results suggested that items in subtests are more closely associated with one another than are the subtests in a domain, as would be expected (see Table 2). The reliability coefficients for the praxis and postural domains, and associated subtests, are reported in Table 3. The coefficients were somewhat stronger than those for the sensory domains and ranged from α = .67 (Postural Dancing Game) to .88 (Praxis Imitation Game). Subtests in the praxis domain showed strong internal consistency.
Table 2
Internal Consistency and Inter-rater Reliability of the Sensory Discrimination Subtests and Domain Totals
Domain,
Discrimination Subtest N
Cronbach’s # of Items
Inter-rater Reliability
α 95% CI % Agreement ICC
Visual Not the Same Game 77 .83 .76-.88 21 92% .93
Visual Find Me Game 75 .83 .78-.89 7 96% .95
Visual Domain Game 69 .85 .77-.90 3 94% .93
Tactile Feely Game 88 .58 .44-.70 8 92% .94
Tactile Finger Game 93 .77 .70-.84 12 88% .78
Tactile Mystery Writing 90 .76 .68-.83 10 85% .74
Table 3
Internal Consistency and Inter-rater Reliability of the Posture and Praxis Domains
Domain, Subtest, Sample N= 74-81
Cronbach’s # of Items
Inter-rater Reliability
α 95% CI % Agreement ICC
Posture Eye Spy .80 .70-.86 3 100 n/a
Posture Pushups n/a n/a 1 98 n/a
Posture Superman n/a n/a 1 89 .99
Posture Dancing .67 .53-.78 5 71 .78
Posture Domain Total .70 .57-.81 7 82 .98
Praxis Make a Face .70 .57-.81 7 82 .98
Praxis Imitation .88 .84-.91 15 85 .68
Praxis Copy Pop .84 .79-.89 8 93 .95
Praxis Whatever Ring n/a n/a 1 73 .77
Praxis Body Talk .88 .84-.92 20 91 .89
Praxis Domain Total .81 .72-.88 5 86 .85
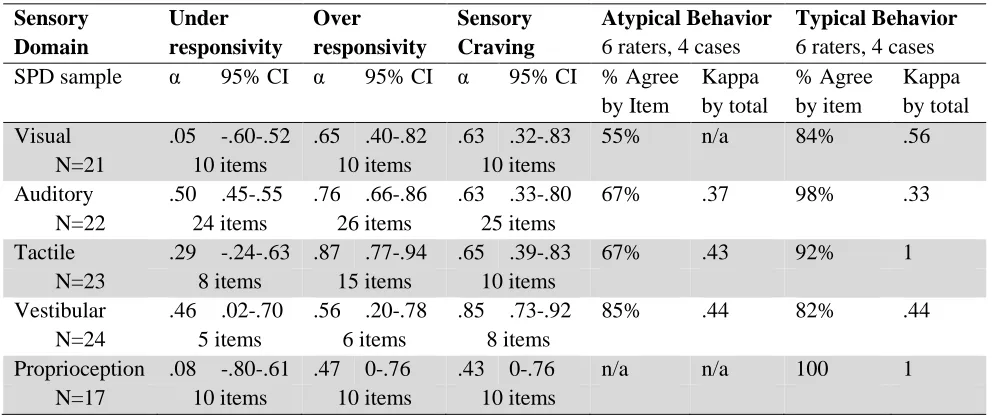
For sensory modulation, two specific behaviors were rated for each subtype: sensory overresponsivity, sensory underresponsivity, and sensory craving. Ratings were made at least once during or immediately following the administration of each subtest. The results are presented in Table 4 and show poor to fair internal consistency reliabilities for the modulation behavioral ratings, with
Cronbach’s α values ranging from .05 to .89. Values for sensory overresponsivity demonstrated the most consistency, with coefficients ranging from .47 (proprioception) to .87 (tactile). Poor internal
consistency reliability was noted for the sensory underresponsivity scale (α’s ranging from 05-.50), and fair reliability was noted for sensory craving, with α’s ranging from .43 (proprioception) to .85
(vestibular). The results also indicated that internal consistency reliability varied by sensory system. For example, the tactile and auditory domains had the highest alpha coefficients ranging from .29 to .87, while the proprioception domain had the lowest, ranging from .08 to .43 (see Table 4).
Tactile Domain Total 79 .82 .74-.88 4 92% .95
Vestibular Statue Game 58 .91 .87-.94 13 65% .80
Proprioceptive Follow Me 81 .88 .83-.91 8 97% 1
Proprioceptive Finger Tap 90 .95 .93-.96 8 Insufficient data Proprioceptive Nosey Game 78 .93 .90-.95 6 92% .57 Proprioceptive Ladder Wheel 42 .79 .66-.88 3 Insufficient data Proprioception Domain Total 30 .60 .30-.78 5 98% .56 Auditory Sounds & Words 1-2 79 .91 .87-.93 20 92% .90 Auditory Sounds & Words 3-4 66 .96 .94-.97 24 92% .90
Auditory Say What I Say 77 .84 .78-.89 11 98% .90
Auditory Sounds and Pictures 89 .79 .72-.85 15 93% .92
Auditory Domain Total 37 .77 .61-.87 4 94% .91
Table 4
Internal Consistency (Cronbach’s Alpha) and Inter-rater Reliability of Modulation Behavior Ratings
Sensory Domain Under responsivity Over responsivity Sensory Craving Atypical Behavior
6 raters, 4 cases
Typical Behavior
6 raters, 4 cases SPD sample α 95% CI α 95% CI α 95% CI % Agree
by Item Kappa by total % Agree by item Kappa by total Visual .05 -.60-.52 .65 .40-.82 .63 .32-.83 55% n/a 84% .56
N=21 10 items 10 items 10 items
Auditory .50 .45-.55 .76 .66-.86 .63 .33-.80 67% .37 98% .33
N=22 24 items 26 items 25 items
Tactile .29 -.24-.63 .87 .77-.94 .65 .39-.83 67% .43 92% 1
N=23 8 items 15 items 10 items
Vestibular .46 .02-.70 .56 .20-.78 .85 .73-.92 85% .44 82% .44
N=24 5 items 6 items 8 items
Proprioception .08 -.80-.61 .47 0-.76 .43 0-.76 n/a n/a 100 1
N=17 10 items 10 items 10 items
Note. % Agree refers to percent agreement; items showing no variance were excluded when calculating Cronbach’s α; n/a if insufficient data.
Internal consistency reliability of the ratings of atypical motor behaviors: weak/poor posture; awkward; and slow/few ideas are presented in Table 5. The results indicate fair to good internal consistency reliabilities for the motor behavior ratings, with Cronbach’s α values ranging from .52 to .85. Values for awkward demonstrated the highest consistency with α coefficients of .78 for the postural domain, and .85 for the praxis domain.
Inter-rater reliability results, including percent agreement and intra-class correlation coefficients (ICC) for the sensory discrimination subtests, domain totals, and the praxis and postural subtests and domain totals are presented in Tables 2 and 3. As noted earlier, these results were based on data from six independent raters who scored four full administrations of the SP3D. Percent agreement was calculated at the item level using the formula, (agreements/agreements + disagreements) x100 for each pairing, and then averaging the results across pairings. The results showed acceptable to high % agreement (85-100) for all but one subtest, which was the vestibular Statue Game. ICC values were also quite strong with all but four tests showing ICC = .80 or higher.
Table 5
Internal Consistency (Cronbach’s Alpha) and Inter-rater Reliability of the Motor Behavior Scales
Sensory-based Motor Domain
Weak, Poor Posture
Slow,
Few Ideas Awkward Atypical Behavior
Typical Behavior Total
SPD sample α 95%
CI α
95% CI α
95% CI % Agree* by item Kappa by total % Agree* by item Kappa by total
Postural .82 .69-.92 .64 .36-.84 .78 .61-.90 80% .60 91% 1
N = 20 25 items 30 items 14 items
Dyspraxia .52 .17-.77 .78 .63-.90 .85 .73-.93 52% .40 92% .46
N = 22 14 items 14 items 7 items
Note. % Agree* refers to percent agreement; items showing no variance were excluded when calculating Cronbach’s α.
Inter-rater reliability analyses were limited for the atypical modulation and motor behavior scales because there were few occurrences of atypical behaviors by the children used for this part of the study. Kappa values and percent agreement could not be computed for some variables because of no or too few occurrences of the atypical behavior being rated. The results that were obtained are presented in Tables 4 and 5. Percent agreement for atypical modulation behaviors, when they occurred, ranged from 55% (visual domain) to 85% (vestibular domain). Percent agreement for typical modulation behavior was higher and ranged from 82% to 100%. Therefore, the results suggest that raters were reliable in detecting whether a child’s behavior was atypical or typical. However, when behavior was identified as atypical, raters were often inconsistent in assigning the specific type of atypical modulation behavior. Kappa values ranged from .37 to .43 for total atypical modulation behaviors and from .33 to .56 for typical behavior ratings, which is considered fair to moderate agreement among raters (Landis & Koch, 1977).
Percent agreement for ratings of atypical motor behaviors was 52% for the praxis domain, and 80% for the postural domain (see Table 5). Percent agreement for rating motor behavior as typical was 91% and 92% for the praxis and postural domains, respectively. Therefore, as with the modulation behaviors, the raters were reliable in detecting whether a child’s motor behavior was atypical or typical. However, when motor behavior was identified as atypical, the raters were often inconsistent in assigning the specific type of atypical motor behavior. Kappa values ranged from .40 to 1 for the Motor Behavior scales, which is considered moderate to strong agreement among raters (Landis & Koch, 1977).
Rasch analyses were conducted with 18 subtests having multiple items to allow for examination of the unidimensionality of each subtest, the fit of items in a subtest, and the item difficulty. Items that did not have any variability were excluded, and this occurred for the first item of most of the subtests. This was an expected result because the first items are teaching items, and even though they are scored, most children are expected to, and did, complete those items correctly. For 15 of 18 (83%) of the subtests examined, less than 5% of the items failed to fit the Rasch model, suggesting that these 15 subtests represent well-defined constructs. Test items with MnSq infit and outfit values falling outside 0.6 -1.4 were considered as all-fitting. Approximately 20% (one or two) of the subtests from the proprioceptive, tactile, and postural domains contained some items identified as ill-fitting. Item difficulty values were examined and were helpful in identifying items in subtests that were redundant (same difficulty level) and that could be considered for elimination. Also, 0 to15% of items in a given subtest were identified as being misplaced in terms of order, and the results, therefore, were useful for identifying the accurate ordering of items from the easiest to the most difficult for many of the subtests.
Discussion
Internal consistency for the subtests measuring sensory discrimination demonstrated that each of the subtests measure well-defined, discrete functions. In addition, the results showed that the various subtests in a sensory domain relate to one another, although not as strong as items in a subtest. The fact that there are different kinds of discrimination functions in each sensory system might explain this. For example, in the proprioceptive domain, one subtest measures the detection of pressure or the amount of force exerted by the arms with direction of movement (Follow-Me Game), while another focuses on the accuracy of movement in terms of direction and distance (Nosey Game). Internal consistency reliability coefficients for the subtests of the praxis and postural domains were also adequate, and a little stronger than those for the sensory domains. Perhaps functions relating to postural control that are measured in the postural domain and the different types of praxis addressed in the praxis domain are more similar
with one another than the extent of similarity of the various sensory discrimination functions being measured in a sensory system.
The results for the atypical sensory modulation and atypical motor behavior ratings were mixed. Weak internal consistency reliability was noted for the underresponsivity scale across sensory domains. It may be that the sensory underresponsivity pattern is seen less often and that behaviors associated with that pattern are subtle and difficult to detect. The sensory craving and sensory overresponsivity scales showed fair to good reliability for all domains, except proprioception. It may be that the atypical sensory modulation behaviors do not present themselves in that sensory system, or that the items or tasks
included in the proprioceptive domain do not provide sufficient opportunities to detect behavioral atypicalities related to sensory modulation when they do exist. Reliability coefficients for the Motor Behaviors scales supported the atypical motor behaviors as being well-defined constructs, with awkward having the strongest internal consistency.
Inter-rater reliability was in acceptable limits for eight out of 11 of the subtests for sensory discrimination. Low reliability for the two tactile tests (Mystery Writing and Feely Game) and one proprioceptive subtest (Nosey Game) may be at least partially explained by poor camera placement, which occasionally hindered the raters from clearly seeing the child’s responses. Inter-rater reliability for the performance-based scoring of the subtests in the posture and praxis domains was strong for six out of nine of the subtests and for the domain totals. Those subtests with lower ICCs might, again, be at least partially explained by use of digital video and less than optimal camera placement. For the praxis domain (Whatever Ring Game), scoring errors were evident, suggesting either the need for the
administrators to have more practice or training or for a more simplified scoring system. The data for examining interobserver agreement for the modulation and motor behaviors were limited and must be interpreted with caution because there were relatively few occurrences of the atypical behaviors being examined. The data did show that raters can consistently distinguish atypical from typical sensory modulation and motor behaviors throughout the administration of the SP3D. However, there were some challenges in identifying the specific types of atypical behavior observed. Operational definitions for slow to respond and decreased awareness, the two behaviors rated for the underresponsivity pattern, may need to be revised to allow administrators to rate those behaviors in the pattern of sensory
underresponsivity more consistently.
The Rasch analyses supported the results from the internal consistency analyses showing that the items in subtests do fit together as cohesive scales, and that the subtests in given domains represent well-defined constructs. In the few places where ill-fitting items were identified, they were closely examined to explore why they did not fit well. It was recommended that most of those items be eliminated or modified to be easier or more difficult, to achieve a more uniform scale. Further descriptive analysis of the data provided a data-driven approach for the ordering of items from easiest to most difficult, which will be helpful for identifying start and discontinuation criteria for children of various ages.
Limitations
A number of study limitations must be considered in the interpretation of the findings. In addition to the relatively small sample, the use of the digital video for inter-rater data collection was limiting in that, at times, the video lacked clarity or obstructed the viewing of vital child behavior. Second, the process for identifying the clinical sample was not ideal, since there is not a definitive test for diagnosing SPD. Children were identified as having SPD based on the global clinical impression of the referring therapist, which poses a risk for misplacement. However, experienced clinicians applied a
comprehensive evaluation using multiple data sources for obtaining the clinical impression, which minimized this risk. Administration of the SP3D was not completed by evaluators blinded to diagnostic condition, however, which poses a risk for bias in the scoring. Finally, the use of mostly typical children for the inter-rater reliability portion of the study resulted in few atypical behaviors for analyses, and the small sample prevented reliability and item analyses of the SP3D by SPD subtype.
Conclusion
This study provides preliminary evidence of the internal consistency and inter-rater reliability of a new, comprehensive, performance-based measure of sensory processing, the SP3D. Item analyses showed promise for use of the SP3D for evaluating children from 3 to 13 years of age and for all subtypes of SPD. The understanding and measurement of a child’s sensory processing strengths and challenges that can be achieved through the SP3D will be helpful for guiding the delivery of appropriate occupational therapy interventions using a sensory integration framework for children with sensory processing challenges. This study’s results will be applied to revise and refine the SP3D subtests and items. The results have provided useful information for identifying training needs for standardized administration and scoring in preparation for normative data collection. Further studies of reliability and validity of the SP3D are needed.
References
Ayres, A. J. (1972). Sensory integration and learning
disorders. Torrance, CA: Western Psychological
Services.
Ayres, A. J. (1989). Sensory Integration and Praxis Test: SIPT manual. Torrance, CA: Western
Psychological Services.
Ben-Sasson, A., Carter, A. S., & Briggs-Gowan, M. J. (2009). Sensory over-responsivity in elementary school: Prevalence and social-emotional correlates. Journal of Abnormal Child Psychology, 37(5), 705-716.
https://doi.org/10.1007/s10802-008-9295-8 Blanche, E. I., Reinoso, G., Chang, M. C., & Bodison, S.
(2012). Proprioceptive processing difficulties among children with autism spectrum disorders and developmental disabilities. American Journal of Occupational Therapy, 66(5), 621-624. https://doi.org/10.5014/ajot.2012.004234 Bruininks, R. H., & Bruininks, B. (2005).
Bruininks-Oseretsky Test of Motor Proficiency (2nd ed.). Bloominton, MN: Pearson Education, Inc. Chang, Y. S., Owen, J. P., Desai, S. S., Hill, S. S., Arnet,
A. B., Harris, J., … Mukherjee, P. (2014). Autism and sensory processing disorders: Shared white matter disruption in sensory pathways but divergent connectivity in social-emotional pathways. PLoS ONE, 9(7), e103038.
https://doi.org/10.1371/journal.pone.0103038 Dunn, W. (1999). Sensory Profile: User’s manual. San
Antonio, TX: Pearson Education, Inc.
Harrison, P. L., & Oakland, T. (2008). Adaptive Behavior Assessment System (2nd ed.). Torrance, CA: Western Psychological Services.
IBM Corporation. (2015). SPSS Statistics 23, Statistics for Windows. Armonk, NY: Author.
Landis, J. R., & Koch, G. G. (1977). The measurement of observer agreement for categorical data. Biometrics, 33(1), 159-174.
https://doi.org/10.2307/2529310
Mailloux, Z., Mulligan, S., Roley, S. S., Blanche, E., Cermak, S., Coleman, G. G., … Lane, C. J. (2011). Verification and clarification of patterns of sensory integrative dysfunction. American Journal of Occupational Therapy, 65(2), 143-151. https://doi.org/10.5014/ajot.2011.000752 Miller, L. J. (2006). Miller Function and Participation
Scales. San Antonio, TX: Pearson Education, Inc.
Miller, L. J., Anzalone, M. E., Lane, S. J., Cermak, S. A., & Osten, E. T. (2007). Concept evolution in sensory integration: A proposed nosology for diagnosis. American Journal of Occupational Therapy, 61(2), 135-140.
https://doi.org/10.5014/ajot.61.2.135 Miller, L. J., & Oakland, T. (2013). Goal-oriented
Assessment of Lifeskills. Torrance, CA: Western Psychological Services.
Miller, L. J., & Schaaf, R. C. (2008). Sensory processing disorder. Encyclopedia of Infant and Early
Childhood Development, 127-136.
https://doi.org/10.1016/B978-012370877-9.00142-0
Miller, L. J., Schoen, S., & Mulligan, S. (2016). Sensory Processing 3-Dimensions Measure: Research edition, unpublished test manual.
Miller, L. J., Schoen, S. A., Mulligan, S., & Sullivan, J. (2017). Identification of sensory processing and integration symptom clusters: A preliminary study. Occupational Therapy International,
2017, 1-10.
https://doi.org/10.1155/2017/2876080 Miller, L. J., Schoen, S. A., & Nielsen, D. M. (2012).
Sensory processing disorder: Implications for multisensory function. In B. E. Stein (ed.), The new handbook for multisensory processing (pp. 707-721). Cambridge MA: Massachusetts Institute of Technology Press.
Mulligan, S., Schoen, S., Miller, L. J., Aldez, A., Wiggins, A., Hartford, B., & Rixon, A. (2018). Initial studies of validity of the Sensory Processing 3-Dimensions Scale. Physical and Occupational Therapy in Pediatrics, 1-13. https://doi.org/10.1080/01942638.2018.1434717 Parham, L. D., Ecker, C., Kuhaneck, H. M., Henry, D. A.,
& Glennon, T. J. (2007). Sensory Processing Measure: Home form. Torrance, CA: Western Psychological Services.
Reynolds, C. R., & Kemphaus, R. W. (2004). Behavior Assessment System for Children (2nd ed.). Bloomington, MN: Pearson Education, Inc. Schaaf, R. C., Burke, J. P., Cohn, E., May-Benson, T. A.,
Schoen, S. A., Smith-Roley, S., … Mailloux, Z. (2014). State of measurement in occupational therapy using sensory integration. American Journal of Occupational Therapy, 68(5), e149-153. https://doi.org/10.5014/ajot.2014.012526 Schoen, S. A., Miller, L. J., & Green, K. E. (2008). Pilot
study of the Sensory Over-Responsivity Scales: Assessment and inventory. American Journal of Occupational Therapy, 62(4), 393-406.
https://doi.org/10.5014/ajot.62.4.393 Schoen, S. A., Miller, L. J., & Sullivan, J. C. (2014).
Measurement in sensory modulation: The Sensory Processing Scale Assessment. American Journal of Occupational Therapy, 68(5), 522-530. https://doi.org/10.5014/ajot.2014.012377 StataCorp LLC. (2015). Statistical Software, Release 14.
College Station TX: Author.