The Open Journal of Occupational Therapy
The Open Journal of Occupational Therapy
Volume 6
Issue 1 Winter 2018 Article 5
January 2018
Feasibility Exploration of Electrodermal Response to Food in
Feasibility Exploration of Electrodermal Response to Food in
Children with ASD Compared to Typically Developing Children
Children with ASD Compared to Typically Developing Children
Michelle A. Suarez
Western Michigan University - USA, [email protected]
Follow this and additional works at: https://scholarworks.wmich.edu/ojot
Part of the Occupational Therapy Commons
Recommended Citation Recommended Citation
Suarez, M. A. (2018). Feasibility Exploration of Electrodermal Response to Food in Children with ASD Compared to Typically Developing Children. The Open Journal of Occupational Therapy, 6(1).
https://doi.org/10.15453/2168-6408.1336
This document has been accepted for inclusion in The Open Journal of Occupational Therapy by the editors. Free, open access is provided by ScholarWorks at WMU. For more information, please contact
Abstract Abstract
Background: Children with Autism Spectrum Disorder (ASD) frequently have food selectivity that causes additional health and quality of life stressors for the child and the family. The causes of food selectivity are currently unknown but may be linked, at least in part, to sensory processing problems.
Method: The purpose of this study was to test the feasibility of using electrodermal activity (EDA) measurement in response to food to gain insight into the physiological processes associated with eating for children with ASD compared to typically developing children. In addition, differences in food
acceptance and the relationship between food acceptance and sensory over-responsivity were explored.
Results: Children with ASD had significantly different EDA during food presentation compared to typically developing controls. In addition, children with ASD accepted significantly fewer foods as part of their regular diet, and the number of foods accepts was significantly related to a measure of SOR.
Discussion: This information has the potential to inform research and treatment for food selectivity.
Keywords Keywords
food selectivity, electrodermal, autism, sensory processing
Cover Page Footnote Cover Page Footnote
This work was supported by a grant from the Faculty Research and Creative Activities Award, Western Michigan University. Thank you to the families who participated in this study. Also, I extend my
appreciation to the many OT students who assisted with study development and data collection, including Tracey Urbansok, Kristen Hessen, Cassie Dill, Kari Schuitema, and Jonathon Haskell.
Credentials Display
Michelle A. Suarez, PhD, OTR/L
Copyright transfer agreements are not obtained by The Open Journal of Occupational Therapy (OJOT). Reprint permission for this Applied Research should be obtained from the
corresponding author(s). Click here to view our open access statement regarding user rights and distribution of this Applied Research.
DOI: 10.15453/2168-6408.1336
Autism Spectrum Disorder (ASD) is characterized by deficits in social communication and restrictive and repetitive behaviors (American Psychiatric Association [APA], 2013). In addition to these core features, a child’s challenges can be compounded by co-occurring conditions that are commonly found in individuals with ASD. Sensory processing disorder and food selectivity are two issues that can create additional stressors that impact the quality of life for this population. The purpose of this study was to test the feasibility of using electrodermal activity (EDA) to quantify the
physiological response to food in children with ASD compared to children who are typically developing. A secondary purpose was to explore the relationships between electrodermal levels during baseline video and food presentations and a sensory processing pattern. In addition, we tested the differences in food acceptance and the relationship between food acceptance and sensory processing in children with ASD compared to children who are typically developing.
Sensory Processing in Children with ASD
Sensory processing differences are common in children with ASD. Estimates of atypical sensory processing are as high as 95% (Baranek, David, Poe, Stone, & Watson, 2006). As a result, hypo- and hyper-reactivity to sensory information and/or unusual preoccupation with sensory aspects of the environment are now included in the ASD diagnostic criteria under restrictive and repetitive behaviors (APA, 2013). Several studies have documented patterns of these sensory processing differences related to sensory modulation in the autism population when compared to children who are typically developing (Liss, Saulnier, Fein, & Kinsbourne, 2006; Watling, Deitz, & White, 2001). Sensory modulation refers to the ability to use sensory information to maintain a calm-alert state for participation in everyday activities (Miller, Anzalone, Lane, Cermak, & Osten, 2007). Three disordered modulation patterns have been identified in the literature: sensory over-responsivity (SOR) (e.g., hyper-reactivity, sensory
defensiveness, sensory sensitivity), sensory under-responsivity (SUR) (e.g., hypo-reactivity), and
sensory seeking (SS) (e.g., craving). A meta-analysis by Ben-Sasson and colleagues (2009) documented significant differences in sensory modulation symptoms in children with ASD when compared to
typically developing children. They found that SUR is the most prevalent disordered pattern of modulation, followed by SOR and then SS. An additional review by Baranek, Parham, and Bodfish (2005) confirmed the variability of sensory modulation patterns in children with ASD and that SUR was the most prominent pattern.
Food Selectivity
Food selectivity is a comorbid condition in up to 80% of children with ASD (Schreck &
Williams, 2006) and may impact as many as 25% of children who are typically developing (Manikam & Perman, 2000). Children with food selectivity refuse to eat a large proportion of foods that their family eats and restrict themselves to a narrow repertoire of preferred foods (Bandini et al., 2010). In addition, children with food selectivity often have unpleasant physiological responses and disruptive behavior when presented with non-preferred foods (Howe & Wang, 2013; Williams, Gibbons, & Schreck, 2005). For example, these children may vomit and/or gag during mealtime and hit, cry, scream, and/or throw food in an effort to escape the feeding situation. The impact of food selectivity can include nutritional deficits for the child (Zimmer et al., 2012) and decreased mealtime satisfaction for the family (Rogers, Magill-Evans, & Rempel, 2012). Despite the potential nutritional and quality of life consequences of food selectivity in the ASD population, this condition is only beginning to be addressed in the literature (Cermak, Curtin, & Bandini, 2010). There is a need to further explore the relationships between sensory modulation and food selectivity and to gain a greater understanding of the physiological processes underlying food refusal behavior.
EDA as a Physiological Measure of Sensory Modulation and Food Selectivity
Due to the detrimental functional implications of sensory modulation disorder, several studies have documented some of the possible physiological underpinnings. This work may provide a
foundation for using this modality of measurement to explore relationships between sensory modulation, symptoms of autism, and food acceptance.
EDA is a non-invasive measure of underlying arousal state and reactivity to stimulus that is linked to the functioning of the autonomic, and more specifically, sympathetic (i.e., fight, flight, or freeze) nervous system functioning (Schoen, Miller, Brett-Green, & Nielsen, 2009). Electrodes are placed on either two digits or the thenar and hypothenar eminences of the palm. Data is collected during a baseline resting period and during stimulus presentation (Fowles et al., 1981). During this process, tonic and phasic outcomes are collected and analyzed (Fowles, 2008). Tonic EDA is a stable, slow changing component linked to the overall arousal system and is often captured in the skin
conductance level (measured in microsiemens) over defined blocks of time. Phasic EDA is the specific response or reactivity to a stimulus. This is measured in the amplitude and magnitude of an EDA response that occurs in the defined temporal window (typically 4 to 10 s) after a stimulus is presented (Schoen, Miller, Brett-Green, & Hepburn, 2008).
Several studies using a laboratory “Sensory Challenge Protocol” have provided information about differences in EDA response to sensory input in different diagnostic groups (Schoen et al., 2009). This protocol was developed to present sensory stimulation in a non-threatening way. Children are exposed to 10 sensation trials in each of the five sensory modalities (e.g., touch, smell, movement) in an environment designed to look and sound like a space ship. In a study comparing the EDA of children with ASD to children with sensory modulation disorder alone, children with ASD had atypical
pattern in children with autism when they examined tonic baseline and phasic response to controlled auditory stimuli. Children with ASD had significantly higher tonic baseline and recovery levels when compared to typically developing controls. Also, the ASD group demonstrated higher phasic amplitude of response to tone than the typically developing group. This discrepancy might be explained by work by Schoen, Miller, Brett-Green, and Hepburn (2008). They tested the hypothesis that children with ASD may have at least two different patterns of response to stimuli. They found that 29% were non-responders in at least one sensory domain. Then, one pattern was a higher arousal group that had higher phasic magnitudes, faster latencies, and slower habituation. The second was a lower arousal group with lower EDA magnitudes, slower latencies, and faster habituation. In addition, these patterns were present regardless of medications that some of the children were taking.
Although phasic EDA in response to stimuli has proven useful to measure physiologic response to isolated contrived sensory stimuli, there is a need to determine if EDA may be a good measure of response to functional activities. Little work has been done to determine the usefulness of EDA during a functional task.
The primary aim of this study was to develop and describe a laboratory protocol for collection of EDA data in response to eating and test the feasibility of using this measurement during this functional activity. In addition, this study sought to replicate information on differences in food inventory
acceptance between children with ASD compared to typically developing children and the relationship between food acceptance and a measure of SOR. Finally, the relationship between the tonic EDA during baseline and food presentations and a measure of SOR is explored.
Method
This feasibility study employed a cross-sectional case control design to compare children with an existing diagnosis of ASD to typically developing children 4 to14 years of age. Children with autism were recruited from the Western Michigan University (WMU) Marion R. Spear Occupational Therapy Clinic, from local autism organizations, and though snowball sampling. Inclusion criteria for the children with autism were an existing ASD diagnosis that was confirmed on the Social Responsiveness Scale (Constantino & Gruber, 2005). The exclusion criterion was the presence of food allergies.
Typically developing children were recruited through word of mouth at the WMU College of Health and Human Services and at the local elementary school and were included in the study if their parent
reported that they did not have any diagnosis that impacted behavior or learning. Typically developing children were also excluded if they had food allergies. The WMU Human Subjects Institutional Review Board approval was obtained, caregivers signed an informed consent, and the children indicated assent before EDA data collection began. Additional data, including laboratory food acceptance, collected during this study is published in Suarez (2017).
Instrumentation
Demographic information including the child’s date of birth, gender, and source of the autism diagnosis (for the ASD group only) was collected via a questionnaire. In addition, the parents were asked if their child had ever had feeding treatment.
Food frequency questionnaire. All of the parents filled out a food frequency questionnaire (i.e., food inventory) to identify foods that their child had eaten in the last month. The Food Frequency Questionnaire was originally developed for the Growing up Today Study (Field et al., 1999) and later modified by Bandini and colleagues (2010) for studying food selectivity in children with ASD. This instrument was again modified to add additional food items and then used for this study.
SOR scale. The SOR scale was developed by cross-referencing two clinically respected sources (Dunn, 1999; Miller, 2006) and reviewed by two sensory processing disorder experts for validity. This scale includes 19 items regarding tactile, visual, auditory, and vestibular processing problems. This scale was used in two other previous studies of autism and food selectivity (Suarez, Nelson, & Curtis, 2012; Suarez et al., 2013) but not yet tested explicitly for psychometric properties.
EDA. Electrodermal activity data was collected during laboratory food presentation protocol using Biopac System software. Electrodes were placed on the thenar and hypothenar eminences of the participant’s nondominant hand and data was collected with a wireless transmitter using a constant voltage (.5V) technique. The signal was sampled at 1000Hz and stored on a computer. Data was later reduced and analyzed using Acquisition (contact Biopac Systems, Inc.) software.
Laboratory Food Presentation Protocol
One primary aim of this study was to test the feasibility of using EDA to gain a better understanding of the physiological response to food in children with food selectivity and ASD. A laboratory food presentation protocol was developed for this purpose and details follow.
The parents interested in study participation were given a link to an online survey to collect
demographic information, food inventory, and SOR scale. After survey completion, the parents were given information about the laboratory portion of the study and instructed to provide contact information if interested in further participation. The parents who provided contact information were called to schedule lab time and then were sent a picture book that detailed the laboratory procedure for them to review with their child. This picture book was aimed at reducing anxiety and increasing active
participation in the protocol. When the children arrived at the lab, they were led into the room that was decorated for a “picnic”. The children sat at the table and rested their nondominant hand on a pillow while electrodes were placed on their hands. The parents sat behind the children out of view. The children then watched a 6-min cartoon video without any dialogue to get data to compare to food presentation. After the video, the children were presented with 16 different foods one at a time in a random order. The foods included four vegetables, four fruits, two proteins, three dairy items, two snack foods, and one unusual food (spicy chick pea). Acceptance of these foods is documented in Suarez (2017). The foods were brought to the table covered and then after they were placed on the table the cover was removed. The child was asked to “take a bite of” the food. Approximately 10 s after the food was either swallowed or refused, the child was asked to take a drink of water and then the next food was provided in the same manner. An observer monitored the on-screen EDA and marked when the cover was removed from the food and if/when the child took a bite of the food. Sessions were videotaped and synced to the EDA data. Marker placement was confirmed by an additional researcher using video recordings. EDA data was continuously recorded through the video baseline and food presentation phases. Markers were used to determine specific phasic responses to the visual stimuli when viewing each food.
Analysis
Descriptive statistics were used to provide information about the characteristics of the
participants. Independent t-tests were performed to investigate differences between the children with ASD and the typically developing children on the number of foods accepted on the food frequency questionnaire, the SOR scale, and the EDA. Pearson correlation was used to examine the relationship between EDA and SOR measures.
Results
Participants. Forty-eight children participated in this study. Table 1 contains demographic information for the sample (Suarez, 2017). All of the children in the ASD group were classified as having ASD on the Social Responsiveness Scale. There was not a significant difference in age between the group with ASD and the group with typically developing children (TD) t(52) = .204, p = .839. However, Chi-square analysis revealed a significant difference in the gender distribution of the groups (x2 (1) = 7.642 , p =.006) with more male participants in the ASD group.
Table 1
Sample Characteristics (N = 48)
Characteristics ASD TD
Age in years M (SD) 9.03 (3.21) 8.91 (3.19) Gender n (%)
Male Female
29 (90.6) 3 (9.4)
9 (56.3) 7 (43.7)
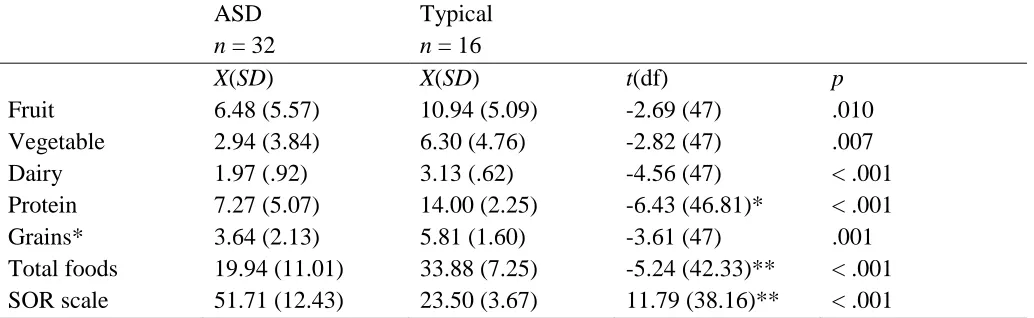
Differences on food inventory and SOR between groups. According to parent report on the Food Frequency Questionnaire, the children with autism ate significantly fewer foods when compared to typically developing children in all food groups. In addition, there was a significant difference in SOR scores (higher scores equal more dysfunction) between groups. Table 2 contains means, standard deviations, and results of t-test for each variable.
Table 2
Food Frequency Questionnaire: Foods Accepted by Children with ASD Compared to Typically Developing Children
ASD
n = 32
Typical
n = 16
X(SD) X(SD) t(df) p
Relationships Between SOR and Food Frequency Questionnaire
For the group as a whole (both ASD and typically developing), the child’s SOR score was
significantly correlated with the number of foods his or her parent reported that the child ate over the last month on the food frequency questionnaire, r = -.611, p < .001. As the child’s SOR score went up, the
number of foods accepted over the last month went down. Correlations for the ASD and typically developing analysis groups separately were not conducted due to power analysis from a previous study indicating that at least 41 participants would be needed in each group to detect the moderate to large effect (Suarez et al., 2012).
Exploration of Tonic EDA and Phasic EDA
The average EDA across the baseline video and food presentations phases of the protocol were compared for the ASD and the typically developing groups. The mean EDA across the entire baseline video phase for the autism group was x = 3.11, SD = 2.32, and for the typically developing group it was
x = 5.50, SD = 3.23. There was a significant difference in the mean tonic video EDA for children with ASD compared to the typically developing children, t = -2.85, p = .007. The mean EDA across the entire food presentation phase for the group of children with autism was x = 4.09, SD = 3.42 and the mean for the group of typically developing children was x = 7.60, SD = 4.14. There was a significant difference in the mean tonic food EDA for children with ASD compared to those typically developing, t = -307, p = .004.
During the laboratory food presentation phasic EDA was observed in real time for all of the participants. Of note, during this observation both the children with ASD and the typically developing children appeared to respond at different times during the food presentation process. The responses were sometimes initiated as the examiner lifted the food off of a nearby table, as he/she walked toward the participant, as the food was placed on the table, as the cover was lifted, as the food was viewed for the first time, and as the food was placed in the child’s mouth. Phasic response to food was not analyzed due to a limited number of phasic responses that occurred to food presentation in both the ASD group and the typically developing group in the 4 to10 s window after the cover was removed from the food and the participant saw the food for the first time.
Relationship Between Tonic EDA and SOR Measure
There was a significant correlation between the tonic EDA during the food presentation and SOR scale r =-.357, p = .002. As the SOR scale increased (indicative of more dysfunction) the EDA during the food presentation decreased. However, the relationship between the mean EDA over the baseline period and the SOR scale was not significant, r = -.296, p = .060.
Discussion
The findings from this study extend the literature regarding ASD and food selectivity in several ways. First, differences in food acceptance between children with ASD compared to typically
The findings of this study are in keeping with previous research findings that children with ASD eat fewer foods than their typically developing counterparts. Increased food selectivity in children with ASD has been documented in several studies (Bandini et al., 2010; Williams et al., 2005). In addition, the relationship between the number of foods accepted as part of the child’s regular diet and the symptoms of SOR is consistent with past work (Cermak et al., 2010; Suarez et al., 2012, Suarez et al., 2013).
Although EDA has been supported as a useful measure of sympathetic response to isolated, contrived stimuli in children with ASD and sensory modulation disorders (Chang et al., 2012; Hubert, Wicher, Monfardine, & Deruell, 2009; Schoen et al., 2009; Schoen et al., 2008), very few studies have used this instrumentation to examine differences in response to everyday activities like eating. This study highlights some of the challenges of using EDA in this manner. Many of the participants appeared to have a specific phasic response to the anticipation of the presentation of the food. Some responded when the research assistant picked up the plate, some when the plate was set on the table, some when the cover was removed from the food, and some when the food was placed in the mouth. Since many of the responses fell outside of the 4 to 10 s video after viewing the food, phasic EDA response to the sight of the food could not be isolated in this study. However, the more slow acting tonic activity averaged across the video and food trials provides some possible insight into the arousal level of the children during this eating activity.
The children with ASD had significantly lower average EDA over the food trial when compared to typically developing children. This may fit with the findings that SUR is the most prevalent sensory modulation pattern in children with autism (Baranek, Parham, & Bodfish, 2005; Ben-Sasson et al., 2009). Some children with ASD may experience chronic under-response to stimulus and have difficulty with quickly orienting to and responding appropriately to everyday stimuli in the environment. Since SUR was not measured in this study, this is a possibility that points to a direction for further research.
Another possibility is that children with higher SOR scores (and corresponding food selectivity) experience chronic stress in daily life due to extreme sensitivity to stimuli in the environment.
Therefore, they may experience system “shut-down” during stressful (and other) situations. This hypothesis may be supported by an “inoculation” theory where being under high levels of stress over long periods of time causes the autonomic nervous system to adapt and blunt the sympathetic nervous system response (Ruiz-Robledillo, Romero-Martinez, & Moya-Albiol, 2016). However, much is left to learn about autonomic nervous system differences in children with autism and these findings provide only preliminary information to support continued exploration. A replication of this study (with a mechanized method of food presentation to reduce anticipatory response to food) with children with only SOR, compared to children with autism and children who are typically developing, is indicated to provide more information about the differences in autonomic nervous system response to food.
Limitations
environment. In addition, this study was unable to test the relationship between SOR and food inventory items accepted separately for the ASD and typically developing groups due to a smaller than needed sample size for adequate power. However, it is noteworthy that even with the inclusion of the typically developing participants, the relationship between SOR and the number of foods accepted was still significant. Demographically, the participants in the ASD group reflected the typical distribution of children with ASD with more boys than girls. The genders of the two groups, however, differed significantly with more girls in the group of typically developing children.
Conclusions
Advances in technology that include physiological monitoring with wearable sensors provide the opportunity to acquire new understanding of the internal components of observable behavior. In
addition to replicating past work on differences in food acceptance in children with ASD and those typically developing and the relationship between SOR and food acceptance, this feasibility study may provide some insight into the use of physiological monitoring technology. In the future, occupational therapists may be able to gain insight into the internal states of clients who cannot share this information verbally through this type of technology. Clinicians may be able to quantify differences in response to sensation that are currently captured with observational or subjective report measures. This could lead to better individualization of treatment and greater treatment effectiveness.
References
American Psychiatric Association. (2013). Diagnostic and statistical manual of mental disorders. (5th ed.). Washington, D.C.: American Psychiatric Association.
Ashburner, J., Ziviani, J., & Rodger, S. (2008). Sensory processing and classroom emotional, behavioral, and educational outcomes in children with autism spectrum disorder. American Journal of Occupational Therapy, 62(5), 564-573.
http://dx.doi.org/10.5014/ajot.62.5.564
Bandini, L. G., Anderson, S. E., Curtin, C., Cermak, S., Evans, E. W., Scampini, R., . . . Must, A. (2010). Food selectivity in children with autism
spectrum disorders and typically developing children. The Journal of Pediatrics, 157(2), 259-264.
http://dx.doi.org/10.1016/j.jpeds.2010.02.013
Baranek, G. T., David, F. J., Poe, M., Stone, W., & Watson, L. R. (2006). Sensory experiences questionnaire: Discriminating response patterns in young children with autism, developmental delays, and typical development. Journal of Child Psychology and Psychiatry, 47(6), 591-601. http://dx.doi.org/10.1111/j.1469-7610.2005.01546.x
Baranek, G. T., Parham, D., & Bodfish, J. W. (2005). Sensory and motor features in autism:
Assessment and intervention. In F. R. Volkmar, R. Paul, A. Klin, & D. Cohen (Eds.), Handbook
of autism and pervasive developmental disorders (3rd ed., pp. 831-857). Hoboken, NJ: Wiley. Baranek, G. T., Watson, L. R., Boyd, B. A., Poe, M. D.,
David, F. J., & McGuire, L. (2013). Hyporesponsiveness to social and nonsocial sensory stimuli in children with autism, children with developmental delays, and typically developing children. Development and Psychopathology, 25(2),307-320.
http://dx.doi.org/10.1017/S0954579412001071 Ben-Sasson, A., Hen, L., Fluss, R., Cermak, S. A.,
Engel-Yeger, B., & Gal, E. (2009). A meta-analysis of sensory modulation symptoms in individuals with autism spectrum disorders. Journal of Autism and Developmental Disorders, 39(1), 1-11. http://dx.doi.org/10.1007/s10803-008-0593-3
Cermak, S. A., Curtin, C., & Bandini, L. G. (2010). Food selectivity and sensory sensitivity in children with autism spectrum disorders. Journal of the American Dietetic Association, 110(2),238-246. http://dx.doi.org/10.1016/j.jada.2009.10.032 Chang, M. C., Parham, D., Blanche, E. I., Schell, A.,
Chou, C., Dawson, M., & Clark, F. (2012). Autonomic and behavioral responses of children with autism to auditory stimuli. American Journal of Occupational Therapy, 66(5), 567-576. http://dx.doi.org/10.5014/ajot.2012.004242 Constantino, J. N., Davis, S. A., Todd, R. D., Schindler,
measure of autistic traits: Comparison of the Social Responsiveness Scale with the Autism Diagnostic Interview-Revised. Journal of Autism and Developmental Disorders, 33(4), 427-433. Constantino, J. N., & Gruber, C. P. (2005). Social
Responsiveness Scale. Los Angeles: Western
Psychological Services.
Dunn, W. (1999). Sensory Profile. San Antonio, TX: Pearson, PsychCorp.
Field A. E., Camargo, C. A., Taylor, C. B., Berkey, C. S., Frazier, A. L., Gillman, M. W., & Colditz, G. A. (1999). Overweight, weight concerns, and bulimic behaviors among girls and boys. Journal of the American Academy of Child and
Adolescent Psychiatry, 38(6), 754- 760. https://doi.org/10.1097/00004583-199906000-00024
Fowles, D. C. (2008). The measurement of electrodermal activity in children. In L. A. Schmidt & S. J. Segalowitz (Eds.), Developmental
psychophysiology: Theory, systems, and
methods.New York, NY: Cambridge University
Press.
Fowles, D. C., Christie, M. J., Edelberg, R., Grings, W., Lykken, D. T., & Venables, P. H. (1981). Publication recommendations for electrodermal measurements. Psychophysiology, 18(3), 232-239. http://dx.doi.org/10.1111/j.1469-8986.1981.tb03024.x
Howe, T., & Wang, T. (2013). Systematic review of interventions used in or relevant to occupational therapy for children with feeding difficulties ages birth-5 years. American Journal of Occupational Therapy, 67(4), 405-412. http://dx.doi.org/10.5014/ajot.2013.004564 Hubert, B. E., Wicker, B., Monfardini, E., & Deruelle, C.
(2009). Electrodermal reactivity to emotion processing in adults with autism spectrum disorders. Autism, 13(1), 9-19.
http://dx.doi.org/10.1177/1362361308091649 Lane, S. J., Reynolds, S., & Dumenci, L. (2012). Sensory
over-responsivity and anxiety in typically developing children and children with autism and attention deficit hyperactivity disorder: Cause or coexistence? American Journal of Occupational Therapy, 66(5),595- 603. http://dx.doi.org/10.5014/ajot.2012.004523 Liss, M., Saulnier, C., Fein, D., & Kinsbourne, M. (2006).
Sensory and attention abnormalities in autistic spectrum disorders. Autism, 10(2), 155-172. http://dx.doi.org/10.1177/1362361306062021 Little, L. M., Ausderau, K., Sideris, J., & Baranek, G. T.
(2015). Activity participation and sensory features among children with autism spectrum disorders. Journal of Autism and Developmental Disorders, 45(9), 2981-2990.
http://dx.doi.org/10.1007/s10803-015-2460-3ht
Manikam, R., & Perman, J. A. (2000). Pediatric feeding disorders. Journal of Clinical Gastroenterology, 30(1),34-46.
Miller, L. J. (2006). Sensational kids. New York, NY: Penguin Group.
Miller, L. J., Anzalone, M. E., Lane, S. J., Cermak, S. A., & Osten, E. T. (2007). Concept evolution in sensory integration: A proposed nosology for diagnosis. American Journal of Occupational Therapy, 61(2),135-140.
http://dx.doi.org/10.5014/ajot.61.2.135
Rogers, L. G., Magill-Evans, J., & Rempel, G. R. (2012). Mothers’ challenges in feeding their children with autism spectrum disorder—managing more than just picky eating. Journal of Developmental and PhysicalDisabilities, 24(1), 19-33.
http://dx.doi.org/10.1007/s10882-011-9252-2 Ruiz-Robledillo, N., Romero-Martinez, A., &
Moya-Albiol, L. (2016). Blunted electrodermal and psychological response to acute stress in
family caregivers of people with eating disorders. The Spanish Journal of Psychology, 19,1-9.
https://doi.org/10.1017/sjp.2016.24 Schoen, S. A., Miller, L. J., Brett-Green, B. A., &
Hepburn, S. L. (2008). Psychophysiology of children with autism spectrum disorder.
Research in Autism Spectrum Disorder, 2(3), 417-429.
https://doi.org/10.1016/j.rasd.2007.09.002
Schoen, S. A., Miller, L. J., Brett-Green, B. A., & Nielsen, D. M. (2009). Physiological and behavioral differences in sensory processing: A comparison of children with autism spectrum disorder and sensory modulation disorder. Frontiers in Integrative Neuroscience, 3(29), 1-11. http://dx.doi.org/10.3389/neuro.07.029.2009 Schreck, K. A., & Williams, K. (2006). Food preferences
and factors influencing food selectivity for children with autism spectrum disorders. Research in Developmental Disabilities, 27(4), 353-363.
http://dx.doi.org/10.1016/j.ridd.2005.03.005 Suarez, M. A. (2017). Laboratory food acceptance in
children with autism spectrum disorder compared with children with typical
development. American Journal of Occupational Therapy, 71(6), 1-6.
https://doi.org/10.5014/ajot.2017.022152 Suarez, M. A., Nelson, N. W., & Curtis, A. B. (2012).
Association of physiological factors, age, and sensory over-responsivity with food selectivity in children with autism spectrum disorders.
The Open Journal of Occupational Therapy,
1(1), Article 2. https://doi.org/10.15453/2168-6408.1004
associated with food selectivity in children with autism spectrum disorders. Autism, 18(8), 924-932. https://doi.org/10.1177/1362361313499457 Watling, R. L., Deitz, J., & White, O. (2001). Comparison
of sensory profile scores of young children with and without autism spectrum disorders.
American Journal of Occupational Therapy,
55(4),416-423.
http://dx.doi.org/10.5014/ajot.55.4.416
Watson, L. R., Baranek, G. T., Roberts, J. E., David, F. J., & Perryman, T. Y. (2010). Behavioral and physiological responses to child-directed speech as predictors of communication outcomes in children with autism spectrum disorders. Journal
of Speech, Language, and Hearing Research,
53(4),1052-1064. https://doi.org/10.1044/1092-4388(2009/09-0096
Williams, K., Gibbons, B. G., & Schreck, K. A. (2005). Comparing selective eaters with and without developmental disabilities. Journal of
Developmental and Physical Disabilities, 17(3), 299-309. http://dx.doi.org/10.1007/s10882-005-4387-7