R E S E A R C H
Open Access
A soft sensor for the Bayer process
Vincent Cregan
1,2*†, William T Lee
2,3†and Louise Clune
4†*Correspondence: [email protected] 1Centre de Recerca Matemàtica,
Bellaterra, Barcelona, 08193, Spain
2Mathematics Applications
Consortium for Science and Industry, University of Limerick, Limerick, Ireland
Full list of author information is available at the end of the article
†Equal contributors
Abstract
A soft sensor for measuring product quality in the Bayer process has been developed. The soft sensor uses a combination of historical process data recorded from online sensors and laboratory measurements to predict a key quality indicator, namely particle strength. Stepwise linear regression is used to select the relevant variables from a large dataset composed of monitored properties and laboratory data. The developed sensor is employed successfully by RUSAL Aughinish Alumina Ltd to predict product strength five days into the future with R-squared equal to 0.75 and to capture deviations from standard operating conditions.
MSC: 62P30; 62J05
Keywords: Bayer process; soft sensor; stepwise multiple linear regression
1 Introduction
Soft sensors (or software sensors) use mathematical or statistical models to enrich the in-formation measured by actual online sensors and offline sources such as laboratory data [–]. Soft sensors synthesise the information from physical sensors and recorded data to perform a number of tasks including the reconstruction of a field (e.g., temperature) from sample measurements and the estimation of quantities that cannot be measured directly. Another important task of soft sensors is that of process monitoring whereby the sensor detects when the process deviates from standard operating conditions. Techniques used to create the models driving soft sensors include partial least squares [], artificial neural networks [], support vector machines [], principal component analysis [], and stepwise regression [], the technique used in this study. In the past, soft sensors have been applied to several industrial crystallisation processes including paracetamol [], ammonium sul-phate [], sugar [] and terephthalic acid [].
The Bayer process is used to produce a white sandy type material called aluminium oxide (or alumina) which is a critical component in the production of aluminium. In this paper, we report the construction of a soft sensor for a critical alumina quality parameter: the strength of alumina crystal conglomerates refined from bauxite by the Bayer process. Process conditions at a particular time impact the quality of the alumina crystals five days into the future. Thus, based on a range of daily process measurements, the sensor is used to predict product quality five days in advance. Critically, the sensor is also used to forecast the amplitude and duration of a departure and return to a tolerable quality level.
The outline of this paper is as follows. In Section an overview of the Bayer process and the related industrial case study is given. Section describes the main dataset used to
construct, and validate the soft sensor. In addition, we highlight the process variables that were included in the initial model. A description of the stepwise regression algorithm used by the soft sensor is provided in Section . A comparison of the model with actual process data is presented in Section . Finally, some concluding remarks are given in Section .
2 The Bayer process and an industrial case study
RUSAL Aughinish Alumina Ltd (RAAL), located in southern Ireland, is Europe’s largest alumina refinery. RAAL use the Bayer process to extract alumina from a reddish brown ore called bauxite. Initially, the bauxite is crushed and dissolved in a sodium hydroxide-water
solution at ◦C under pressure leading to the hydrated form of alumina, alumina
trihy-drate, in solution. Undesirable insoluble bauxite impurities are filtered out of the solution. After filtration, the liquor is seeded with alumina crystals to provide nucleation sites. The first stage of precipitation is known as agglomeration, and its purpose is to provide the necessary conditions to enable the cementing together of fine seed particles to produce strong agglomerates. The liquor is then cooled which leads and crystal growth in the now supersaturated solution. The time spent in this crystallisation stage accounts for up to hours of the approximate total hour process. The high residence time in the industrial crystallisers is due to the extremely slow crystallisation rate of (i.e., linear growth rate of -μm/hour). After precipitation, the alumina trihydrate is calcined at ,◦C to remove both the free moisture and chemically bound water. In contrast to precipitation, calcina-tion is a much shorter process and is typically of the order of minutes. Finally, following calcination, the alumina crystals are stored in a silo for - days before being shipped. Crystals which do not meet the required final size are reintroduced into the precipitation stage of the process where they are used as seeds to assist future crystal growth.
A key concern of RAAL is the quality of the final product, and in particular the alumina strength which is a combination of two quality parameters, namely the alumina attrition index and the percentage of particles less than a particular threshold. The manufactur-ing process is monitored continuously by RAAL via online sensors, which leads to a large quantity of daily data measurements. RAAL also have extensive historical process and lab-oratory data. RAAL required a robust model that could forecast accurately the alumina strength exiting calcination, and predict the amplitude or duration of a departure and re-turn to a tolerable quality level. The soft sensor used to achieve the above tasks is discussed in Section .
3 Dataset
Due to the scale of RAAL’s plant and the complexity of the Bayer process, one of the ma-jor initial challenges was to decide on which process measurements should be included in the study. Ultimately, we decided on a system consisting of preliminary process
vari-ables that were selected usinga prioriknowledge of the process from RAAL technicians.
particles above and below specific size thresholds. In addition, we included several vari-ables relating to the conditions in agglomeration and the supersaturation during crystal growth. We also included one indicator (or dummy) variable to indicate significant system events (e.g., plant shutdown, equipment problem, etc.). Finally, we included six calcination variables (e.g., air flow rate, calcination rate).
The representative dataset used to construct the soft sensor consisted of daily measure-ments from months worth of plant data, which leads to approximately daily mea-surements. The data was collected using various techniques. Several process parameters (e.g., temperature and supersaturation) were measured continuously using online sensors at different points in the manufacturing process, and the daily mean was used. Variables pertaining to the particle size distribution were obtained via laboratory samples extracted from the system. Typically, samples were analysed on the day they were collected, and then used as that day’s daily value for the related variable. In some instances, two samples were taken and the average was used. Missing data was not a significant issue as only a small percentage of the data values were not recorded. Where values were not observed we simply computed the mean of the surrounding values, and treated it as the observed value for the missing data. Outliers were also not a serious problem. Where unusual values were observed they usually occurred together and across multiple variables reflecting sig-nificant upcoming system events. As RAAL were primarily interested in predicting these events, we hence did not use any statistical techniques to deal with outliers.
The algorithm uses of the daily measurements as a training set to construct and refine the model. The remaining data points are used as a test set to assess the predictive power of the resulting model.
4 Model description
The soft sensor uses an automated stepwise regression algorithm to predict quality. The algorithm systematically chooses the process predictors by using a particular selection criterion, namely the coefficient of determination (or R-squared). The algorithm is imple-mented in the numerical package Octave [], and consists of the following steps.
Firstly, the algorithm reads in the predictor data (see Section ). In the first iteration the training data is split into two parts: data from odd numbered days (, , , . . .) is used to fit the model - fitting data, and data from even numbered days (, , , . . .) is used to test the quality of the fit - testing data. The model successively adds variables to the linear re-gression model. When a new variable is added, a multiple linear rere-gression (MLR) model including that variable is calculated from the fitting data, and an R-squared value is calcu-lated from applying that model to the testing data. Once the effect of adding all potential variables has been considered the new model with the highest R-squared is compared with the previous best model. If the R-squared of the best new model is better than the
previ-ous model by a factor of + tol or higher (where tol≈–) then the variable added to
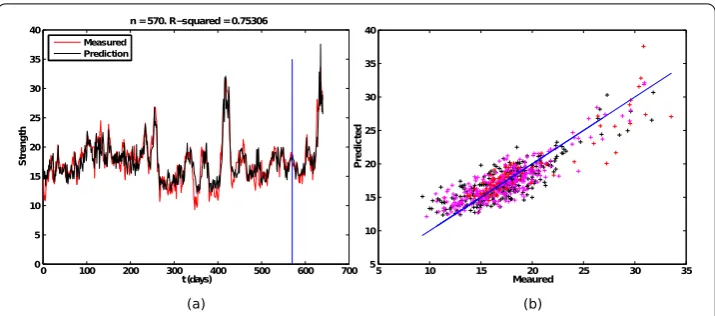
Figure 1 Model prediction. (a)Comparison of measured alumina strength exiting calcination (red line) with stepwise regression strength model (black line). The data to the left of the vertical blue line is used to construct the model. The curves to right of the blue line show the predictive power of the model.(b)Plot of measured strength against stepwise regression model, where the black, magenta and red points correspond to the training set, testing set and predicted values, respectively. Strength values are not included in graphs due to confidentiality concerns.
5 Results
The forecasting ability of the algorithm was ascertained by comparing the predicted values to the test dataset of measured plant values. Figure compares the measured alumina strength exiting calcination against the forecast of the stepwise regression model. In Fig-ure (a) the curves to the left of the vertical blue line represent the training data used to build the model, while the curves to the right of line indicate the test dataset used to as-sess the predictive power of the model. Figure (b) is the measured strength against the model for the entire dataset. The closer the red points are to the diagonal blue line, the better the model. Both figures indicate the good performance of the soft sensor model when compared to actual plant data.
After iterations of the algorithm, the final regression model contains variables. As anticipated by RAAL technicians, final product quality is strongly dependent on the crystal size distribution. Thus, the majority of variables in the model are for the percentage of particles above and below certain size limits at various stages of the manufacturing process. In particular, final quality is inversely proportional to the percentage of particles above and below certain in-house quality threshold values. Thus, if the model predicts that quality will be off specification five days into the future, RAAL can adjust conditions in precipitation accordingly. In addition to particle size, the variable to indicate significant system events was also included in the model. As expected, there was a strong positive correlation between final quality and the system event parameter. RAAL have less control over this variable. In the case of a plant shutdown, RAAL can modify their process to respond to the changes resulting from the shutdown. However, they have less control of the system for unforeseen events such as an equipment malfunction.
6 Conclusions
In this study, a soft sensor for measuring the quality of alumina at the end of the Bayer process has been developed. The soft sensor uses actual plant measurements from online sensors and laboratory data to calculate the final alumina strength. The soft sensor’s un-derlying model consists of an automated stepwise linear regression methodology to find the relevant predictor variables.
Given current process conditions, the sensor is very successful at predicting product strength five days into the future with R-squared typically of the order .. The sensor is now employed by RAAL to predict final product strength and to forecast deviations from standard operating conditions. The algorithm has superseded, and replaced, RAAL’s pre-vious statistical forecasting tool. The implementation of the model in the plant demon-strates its practicality as a soft sensor for product strength. Moreover, the algorithm can be easily modified to read in different predictors, and dependent variables, and thus has the potential to be applied to any industrial process involving a large set of predictors.
Abbreviations
RAAL: RUSAL Aughinish Alumina Ltd.; MACSI: Mathematics Applications Consortium for Science and Industry.
Competing interests
The authors declare that they have no competing interests.
Authors’ contributions
The theoretical and numerical components of the study were performed by VC and WTL. LC posed the problem, provided the data and supported the work with their expertise of the field. The initial manuscript was prepared by VC and WTL. All authors read and approved the final manuscript.
Author details
1Centre de Recerca Matemàtica, Bellaterra, Barcelona, 08193, Spain.2Mathematics Applications Consortium for Science
and Industry, University of Limerick, Limerick, Ireland.3Department of Mathematics, University of Portsmouth,
Portsmouth, United Kingdom.4RUSAL Aughinish Alumina Ltd., Askeaton, Limerick, Ireland.
Acknowledgements
VC and WTL wish to acknowledge the financial support of both RAAL and the Mathematics Applications Consortium for Science and Industry (MACSI, http://www.macsi.ul.ie) supported by a Science Foundation Ireland mathematics initiative Grant 06/MI/005 and an Embark Initiative postgraduate Award RS/2006/41.
In addition to their funding, RAAL brought the discussed problem to the attention of the authors. They supplied the process data used to generate the model and assisted the authors in developing an understanding of the process.
Publisher’s Note
Springer Nature remains neutral with regard to jurisdictional claims in published maps and institutional affiliations.
Received: 6 July 2016 Accepted: 24 April 2017
References
1. Kadlec P, Gabrys B, Strandt S. Data-driven soft sensors in the process industry. Comput Chem Eng. 2009;33:795-814. 2. Lin B, Reck B, Knudsen JKH, Jørgensen SB. A systematic approach for soft sensor development. Comput Chem Eng.
2007;31:419-25.
3. Zyngier D, Araújo OQF, Lima EL. Soft sensors with white- and black-box approaches for a wastewater treatment process. Braz J Chem Eng. 2000;17(4-7):433-40.
4. Dayal BS, MacGregor JF. Recursive exponentially weighted PLS and its applications to adaptive control and prediction. J Process Control. 1997;7(3):169-79.
5. Gonzaga JCB, Meleiro LAC, Kiang C, Filho RM. ANN-based soft-sensor for real time process monitoring and control of an industrial polymerization process. Comput Chem Eng. 2009;33:43-9.
6. Yan W, Shao H, Wang X. Soft sensing modeling based on support vector machine and Bayesian model selection. Comput Chem Eng. 2003;28:1489-98.
7. Zamprogna E, Barolo M, Seborg DE. Optimal selection of soft sensor inputs for batch distillation columns using principal component analysis. J Process Control. 2005;15:39-52.
8. Casali A, Gonzalez G, Torres F, Vallebuona G, Castelli L, Gimenez P. Particle size distribution soft-sensor for a grinding circuit. Powder Technol. 1998;99(1):15-21.
10. Abbas A, Romagnoli J. Multiscale modeling, simulation and validation of batch cooling crystallization. Sep Purif Technol. 2007;53(2):153-63.
11. Damour C, Benne M, Grondin-Perez B, Chabriat JP. Soft-sensor for industrial sugar crystallization: on-line mass of crystals, concentration and purity measurement. Control Eng Pract. 2010;18(8):839-44.