Individual level heat risk evaluation using GPS towards smart
navigation system
Takahiro Yoshida
a,∗, Yoshiki Yamagata
a, Daisuke Murakami
a, baNational Institute for Environmental Studies, Japan, [email protected], [email protected] bThe Institute of Statistical Mathematics, Japan, [email protected]
* Corresponding Author
Abstract: Urban heat risk management is an urgent issue in Japan. Although it is difficult to evaluate heat risk at spatially fine scale due to measurement data restrictions, heat risk varies depending on the location of the people. As a first step of developing smart navigation system for managing heat risk, we try to evaluate personal heat risk by combining ground surface temperature observed from an aircraft and people location acquired from mobile phones at the same time. G star statistic is used to detect high risk areas considering instantaneous co-occurrence of high temperature distribution and walking people density.
Keywords:Heat Risk, Exposure, Hazard, Vulnerability, G star statistic, Global Positioning System
1. Introduction
Due to urban heat island effect and global warming, health damages caused by heat waves are rising in the world as well as in Japan. In fact, heat strokes caused by large-scale heat waves have been reported in recent years (Rooney et al., 1998; Beniston, 2004; Le Tertre et al., 2006; Hajat et al., 2006; Clark et al., 2010; Steffen, 2014; Richardson, 2015; Klinenberg, 2015; Lemonsu et al., 2015; Mora et al., 2017; Zampieri et al., 2017; Sailor et al., 2019). Im-proving urban resilience against heat risk is an urgent task (Solecki et al., 2005; Gill et al., 2007; Milan et al.,2015). It is especially important to take measures against heat risks during the summer Olympic Games in 2020 Tokyo.
The heat waves impacts on human health, such as dehydra-tion and dysfuncdehydra-tion, become serious when people are ex-posed to heat for a long time (Rooney et al., 1998; Richard-son, 2015). So, to evaluate the heat stress of individual people, it is necessary to know not only heat intensity (i: hazard) but also how people were exposed to the heat (ii: exposure). As temperature changes greatly by location due to the surrounding surface conditions and each individual walking patters are different, it is not easy to evaluate both (i) heat hazard and (ii) exposure of each individual at the same time with conventional methods.
Regarding (i) hazard, the ground surface temperature data is useful to know heat environment in each place. In fact, ground surface temperatures reflect heating on concrete and cooling on parks/grassland more sensitively than air temperatures (Richardson, 2015). The ground surface tem-perature data observed by the satellite, such as ASTER (Advanced Spaceborne Thermal Emission and Reflection radiometer; Spatial Resolution: 90m) and MODIS (MOD-erate resolution Imaging Spectroradiometer; Spatial Reso-lution: 1km), are publicly available in these days. These data would be valuable to analyze thermal condition in a local spatial scale.
Regarding (ii) exposure, collecting and managing location
information of people has been done through mobile sens-ing in recent years. For example, Agoop Co., Ltd. (https: //www.agoop.co.jp/) provides location information logs obtained from applications of smartphones. The logs are acquired by every 30 minutes intervals or 500m to 1km moves. This Global Positioning System (GPS)’s informa-tion will be useful to know movement of individual peo-ple, which determines exposure to heat. To find an area in which people are highly exposed to heat hazard, it is necessary to consider spatial cluster of people flows.
Given these backgrounds, as the first step of developing smart navigation system to reduce heat risk of individual people, this study attempts to quantify heat stress of each people by employing ground surface temperature data and mobile sensing data. Furthermore, spatial hots spots of people’s heat stress is detected using an approach, which we will develop later, based on the G star (G∗) statistic (Getis and Ord, 1992), which is a cluster detection ap-proach, which is well-known in spatial statistics (Fischer and Getis, 2009).
The reminder of this study is as follows. Section 2 intro-ducesG∗statistic and discusses how to apply this statistic to people flow data. In Section 3, we applyG∗statistic to the analysis of heat stress. Finally, in Section 4 we show the future direction of research.
2. Methodology
2.1 G* Statistic
TheG∗statistic is a popular test statistic to detect hot spot, such as high-risk area, economically agglomerated area, and ecological community, on a geographical space (Getis and Ord, 1992). The G∗ statistic for a sample site i ∈
{1, . . . , n}is defined as follows:
G∗i = ∑n
j=1wi,jyj
∑n j=1yj
where whereyjrepresents the observation atj-th site.wi,j represents the spatial proximity between the sample sitesi
andj. The proximity can be defined by a variable indi-cating1if the distance between the sitesiandjis shorter than a threshold distance, and0otherwise. Alternatively, the proximity may be given by a distance-decay function.
TheG∗i takes a non-negative value. A largeG∗i suggests a concentration of largeyj values nearby the sitej. For example, ifyj represents ground temperatures at the site
j, the largeG∗i value means a considerably high ground temperatures nearby that site. The statistical significance can be evaluated analytically, or numerically e.g. using a bootstrap approach. See Getis and Ord (1992) for further details.
Unfortunately, the original G∗i statistic assumes samples distributed over a2-dimensional space. In other words, the statistic is not readily applicable to our GPS data (Figure 1). The next section explains how to apply it to our data.
Figure 1. Image of our people flow data
To apply the G∗ statistic to our data , we need to define the proximityWI,J between the flowIandJ. The resent spatial statistical papers such as Tao and Thill (2016) and Ermagun and Levinson (2018) have studied proximity be-tween people flows. Based on their discussions, we defined the proximityWI,J as follow:
WI,J =
1 nInJ
∑
i∈I
∑
j∈J
wI,J. (2)
In Equation (2),wi,jdenotes the spatial proximity between a GPS pointi, which is inI-th flow, and a point, which is inJ-th flow. We defined the proximity using an exponen-tial decay functionexp(−di,j), wheredi,jis the Euclidean distance separating these points. Equation (2) evaluates the proximity between flowsIandJby averaging the proxim-ities between GPS points in theI-th flow and those in the
J-th flow (see Figure 2).
Figure 2. Image of the proximity between people flowI
andJ
Spatial concentration of largeyI values can be quantified using Equation (3), which is given by substituting Equation (2) into Equation (1):
G∗I = ∑N
J=1WI,JyJ
∑n J=1yJ
. (3)
In our analysis, theG∗statistic for flow data (Equation (3)) is used to detect hot spots of people’s heat stress. The heat stress ofJ-th people is defined as
yJ =
∑
j∈J
tjδ[gj>30](gj−30), (4)
wheregj is the ground temperature at thej-th GPS point, andtjis the estimated time spent at the point, which we as-sume 0.5 (= 30 minutes),δ[•]is an indicator returning1if
•is satisfied, and0otherwise.yJquantifies how longJ-th people walk on hazardous heat areas, which are defined by areas with the mean ground temperatures being more than 30 degrees at the target period. Equation (3) indicates a large value in areas with many people being suffered from hazardous heats. That is, Equation (3) detects high risk heat areas considering individual people’s behavior. Be-cause Equation (3) is identical to the standardG∗statistic, the statistical inference for the originalG∗statistic is read-ily available.
2.2 G* Statistic for People Flow Data
The GPS data we will study is a collection of people loca-tions (2D coordinates) by 30 minutes (see Figure 1), or by 500m or 1000m of movement for moving people. We fo-cus not on individual GPS points but on flow of individual people indexed byI∈ {1, . . . , N}.I-th flow is composed of a set ofnI spatial coordinates, which we will index by
i∈ {1, . . . , nI}.
3. Results and Discussion
3.1 Approach
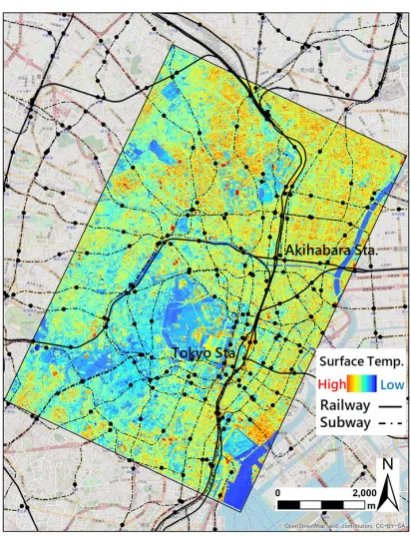
For ground surface temperatures data, we used thermal im-age observed from a helicopter (spatial resolution: 5 m; ob-servation period: 11:30–13:00, August 5, 2016; weather: sunny), which is shown in Figure 3. For a data of in-dividual people movement, we used Agoop’s “Point type floating population data”. We analyze individual level heat stress by applying the approach we developed in the previ-ous section. The target area is the center of Tokyo shown in Figure 3.
Figure 3. Surface temperature
research, we analyze only people flow tagged by walk ex-tracted by the above assumption. Refinement of the pedes-trian identification method is an important subjects in the future.
3.2 Results
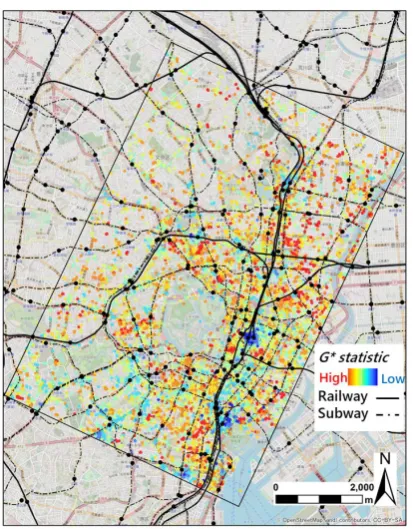
Figure 6 shows spatial clusters of pedestrians with heat stress evaluated byG∗I in Equation (3). G∗I is small in ar-eas nearby Tokyo station and Shinbashi station. The result suggests that the heat stress of pedestrians in these two ar-eas is relatively small.
As shown in Figure 3, the ground surface temperature in this two areas is relatively low. Therefore, this result is reasonable. Moreover, it is found that pedestrians with high heat stress are concentrated in near Akihabara Sta-tion, Suidobashi StaSta-tion, Jimbo-cho StaSta-tion, Hamamatsu-cho Station. This is probably because the walking distance tends to become longer in these areas where the station density is relatively low. The result suggests that consider-ing the travelconsider-ing time of pedestrians is important to prop-erly evaluate the heat stress.
4. Concluding Remarks
This study developed a new approach to detect high heat risk areas considering people exposure to heat stress us-ing people location information observed by GPS. Then, the proposed approach is tested for the city center area of Tokyo. The result suggests that locational heat stress of in-dividual people changes street by street level. This kind of GPS-based heat risk evaluation approach will be an impor-tant step to use geo-sensors towards personal navigation system which could be a very important tool for manag-ing heat risk as well as an adaptation measure to climate change.
We have to address many issues before actually test this system operationally. Firstly, we need to improve the
Figure 4. GPS data Classification results
Figure 6. EvaluatedG∗statistic
pedestrian detection accuracy. For that purpose, supervised machine learning techniques to classify actual pedestrian counts using new GPS sensors will be useful to increase the accuracy. Secondly, we need to improve the data on vulnerability of each individual people. Elders are likely to be more vulnerable to heats than young people (Gonza-lez et al., 2008; Worfork, 2000). In fact, combination of improved GPS and socioeconomic data such as age distri-bution and income are anticipated in the near future. In fact, the use of quasi-zenith satellites is expected to im-prove the precision of GPS information; the location error is expected to be at most 1 m for mobile user (Inaba et al., 2009; Hsu et al., 2016; Guo et al., 2017). Thirdly, as heat conditions change dynamically over space and time. A spatiotemporal modeling is needed to predict heat and peo-ple behaviors by using multi-scale observations and peopeo-ple sentiments data such as tweets (Yamagata et al., 2015; Mu-rakami et al., 2016).
5. Acknowledgment
We appreciate Tokyo Metropolitan Research Institute for Environmental Protection, IDEA consultants, Inc., and Skymap, Inc. for their cooperation on surface temperature measurements. This work was supported by JSPS KAK-ENHI Grant Number 17H01705.
6. References
Beniston, M (2004) The 2003 heat wave in Europe: A shape of things to come? An analysis based on Swiss climatological data and model simulations. Geophys. Res. Lett., 31(2), L02202.
Clark RT, Murphy JM, and Brown SJ (2010) Do global warming targets limit heatwave risk? Geophys. Res. Lett., 37(17), L17703.
Ermagun A and Levinson D (2018) An introduction to the network weight matrix. Geogr. Anal., 50, 76–96.
Fischer MM and Getis A (Eds.) (2009) Handbook of plied spatial analysis: software tools, methods and ap-plications. Berlin: Springer.
Getis A and Ord JK (1992) The analysis of spatial associ-ation by use of distance statistics. Geogr. Anal., 24, 189–206.
Gill SE, Handley JF, Ennos AR, and Pauleit S (2007) Adapting cities for climate change: The role of the green infrastructure. Built Environ., 33(1), 115–133. Guo F, Li X, Zhang X, and Wang J (2017) Assessment
of precise orbit and clock products for Galileo, Bei-Dou, and QZSS from IGS Multi-GNSS Experiment (MGEX). GPS solutions, 21, 279–290.
Hajat S, Armstrong N, Baccini M, Biggeri A, Bisanti L, Russo A, Paldy A, Menne B, and Kosatsky T (2006) Impact of high temperatures on mortality: Is there an added heat wave effect? Epidemiology, 17(6), 632– 638.
Hsu LT, Gu Y, and Kamijo S (2016) 3D building model-based pedestrian positioning method using GPS/GLONASS/QZSS and its reliability calculation. GPS solutions, 20, 413–428.
Inaba N, Matsumoto A, Hase H, Kogure S, Sawabe M, and Terada K (2009) Design concept of quasi zenith satel-lite system. Acta Astronaut., 65, 1068–1075.
Klinenberg E (2015) Heat Wave: A Social Autopsy of Dis-aster in Chicago. Chicago: Univ. of Chicago Press. Lemonsu A, Viguie V, Daniel M, and Masson V (2015)
Vulnerability to heat waves: Impact of urban expan-sion scenarios on urban heat island and heat stress in Paris (France). Urban Climate, 14, 586–605.
Le Tertre A, Lefranc A, Eilstein D, Declercq C, Medina S, Blanchard M, Chardon B, Fabre P, Filleul L, Jusot JF, Pascal L, Prouvost H, Cassadou S, and Ledrans M (2006) Impact of the 2003 heatwave on all-cause mortality in 9 French Cities. Epidemiology, 17(1), 75–79.
Milan BF and Creutzig F (2015) Reducing urban heat wave risk in the 21st century. Current Option Environ. Sus-tainability, 14, 221–231.
Mora C, Dousset B, Caldwell IR, Powell FE, Geronimo RC, Bielecki CR, Counsell CW, Dietrich BS, John-ston ET, Louis LV, Lucas MP, McKenzie MM, Shea AG, Tseng H, Giambelluca TW, Leon IR, Hawkins E, and Trauernicht C (2017) Global risk of deadly heat. Nature Climate Change, 7, 501506.
Murakami D, Gareth WP, Yamagata Y, and Matsui T (2016) Participatory sensing data tweets for micro-urban real-time resiliency monitoring and risk man-agement. IEEE Access, 4, 347–372.
Richardson H (2015) New world, bringing news and com-ment on the un to the uk. UNA-UK, Tech. Rep. Rooney C, McMichael AJ, Kovats RS, and Coleman MP
(1998) Excess mortality in England and Wales, and in greater London, during the 1995 heatwave. J. Epi-demiol. Commun. Health, 52(8), 482–486.
Sailor DJ, Baniassadi A, O’Lenick CR, and Wilhelmi OV (2019) The growing threat of heat disasters. Environ. Res. Lett., in press.
Solecki WD, Rosenzweig R, Parshall L, Pope G, Clark M, Cox J, and Wiencke M (2005) Mitigation of the heat island effect in urban New Jersey. Global Environ. Change B: Environ. Hazards, 6(1), 39–49.
Tao R and Thill J (2016) Spatial cluster detection in spatial flow data. Geogr. Anal., 48, 355–372.
Worfolk JB (2000) Heat waves: their impact on the health of elders. Geriatr. Nurs., 21, 70–77.
Yamagata Y, Murakami D, Gareth WP, and Matsui T (2015) A spatiotemporal analysis of participatory sensing data tweets and extreme climate events to-ward real-time urban risk management. arXiv, 1505.06188.
Yamagata Y, Murakami D, Wu Y, Yang P, Yoshida T, and Binder R (2019) Big-data analysis for carbon emis-sion reduction from cars: Towards walkable green smart community. Energy Proc., 158, 4292–4297. Zampieri M, Ceglar A, Dentener F, and Toreti A (2017)