Deguo Su
a, Beibei Tan
b,*, Debao Yuan
b, Yong Wang
a, Jiping Liu
aaChinese Academy of Surveying and Mapping, [email protected], [email protected], [email protected] b China University of Mining and Technology, [email protected], [email protected]
* Corresponding author
Abstract: With the rapid development of geographic information technology, the web-based 3D visualization technology is constantly updated with the development of computers. However, the traditional 3D geographic data visualization software based on the rich-client model it has significant limitations in the display and analysis of geospatial information and it is difficult to install and use, result in that difficult to meet the application of Geo-dynamic simulation, visual analysis, and collaborative decision-making of the geographic process. In order to show the realism of spatial data more directly, this paper introduces a 3D visualization process design method of geographic information and analyses the 3D data modelling building and visualization efficiency. The process combines multiple data sources are loaded automatically, cross platform, 2D & 3D integration, and make a wider range of customers easily access to the visualization effect of 3D spatial data.
Keywords: Geographic Information, WebGL, Three-dimension Visualization, Scheduling efficiency
1. Introduction
With the computer technology and network technology developing all the time, the visualization technology of geospatial data has changed. The changed can derive many new research directions including scientific computing visualization, information visualization, data visualization(Robert et al., 2007),knowledge visualization (Dai shuangfeng et al., 2014).Spatial location information is an important attribute information on the earth which can play a link role between phenomena and information related to people's lives. The link makes GIS develop rapidly, and its application scope has gradually penetrated into various fields of society. There are many fields that need to be displayed by GIS and visualization technology during such general trend, which promotes the common development of GIS and visualization. The combination of visualization technology and GIS technology promotes the integration of three-dimensional GIS technology with other disciplines' data and technical methods to meet the multi-dimensional and interactive needs of users, and to realize query, analysis and collaborative decision-making combined with business. It plays an important role in GIS visualization and government assistant decision-making. Traditional three-dimensional visualization technology cannot be directly implemented in browsers, and has the weak points such as needing plug-ins, time-consuming operation, poor browser compatibility, etc. (He long et al., 2015). Therefore, the realization of plug-in-free 3D scene visualization technology in web pages will be an important direction of future development. At present, three-dimensional visualization technology and WebGIS
system are developing rapidly. Meanwhile, the theory of three-dimensional visualization is gradually improving. It
has great advantages in geospatial data analysis, enabling users to understand spatial data more intuitively. WebGL is a new generation of 3D drawing standard which uses JavaScript API to present 3D graphics without browser plug-ins. Combining JS with OpenGL ES2.0, WebGL (Lei F et al., 2015) has the technical advantages of fast 3D rendering, good rendering effect, good compatibility, multi-browser support, etc. In this paper, a parallel computing method is introduced to make the three-dimensional model display smoothly in browsers.
2. WebGL-based 3D visualization of geographic
information
has comprehensive and powerful three-dimensional expression scale, formed a new unified development framework of two-dimensional and three-dimensional integration platform; SuperMap’s two-dimensional Integration (SuperMap, 2017) organically integrates GIS functions with three-dimensional visualization. Although the existing three-dimensional visualization platform of geographic information has made great progress in data visualization, it still needs to be improved in complex spatial analysis and efficient visualization.
WebGL is designed directly for the underlying graphics card end, which is more complex than the typical Web technology. Therefore, many third-party open source frameworks of WebGL have been developed, such as Three.js, Cesium.js, proeessing.js, etc. The open source frameworks not only save development costs, but also provide a development environment for developers which is more advanced and friendlier (Tony, 2013). In particular, it has two advantages, firstly, it realizes the interactive three-dimensional graphics on the Web by HTML script itself without any browser plug-in support; secondly, it uses the underlying graphics hardware acceleration function to render graphics through a unified, standard, cross-platform OpenGL interface(Liu xunfang, 2017).
For WebGL, three-dimensional visualization is to represent visualized objects in three-dimensional coordinates. The key point is to display the vertex information and the surface information composed of vertices. According to the knowledge of computer graphics after determining the point and surface, through the transformation of perspective projection matrix and model view matrix, to achieve three-dimensional visualization display. Traditional three-dimensional visualization is based on C/S architecture, when a large number of 3D model data are browsed, there will be slow loading due to the impact of network transmission speed. Through the Canvas tag in browser, 3D rendering can be accelerated directly by GPU, WebGL technology makes it possible for traditional visualization programs from C/S (Client/Server) to B/S (Browser/Server), realizing high-speed graphics rendering on the web. Users can operate on the platform as easily as browsing web pages, and provide visualization of spatial information on the server side, as well as good user multi-dimensional and interactive requirements.
3. WebGL-based 3D scene visualization process
3.1 3D model data preparation
The geographic information data involved in this paper include satellite image data and three-dimensional terrain model data. After loading the three-dimensional data into the visualization platform the ground image data of the corresponding area are loaded, in order to increase the reality of the scene. The acquisition of 3D terrain model data is complex, including texture image, height data and geometric element data which can be acquired by aerial photogrammetry, laser scanning and two-dimensional vector map conversion. After data acquisition, a special
format of 3D model can be established by modeling software (such as 3dsMax, City Engine), and then with the help of some interfaces to make the specific format of the model data converted into data structures that can be recognized by the system. The original data used in the later experiment is the three-dimensional model data in OSG format. The process of data acquisition and processing is shown in Figure 1.
3D vector data processing
3D visualization of the network side Model buiding(import
3DMax)
Data Processing(model format conversion)
Data storage
Data Source(3D model data in osg format)
osg---3ds (using Open Scene Graph)
3ds---dae (using Open collada plugin)
dae---gltf(glb) (using collada2gltf)
Figure 1. Processing of the data acquisition and conversion
3.2 WebGL visualization implementation
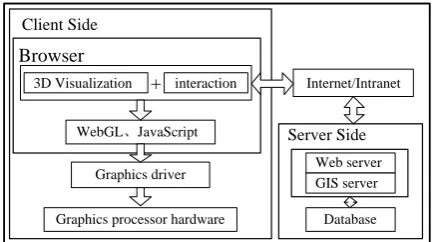
The tool adopts B/S architecture and is based on Web. Its visualization implementation process is shown in Figure 2. The basic map database is responsible for the storage of geographic information data. The GIS server is responsible for extracting relevant data from the database. By storing map tile data (Huo liang et al., 2012) and three-dimensional model data files in the working directory of the Web server, it can be prepared for client access; then the Ajax request sent by the client browser, the Web server receives and responds, and sends the requested data file to the client. The client is established by HTML and JavaScript, which is mainly responsible for parsing the data sent by the server and drawing the data through the WebGL visual interface. Then it will be displayed on the browser.
Client Side
Browser
Internet/Intranet
WebGL、JavaScript
Graphics driver
3D Visualization + interaction
Graphics processor hardware
Server Side
Web server GIS server
Database
Figure 2. The processing of visualization reality
3.3 Data scheduling efficiency analysis
client side, which makes the user appear discontinuity and lag when browsing three-dimensional scenes (Zhang fan, 2014). In order to solve this problem, we have analyzed the impact of the size of model space and the number of servers allocated on the model rendering time that consumed during the process from loading model files to displaying the model.
3.3.1 The effect of model footprint on model rendering time
Whether tile map or three-dimensional model, with the increase of data volume, the loading speed will gradually slow down. Firstly, the trend of model drawing time with the size of the model is analyzed. As shown in Figure 3, it can be seen that, with the increase of model files, the model drawing time will gradually increase, but the loading speed is generally faster; however, when loading large-scale three-dimensional scenes, data volume is still an important factor that can not be ignored. Therefore, how to solve the impact of the size of model space on loading speed is a problem that needs to be solved later.
Figure3. The effect of model size on model drawing time
3.3.2 The effect of the number of servers on the model drawing time
Model file size has an impact on model rendering time, the number of servers allocated also has an impact on model rendering time while keeping the model size unchanged (for example, 42.2MB model data), Figure 4 depicts the trend of model rendering time with the number of servers. The experimental results show that the rendering time of the model decreases slightly with the increase of the number of servers, but when the number of servers increases to a certain number, the rendering time of the model increases gradually.
Figure4. The impact of server number on model drawing time
The above two experiments show that with the increase of model size and the number of servers allocated, the rendering time of the model increases gradually, and it is obviously not suitable for large-scale three-dimensional scene loading.
3.3.3 Data scheduling optimization strategy
Based on the above two factors, this paper considers data compression and optimal server allocation for parallel rendering of the model to solve the problem of three-dimensional scene data visualization.
(1) Data compression
GLTF model includes JSON file, binary file (. bin), texture picture and shader file, while GLB (Graphic Library Binary) is a binary file of GLTF, which takes less space to store the same data. The size of gltf and GLB models is compared below. Figure 5 depicts this trend visually.
Figure5. The comparison of model size
The experimental results show that compared with gltf, GLB occupies less space in the same model, and the data is compressed in format conversion. Moreover, with the increase of gltf model, the compression effect is more obvious. Therefore, compared with gltf, GLB can improve the rendering efficiency of the model.
(2) Parallel Computing Algorithms
Several servers are organized into a parallel computer network, which divides the model data into several parts, assigns them to each server for parallel processing, and finally merges the rendering results. In this experiment, ten models of different sizes (ten models occupy more space in turn) are taken as examples, while in the same model, different number of servers are allocated to draw 0
1 2 3 4 5
0 5000 10000 15000 20000
Draw
in
g
tim
e/s
model size/KB
0 2 4 6 8 10 12 14
0 3 6 9 12 15
Draw
in
g
tim
e/s
Number of servers / station
0 2 4 6 8 10 12 14 16 18
Mo
d
el
siz
e/MB
them in parallel. Figure 6 depicts this trend. The experimental results show that when the model is small, the advantage of parallel computing is not obvious. On the contrary, the rendering time of the model increases because of the need to merge the results. But when the size of the model increases gradually, the rendering time of the model decreases gradually with the increase of the number of servers. Therefore, for models of different sizes, having an optimal number of servers can improve the efficiency of model rendering.
Figure6. The comparison of model drawing time
Two data scheduling strategies based on data compression and computer parallel computing can alleviate the pressure of data transmission and rendering, and improve the visualization efficiency.
4. Experimental results and analysis
4.1 lab environment
In order to develop and run the visualization platform normally, especially the drawing and rendering of two-dimensional and three-dimensional graphics, the computer hardware must meet the minimum requirements of WebGL graphics development environment. The experimental environment is shown in Table 1.
parameter name Parameter value
CPU intel CORE i5
operating system Windows7
Javascript runtime environment node.js
Web server IIS
Browser IE11 or above,
Chrome, Firefox, etc. Tab.1 Experimental Environment
4.2 Visualization effect
The three-dimensional visualization of geographic information data is presented in the virtual three-dimensional earth environment. Firstly, the map data is read into the visualization platform, and then the three-dimensional model data is loaded into the corresponding
geographical location to realize two-dimensional and three-dimensional integration, and icons can be labeled to make the data more readable.
This experiment transforms the existing OSG format three-dimensional model data into database according to the conversion process of figure 2, and draws the model quickly through the client. Figure 7 shows the three-dimensional visualization effect of the area.
Figure7. Three-dimension Visualization
4.3 Conclusion
This paper designs and implements the function of using WebGL technology as a visualization engine to realize plug-in-free three-dimensional visualization of geographic information on Web browser. It also analyses the problem that data can not be dispatched quickly because of the large space occupied by model data and the limitation of network bandwidth. We adopt the strategy of data compression by transforming data format and applying the idea of computer parallel computing to achieve efficient rendering of model data and the data visualization efficiency based on WebGL is improved. However, how to dynamically load and efficiently schedule large-scale 3D scenes without affecting user interaction fluency remains to be further studied. At present, the concept of 3D Tiles has emerged, which provides a new idea for later research.
5. Acknowledgements
This research was supported by the National Natural Science Foundation of China(No.41671456) and the Fundamental Research Funds (No.7771528) as well as the Fundamental Research Funds of the Chinese Academy of Surveying and Mapping Science.
6. References
Robert P. W. Duin and Elż, Pekalska B. (2007). The Science of Pattern Recognition. Achievements and Perspectives. In Challenges for Computational Intelligence, Studies In Computational Intelligence Series. Springer Berlin Heidelberg,2007.
DAI Shuangfeng, DONG Jiyang, XUE Jian. (2014). Visualization analysis and application of large data in scientific computing.Journal of Engineering Studies,2014.
HE Long, DU Peng.(20015).Research on 3D visualization based on WebGL.Science & Technology information, 2015.
0 2 4 6 8 10 12 14 16 18 20
Draw
in
g
tim
e/
S
one server two server
Lei F,Chaoliang W,Chuanrong L. (2011). “A Research for 3D WebGIS based on WebGL”,Computer Science and Network Technology(ICCSNT).Harbin,China. 2011. GAO Yuncheng. (2014). Research of implementation
technique of cesium-based WebGIS 3D client. Xian:Xidian University,2014.
EV-Global three-dimensional spatial information software.(2017).http://www.evimage.Com/products/l38 52968750166. html.
The integration of Supermap two and three-dimensional.(2017).http://www.supermap. com/cn/. Tony Parisi. (2013)WebGL starter guide.Beijing: Posts &
Telecom Press,2013.
LIU Xunfang. (2017). Research on Tunnel Dynamic Construction Monitoring Information System Based on BIM and WEB.Dalian:Dalian Maritime University, 2017.
HUO Liang, YANG Yaodong, LIU Xiaoyong, et al. (2012) .The research and practice of tile pyramid model technology.Science of Surveying and Mapping, 2012. ZHANG Fan. (2014). “Research on WebGL-Based