Problems of Harmony in the Development of Socio-Economic Systems
Romualdas Ginevicius
Vilnius Gediminas Technical University
Sauletekio av. 11, LT-10223, Vilnius, Lithuania E-mail. [email protected]
http://dx.doi.org/10.5755/j01.ee.30.2.22869
A sustainable development (SD) concept formulated 30 years ago has been, and will be, one of the most topical issues in the development of mankind. The fundamental question of this phenomenon is the quantification of the condition. There is no unified approach yet, despite numerous studies of all kinds. All proposed methods assess not sustainable development but rather the development of its individual components (economic, social, environmental) or socioeconomic systems (SES).In order to achieve an adequate quantification of SES SD, two aspects of this process should be distinguished: quantitative and qualitative. The quantitative side is the order (dynamics) of the development of the socioeconomic system, which can be expressed in the degree and intensity of development. The qualitative side is the coherence of the development of SES as a complex system. Socioeconomic systems belong to large, complex systems with the structure as an essential characteristic, which is the basis for their stability. It is the harmony of development that reflects the coherence between structural changes in development and internal development processes. The complex quantification of SES in sustainable development integrates both sides of this process - quantitative and qualitative, i.e. sustainability and harmony.
Keywords: Development of Socioeconomic Systems; Sustainable Development; Development Coherence; Complex Quantitative Assessment of Sustainability.
Introduction
Sustainable Development (SD) today is one of the significant challenges we are trying to address both from a scientific and a practical point of view. It is analysed by individual scientists, their collectives and economic entities at the industrial, national, regional and international level or scale. This is not done accidentally. For a long time, there has been a belief that a growing economy and growing production are the basis of public welfare. Over time, humanity’s activity has resulted in an ecological crisis. It was understood that the time to decide on the direction of society’s development in the future had come. This perception has contributed to the concept of sustainable development. For the first time, it was mentioned in 1987 in the United Nations Environmental Development Commission (WCED) report "Our Common Future". It formulates the concept of sustainable development: a development that meets the current needs of society without compromising the ability of future generations to meet their own (WCED, 1987). The report emphasises that the environment and development are inseparable and should be addressed and considered as a single problem.
Following the publication of this report, sustainable development ideas began to spread rapidly worldwide. At the 1992 World Summit of Rio de Janeiro, sustainable development was legitimised as a critical long-term ideology for human development. This has been driven by a global trend: a growing population must use limited, non-renewable resources to satisfy their needs. World scientists warn: the global catastrophe is coming, which is already manifested in these threatening aspects like biodiversity eroding due to deforestation and pollution, the emerging lack of fresh water, the emergence of ‘dead zones’ in the oceans.
The number of people in the world has increased by 35 %, the number of mammals, reptiles, birds and fish - by 29 %; at the same time nearly 300 million acres of forests were destroyed. Freshwater per capita decreased by 26 %, and the area of ‘dead zones’ increased by 75 % in the oceans. The ozone layer is thinned by chemicals and burned coal. As a result, the concentration of carbon dioxide in the atmosphere has increased significantly. This has triggered the ‘greenhouse effect’ that causes the glaciers to melt, and the average temperature of the earth to rise.
The concept of sustainable development is a desire and a way to stop these negative trends. The concept of sustainable development is based on three similar components - environmental, economic and social. At the United Nations Summit in Johannesburg in 2002, it was emphasised that changes in production and consumption patterns are crucial for sustainable development.
All entities involved in production, service, consumption and similar processes are part of socioeconomic systems, i.e. social systems into which material, technical and informational resources are integrated. In order to sustainably harmonise their development, they need to be aware of both the current state and the development process. This allows controlling their changes in a targeted manner. The problems under consideration, in the context of sustainable development, would be the goal of sustainable development of SES.
not to diminish the ability of future generations to meet their own needs. These two essential aspects are interlinked in the sense that one must always think not just about today, but also the future. The concern for the future lies mainly in environmental protection - non-renewable resources need to be used sparingly, without polluting nature.
What are the conditions for dealing with both issues? In order to meet the needs of current society, the economy must develop. This will create the necessary conditions for people’s well-being today. In order to maintain the future generations’ ability to meet their own needs, today’s economy shall not develop at the expense of the environment. There is only one way to solve this uncertainty, namely to combine economic, social and environmental protection development.
All in all, to fully assess the SD, both sides need to be taken into account: the dynamics of development, which is necessary to meet the current needs of society, and the nature of this dynamics, i.e. the extent to which all three components of sustainability are harmonised. The conditions for future generations to meet their needs must be ensured at the same time.
Review of Existing Methods of Evaluation of Socio-Economic Systems Development
An essential condition for the existence of SES is a continuous development. This is its characteristic feature, while these systems are open and subject to continually changing environmental conditions. To be able to adapt to such a dynamic situation, the system must develop its parameters to survive. What is more, in order to function successfully in a dynamic environment, positive changes in SES must be faster than changes in the surrounding environment.
The process of socioeconomic systems development is the change of states of successive factors related to causal relations. Specific internal changes accompany it. In particular, the state of the essential components of SES - economic, social and environmental - is progressively changing. These changes reflect the quantitative side of system development.
SES belongs to complicated, complex systems. Their essential feature is the structure, i.e. the relations of the parts of the system, their interrelations. They are the basis for its stability as a derivative.
Quantitative changes in SES components influence these relationships, i.e. they can change and distort (improve or degrade) the state of sustainable development. Therefore, it can be said that structural changes reflect the qualitative side of SES development.
Following this concept of the SES development process, it is appropriate to carry out an overview of currently available and proposed SD quantitative assessment methods. Two fundamental aspects can be distinguished in the extensive research on sustainable development. Firstly, the possibility of a universal, globally accepted indicator of SD is discussed; secondly, the sustainable development indicators reflecting the development of SES in various respects are proposed. The variety of suggestions shows that research needs to be continued in this direction.
Evaluation of Individual Components of Socio-Economic Systems Development
Most of the indicators or indices associated with the SD phenomenon reflect individual aspects of the SES development process that are narrower or broader. This is probably due to the notion that no SD measure encompasses everything expressed in the SD term. Alternative definitions of sustainable development have naturally led to alternative indicators or their systems. That is why it is the way that each of the three (or more) SD components - economic, social and environmental - aims to select and match a certain number of indicators. Thus, more than 500 models are counted in the world: about 70 global, more than 100 national, more than 70 regional and about 300 local ones (Parris & Kates, 2003; Ciegis et al., 2010; Bilan et al., 2019).
Fundamentally, all indicators assessing individual aspects of SES development are intertwined with the environmental context. The development of such indices is based on the OECD (OECD 2001) or the further developed UNSTAT model. It includes 72 indexes (Scherp, 1994). There are three levels of index creation. The first includes criteria for the impact of human activity on the environment, the second for environmental indices (e.g. CO2 in the
atmosphere); level three indices reflect the public response to the state of the environment.
EUROSTAT has developed a system of indexes of human impact on nature. It consists of 60 indicators, broken down into six domains for each area, based on the EU Fifth Environmental Protection Program. It claims that the indexes provide a comprehensive set of indicators for measuring sustainable environmental sustainability in the EU member states. It is also stated that in this way it is possible to compare the ecological situation of the countries (Rotmans, 2006; Ciegis et al., 2010). The question arises as to how such ranking can be done, if some countries have some better indicators, while other countries have others.
Another proposed set of indicators is to describe the total area of productive land and aquatic ecosystems that are necessary to meet the needs of the population and absorb emerging pollution (Rees, 2000; Wackernagel & Rees, 1996; Wackernagel et al., 1997; Wackernagel et al., 2004; Ciegis et al., 2010; Rees, 1992).
Part of the indexes is for the number of natural resources and the capacity to absorb environmental pollution, which is necessary to meet the needs of today's humanity without reducing these opportunities for future generations (Ciegis et al., 2010; Spangenberg, 1995; McLaren et al., 1998).
In order to cover all components of the SES development, the abundant indicators reflecting them are systematised, and hierarchical structures of level 3-4 are formed (Spangenberg
et al., 2002; DiSano, 2002; FAO, 2013). There are ways to find one SES reflective indicator based on such structures (Ginevicius, 2009).
Today, countries around the world are using the most diverse index systems trying to measure sustainable development. In Germany there are 218, in France - 307, in Denmark - 90, in Portugal - 132, in Finland - 88, in Switzerland - 120 (Ciegis et al., 2010). These indices are distributed almost equally between the three components of the SD - economic, social and environmental protection.
In sum, it can be said that the discussed SD indicator systems do not cover the components of economic, social and environmental protection development to the required extent. Also, they are not integrated. The second key finding is that all these indicators or indices, although called sustainable development measures, primarily reflect the state of development of the analysed SES at the moment in time, rather than sustainability.
Integrated Assessment of Sustainable Development of Socio-Economic Systems
Studies suggesting that neither a universally acceptable indicator nor a set of indicators applicable for all cases can be defined refer the reasons for this opinion, as follows (Ciegis et al., 2010; Nastiti et al., 2019; Abdi et al., 2018):
- the ambiguity of SD understanding and the conception of this phenomenon emphasise other aspects;
- an abundance of measurement objectives resulting from alternative definitions of SD;
- confusion of measurement methods, and so on.
For these reasons, it is considered that each such proposed index has its strengths as well as its weaknesses. The question is, what are the strengths and weaknesses of such indicators?
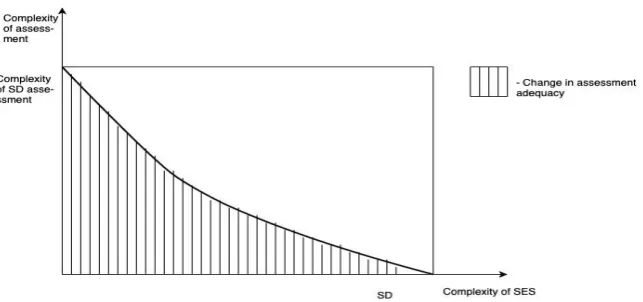
Development, its condition, can be reflected in indicators and indices. The latter is obtained by appropriately combining a group of indicators. When one or more indices are merged into one size, we will get a higher level index and so on. Thus, different levels of indexes differ in the degree of aggregation. The need for different levels of indexes arises from the need for adequate reflection of the phenomenon in question (NR). The more complex this phenomenon (NR), the higher the number of aspects it has in reality, the more indicators it reflects. To adequately quantify the state of such NRs, this abundance of indicators needs to be combined into indices that reflect individual NRs (economic, social and environmental protection in the case of SES SD), and combine these indices into a generic size that reflects the overall status of NR. If the complexity of such an index does not match (is less) the complexity of NR, it cannot adequately reflect this phenomenon. The more complexity of the SD assessment indices corresponds to the complexity of this development process, the more adequate they are, and vice versa, the more complexity of the indexes does not correspond to the complexity of NR, the more inadequate they are, and it is their weakness (Figure 1).
Figure 1 shows that we have the most significant complexity of SES development when it comes to assessing its SD. We will have the most significant evaluation adequacy when some index reflects primary information (e.g. CO2 emissions into the atmosphere over time) when the
complexity of the situation under assessment will be 0.
Figure 1. The Relation between the Complexity of the Socioeconomic System and the Assessment of its State
(Source: compiled by the author)
The adequacy or inadequacy of indexes depends on the number of indicators that these indices combine. However, in this case, they cannot describe the complex phenomenon completely. Their number should provide a detailed description of it, but not more extensive than is necessary to reveal the essence of the phenomenon (Ciegis et al.,
2010).
The complex assessment of SES on sustainable development raises two fundamental problems: quantification of the development of its components - economic, social and environmental protection, as well as
the formation of an index, aggregated to reflect the overall development of the SES.
regularities. Because of this kind of analysis, one can understand the principles of sustainable functioning systems embedded in nature. All artificial systems, including socioeconomic, conscious or unconscious, are trying to build upon them. The bigger the scale, the more effective the artificial system is.
The perfect biological system is a human being. To live, grow and develop, he needs three essential components - air, water and food. Without them, he will not survive as a system. On a larger or lesser scale, all people get them.. However, we see a lot of ill, gaunt, exhausted, or version the contrary, obese, prematurely raddled people, both children and adults. Why is that? Their body probably did not get enough water; maybe they were exposed to highly polluted air or eating too little or too much food.
What conclusions can be drawn from this in terms of SES development? According to the current logic, if we combine all three SD components into one index, we automatically have the system SD. Indeed, we get the SES development status complex assessment index. On the other hand, it may not be otherwise. If at least one of the three components - economic, social or environmental protection does not develop, the system will fail (like a
person without air, water or food). The only question is whether the positive changes of these components were sufficient and whether they developed harmoniously, i.e. whether one component did not develop at the expense of others. It is here that the quantitative and qualitative aspects of the SES development process follow.
It is now possible to get back to today’s SD evaluation indicators. Indices that reflect the state of economic, social and environmental protection development at the time in question do not reflect the dynamics of this development, are not responsible for the question of what the development trend was - whether it was intensive or insignificant, or maybe there was a downturn instead of development. These evaluations do not answer the other question, namely whether the expansion was intense, whether it took place steadily, without significant fluctuations in the particular periods under review. Meanwhile, evaluation at regular intervals can highlight trends in different periods (Ciegis et al., 2010).
This idea is clearly illustrated by the changes in the GDP of some EU member states. The indicator can be accepted as an indicator of their economic development (Table 1).
Table 1
GDP per Capita, EUR, in Certain European Countries
Country Year
2009 2010 2011 2012 2013 2014 2015 2016 2017
12 EU countries 28.6 29.3 29.9 30.0 30.2 30.8 31.7 32.4 33,6
Greece 21.4 20.3 18.6 17.3 16.5 16.4 16.3 16.2 16,7
Romiania 6,1 6,2 6,5 6,6 7,2 7,6 8,1 8,6 9,6
Italy 26.4 26.8 27.3 26.7 26.5 26.7 27.2 27.7 28,5
Switzerland 50.2 56.1 63.7 65.0 64.1 65.3 73.9 72.2 72,6
(Source: compiled by the author based on Eurostat data)
0 10 20 30 40 50 60 70 80
2009 2010 2011 2012 2013 2014 2015 2016 2017
12 EU countries Romania Greece Italy Switzerland
Figure 2. GDP per Capita (EUR) in Certain European Countries
(Source: compiled by the author based on Eurostat data)
Table 1, Figure 2 show that the nature of the national economic development varies widely. The 12 EU member states and Romania are characterised as stable, but not particularly intense; Italy - as very stable, but not very intensive; Switzerland – as a very intensive but unstable development. A stable fall is seen in Greece. Another difference that is significant for these countries is the level of development achieved. For example, it varies 8.4 times between Switzerland and Romania.
This fact is also proven by the inaccuracy of the existing SD assessment indicators. There are countries where the GDP per capita is continuously and steadily rising at the expense of the export of non-renewable natural resources (oil, gas, wood and so on). It is hardly possible to attribute such a situation to SD.
SES - compatibility or coherence. There are three essential things in harmony. First, the economic development of the SES cannot take place at the expense of the social sphere and the environment. Secondly, social development cannot take place at the expense of economic development and environmental protection. Thirdly, environmental protection
cannot overshadow economic and social development (Wilkinson et al., 2004). Combining the three SD components into one size does not consider these SD aspects. Thus, there are various cases of harmony between the dynamics of SES development and its components (Figure 3).
S
us
ta
ina
b
il
it
y
o
f
de
ve
lop
m
ent
Sustainability of coherence
unsustainable sustainable
uns
u
st
ai
n
ab
le
Unsustainably incoherent Sustainably incoherent
sus
ta
ina
b
le
Unsustainably coherent Sustainably coherent (SD)
Figure 3. Sustainability-Coherence Matrix of SES Development
Table 1 and Figure 3 demonstrate that only one of the four SES development scenarios corresponds to SD. Figure 3 also shows that, in order to achieve a comprehensive SD assessment, the development process parameters - dynamics (sustainability), compatibility and intensity - must be taken into account, reflecting the quantifiable development side of SES and the coherence that reflects the qualitative side of SES development. Before doing this, it is necessary to show the fundamental differences between these concepts, especially between dynamics and compatibility.
First and foremost, one must admit that they are unequal and depend on the context. It is expedient to apply the quality label of coherence when it comes to emphasising the coordinated development of SES and the
label of sustainability when we talk about constant, unbroken and stable development.
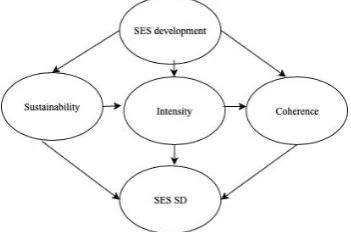
Combining two aspects of SES SD - sustainability and coherence into a single development category will only make sense if they lead to one another. This question can be answered in the affirmative, as the sustainable developmental resources of the SES creates conditions to reach for its coherence and vice versa, coherence in return creates conditions for sustainable development. In other words, there can be no sustainability without coherence, and without coherence, it cannot be sustainable. This process can be represented by SD rhombus (Figure 4). The intensity of SES development can be seen as a common denominator for SD.
Figure 4. SD Rhombus of Socio-Economic Systems (Source: compiled by the author)
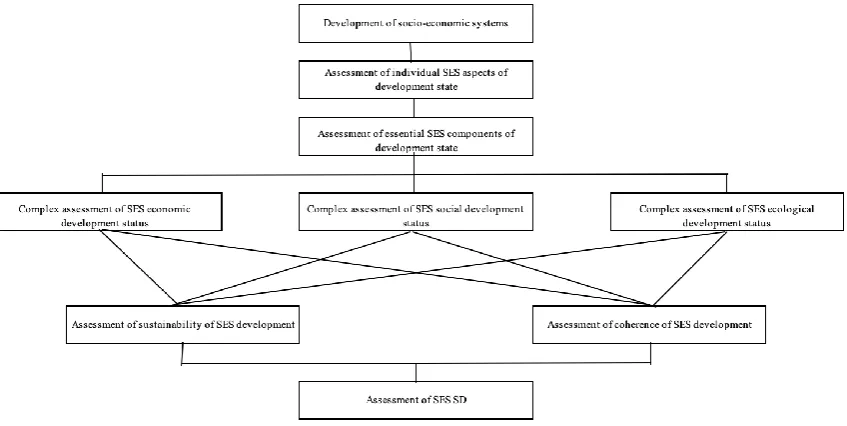
The SES SD assessment cannot be done without percieving the current state of development. The options for determining were discussed earlier. Recently, multi-criteria methods have been widely used for this (Ginevicius et al., 2018 a, b; Keshavarz, 2015; Debnath et al., 2018; Ginevicius et al., 2018b; Ginevicius, 2009). In this way, two stages of SES development SD assessment can be identified. The first is to assess the current state of its development; the second one is sustainability and coherence. Adequate SES SD indicator will be received in
the third stage, when both of these aspects are combined into a single aggregate value, taking into account the intensity of development of the SES (Figure 6).
Figure 5. Existing SES SD Evaluation Scheme (Source: compiled by the author)
Figure 6. Proposed SES SD Evaluation Scheme (Source: compiled by the author)
As shown in Figures 5 and 6, the first step in the assessment of SES SD does not differ, as in both cases a complex assessment of the state of development of the core components of the SES is carried out. According to the current order, the evaluation of SD ends with the value of the complex assessment of the state of development of SES is the value of the system SD. Apart from the fact that this value reflects SES SD, in the second stage, it is necessary to evaluate the sustainability and coherence of the development and to combine them into one summarising size.
For the analysis of the SD phenomenon, it is vital to overcome the obstacles to the unified, universal absence of the SD index indicated by some authors - the ambiguity of SD understanding, the range of measurement objectives, the confusion of measurement methods, and so on. (Ciegis
et al., 2010).
First of all, we need to answer the question whether the number of SD components can be acceptable to everyone. The three-pillar theory proposed by Elkington in 1998 answers it (the triple bottom line – TBL) (Elkington,
1998). Until today, it is the framework conditions under which the results of SES development can be measured. This theory suggests that SES measure three key parameters - social, economic and environmental. It convenes with the global perception of SES SD, which is also based on the same three equivalent components (Ciegis et al., 2010). They are practically common to all SES. Also, other typical features of such systems can be seen. It is the inherent characteristic of change (development), the necessity of the overall compatibility of this process, the fluctuations of development, and so on. The presence of such universal SES development features also enables the presence of a universal SD indicator.
1. Today, there are many different complexity indices in the world, indices that evaluate the development of SES in various aspects, but do not evaluate it in the whole, and the evaluation of SES SD is performed non-systematically. This makes it impossible to compare the same level of CES between economic operators, cities, regions, countries, their groups and so on.
2. Failure to evaluate the overall SD makes it difficult to purposefully manage the SES development process, especially its internal coherence. This complicates reaching the SD goals.
3. The existence of a large number of SD evaluation systems demonstrates their limitations, complexity and inadequacy.
The logic of research leads to the need for a unified SD indicator. This is evidenced by the emerging attempts to do so (Ciegis et al., 2010), i.e. attempts to combine all three components of SES development - economic, social and environmental protection – into a single synthesis.
On the other hand, it cannot be accepted that such an index reflects SD. In essence, this is an indicator of the complex assessment of the state of development of the SES.
Conclusions
Summarising the current situation of quantitative assessment of the development of socioeconomic systems, the following fundamental conclusions can be drawn.
1. All the methods proposed for the evaluation of SES development can be divided into three groups or levels. At
the first level, individual indicators of the economic, social and environmental development of the SES are assessed with relevant indicators. On the second level, these indicators are combined into indices that measure the main components of SD - economic, social and environmental protection at various degrees of complexity. On the third level, these evaluations are combined into a single development complex indicator.
2. The proposed methods do not make it possible to judge the nature of the SES development, both in terms of its intensity and uniformity, and whether the development of the essential components of SD has been harmonised. Essentially, this is an indicator of the complex assessment of the state of development of SES. This implies that the immediate tasks of the SES SD study are a structured approach to the SES development process, distinguishing between two sides - quantitative (development intensity and uniformity) and qualitative (compatibility of essential SES components development). To enable the complex SD assessment, it is necessary to propose methodologies for quantifying and combining these two aspects into a single summative.
3. The necessity of a single SES SD assessment indicator is generated by the fact that, without first assessing the SD in general, it is not possible to systematically manage the development process, which makes it difficult to achieve the goals set; secondly, it is impossible to compare between different economic operators, cities, regions, countries, etc. of SES.
References
Abdi, K., Mardani, A., Senin, A., Tupenaite, L., Naimaviciene, J., Kanapeckiene, L., & Kutut, V. (2018). The effect of knowledge management, organizational culture and organizational learning on innovation in automotive industry.
Journal of Business Economics and Management, 19(1), 1–19. https://doi.org/10.3846/jbem.2018.1477.
Bilan, Y., Vasilyeva, T., Lyeonov, S., & Bagmet, K. (2019). Institutional complementarity for social and economic development. Business: Theory and Practice, 20, 103–115. https://doi.org/10.3846/btp.2019.10.
Burinskiene, M. (2003). Subalansuota miestu pletra. Vilnius: Technika.
Ciegis, R., Ramanauskiene, J., & Simanskiene, L. (2010). Lietuvos regionu darnaus vystymosi vertinimas. Klaipeda: Klaipedos universiteto leidykla.
Debnath, A., Bandyopadhyay, A., Roy, J., & Kar, S. (2018). Game theory based multi criteria decision making problem under uncertainty: a case study on Indian Tea Industry. Journal of Business Economics and Management, 19(1), 154–175. https://doi.org/10.3846/16111699.2017.1401553
DiSano, J. (2002). Indicators of sustainable development: guidelines and methodologies. New York: United Nations. S315. Elkington, J. (1998). Cannibals with forks: the tripple bottom line of 21st century business. Gabriola Island, BC Canada:
New Society Publishers. https://doi.org/10.1002/tqem.3310080106 FAO. (2013). SAFA guidelines. Rome: FAO. S267.
Ginevicius, R. (2009). Some problems of quantitative evaluations of the state sociale-economic systems. Business: theory and practice 10(2), 69–83. https://doi.org/10.3846/1648-0627.2009.10.69-83
Ginevicius, R., Gedvilaite, D., & Stasiukynas, A. (2018a). Impact of economic development on the ecology in the regions of Lithuania. Economics and Management, 21(2), 21–37. https://doi.org/10.15240/tul/001/2018-2-002
Ginevicius, R., Gedvilaite, D., Stasiukynas, A., & Cepel, M. (2018b). Integrated assessment of the socioeconomic systems' development. Economics and sociology, 11(1), 11–21. https://doi.org/10.14254/2071-789X.2018/11-1/1
Keshavarz, K. M., Zavadskas. E. K., Olfat, L., &Turskis, Z. (2015). Multi-Criteria Inventory Classification Using a New Method of Evaluation Based on Distance from Average Solution (EDAS). Informatica, 26(3), 435–451. https://doi.org/10.15388/Informatica.2015.57
McLaren, D., Bullock, S. & Yousef, N. (1998). Tommorow's world: Britain's share in a sustainable future, London. Nastiti, P. K. Y., Atahau, A. D. R., & Supramono, S. (2019). Working capital management and its influence on profitability
and sustainable growth. Business: Theory and Practice, 20, 61–68. https://doi.org/10.3846/btp.2019.06. OECD. (2001). OECD environmental indicators. Towards sustainable development. Paris.
Parris, T. M., & Kates, R. W. (2003). Characterizing and measuring sustainable development. Annual Review of Environment and Resources, 28(13), 1–28. https://doi.org/10.1146/annurev.energy.28.050302.105551
Piorr, A., Ungaro, F., Ciancaglini, A., Happe, K., Sahrbacher, A., Sattler, C., & Zander, P. 2009. Integrated assessment of future CAP policies: land use changes, spatial patterns and targeting. Environmental Science & Policy, 12(8), 1122– 1136. https://doi.org/10.1016/j.envsci.2009.01.001
Rees, W. E. (1992). Ecological Footprints and appropriated carrying capacity: what urban economies leaves out.
Environment and Urbanization, 4, 121–130. https://doi.org/10.1177/095624789200400212
Rees, W. E. (2000). Eco-footprint analysis: merits and brickbats. Ecological Economics, 32(3), 371–374. https://doi.org/10.1016/S0921-8009(99)00157-3
Rotmans, J. (2006). Tools for Integrated sustainability assessment: a tow track approach. The integrated Assessment JournalBridging Sciences & Policy, 6(4), 35–57.
Scherp, J. (1994). What does an economist need to know about the environment? Directorate-General for Economic and Financial Affairs. Economic papers of the European Commision. No. 107.
Spangenberg, J. H. (1995). Towards sustainable Europe. A study from the Wuppertal Institute for Friends of the Earth Europe, London.
Spangenberg, J. H., Pfahl, S., & Geller, K. (2002). Institutional sustainability indicators; the analysis of the institutions in Agenda 21 and a draft set of indicators for monitoring their effectivity, Sustainable development 10(2), 103–115. https://doi.org/10.1002/sd.184
Volkov, A. (2018). Assessment of the impact of the common agricultural policy direct payments system on agricultural sustainability. Doctoral Dissertation. Vilnius.
Wackernagel, M., & Rees, W. E. (1996). Ecological Footprints and Appropriated Carrying Capacity: Measuring the Natural Capital Requirements of the Human Economy. Focus 6.
Wackernagel, M., Onisto, L., & Bello, P. (1997). Ecological Footprints on Nations. Xalapa, Mexico.
Wackernagel, M., White, K., & Moran, D. (2004). Using ecological footprint accounts: from analysis to applications.
International Journal of Environment and Sustainable Development, 3/4, 293–315. https://doi.org/10.1504/IJ ESD.2004.005077
WCED. (1987). Available from internet: http://www.un-documents.net/our-common-future.pdf.
Wilkinson, D., Fergusson, M., Bowyer, C., Brown, J., Ladefoged, A., Maonkhouse, C. & Zdanowicz, A. (2004). Sustainable development in the European Commission's integrated Impact Assessments for 2003. London: Institute for Environmental Policy.