Vol.8 (2018) No. 5
ISSN: 2088-5334
Characteristics of Soil Suction with Filter Paper Test Method
Yulindasari Sutejo
#, Anis Saggaff
#, Wiwik Rahayu
*, Hanafiah
##
Civil Engineering Department, Faculty of Engineering, Universitas Sriwijaya, Inderalaya, 30139, Indonesia E-mail: [email protected], [email protected] (corresponding author), [email protected]
*Civil Engineering Department, Faculty of Engineering, Universitas Indonesia, Depok, Indonesia E-mail: [email protected]
Abstract—Soil suction is the ability of the soil to absorb water. Type of soil in this research was peat soil and clay soil. The soil samples
had been used were taken from Village III Banyu Urip, Banyuasin Regency, South Sumatera Province. Laboratory testing with Filter Paper test method. The filter paper used is Whatman Filter Paper No.42. The Scanning Electron Microscope (SEM) had been used to analyze the orientation of fiber content. Energy Dispersive Spectroscopy (EDS) also to analyze the chemical elements. Characteristics of peat soil are water content value (ω) is 294.30 %, acidity (pH) value is 3.000, and peat soils classified as fibrous peat soils. While the
characteristics of clay soil are water content value is (ω) 62.05 %, acidity (pH) value is 5.000, and clay soils classified as A-7-5 (AASHTO) and OH (organic clay) based on USCS. The result of the test paper filter test on peat soil obtained from the value of suction is (Ψ) 3.2432 kPa-17.5230 kPa. The results of testing the Filter Paper test method on the clay obtained the value of suction is
(Ψ) 61.8733 kPa-100.3421 kPa. The value of suction from clay soil is more than a value of suction peat soil based on Filter Paper test
method.
Keywords— soil suction; peat soil; clay soil; filter paper; characteristics soil.
I. INTRODUCTION
South Sumatra Province has a soil type with varying conditions such as peat and clay soil. Peat soil is a mixture of organic fragments derived from vegetation that has been transformed into fossils chemically. Clay soil is a mineral particle with fine grain size and has the potential for shrinkage. The characteristic of peat soil containing water content is quite high, causing peat soil to have a low of suction soil. The soil suction is directly connected with the released energy in the pores of water content in the soil. Based on clay soil characteristics influenced by moisture content it also affects the occurrence of soil suction on clay soil. The higher the groundwater content, the soil suction ability will be lower.
Soil suction is the capability of the soil to absorb water. Therefore, to determine the value of soil suction done laboratory testing by testing the soil suction. There are several methods to measure soil suction in the laboratory, among others tensiometer, thermal conductivity, and filter paper. In this research, laboratory testing is done using a filter paper method. Filter paper method is a simple test method whose main media is a filter paper by measuring the water content of filter paper. The filter paper used in this research is Whatman filter paper No. 42 [1] – [5]. Research from [2] using the filter paper method. This method is used
to analyze suction matrix suction and total suction. The results show higher water content in the compacted soil.
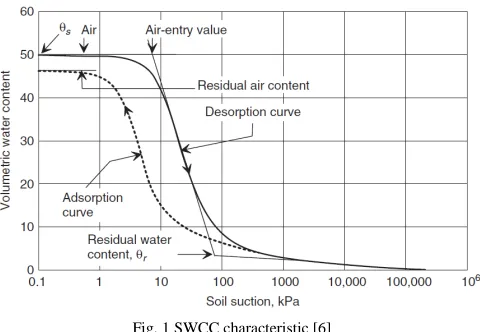
The relationship between water content and soil suction is the definition of the Soil Water Characteristic Curve. Water content states the amount of water contained in the pores of the soil. Some critical parameters in SWCC are Air Entry Value (AEV), slope curve function for negative or positive pore water pressure (MW), and residual water content (θv) or saturation (Sr). Soil Water Characteristic Curve (SWCC) is used as an estimate or estimate of soil properties in measuring its suction [3], [6]-[8]. The specific of Soil Water Characteristic Curve (SWCC) can be seen in Fig. 1 [6].
Fig. 1 SWCC characteristic [6]
II. MATERIAL AND METHOD
The research methodology used is the laboratory testing method conducted in Soil Mechanics Laboratory of Civil Engineering Department of Sriwijaya University. This research started with a survey of the research location. The location of the soil sampling is in Banyuasin District, South Sumatra Province. Soil samples taken are peat and clay soil. Soil sampling is undertaken in disturbed and undisturbed condition. Before testing the ability of peat soil and clay soil of the filter paper method, first testing soil properties.
Soil properties testing of peat soil are: (1) water content () ASTM D 2974-87; (2) acidity of peat soil (pH) ASTM D 2976-71; (3) specific gravity (Gs) ASTM D 854-14; (4) fiber content (FC) ASTM D 1997-13; and (5) organic content (OC) and ash content (AC) ASTM D 2974-14. While the testing of soil properties for clay soil is consists of several tests, among others: (1) water content, ASTM D 2216; (2) Specific Gravity, (Gs) ASTM D 854; (3) Sieve Analysis, ASTM D 422; and (4) Atterberg Limits ASTM D4318. Soil classification using a soil classification system based on AASHTO (American Association of States Highway and Transportation Official) and USCS (Unified Soil Classification System).
Soil suction testing for peat soil and clay soil in this research using measurement techniques with filter paper test methods. Soil suction testing using the filter paper method is based on ASTM D 5298-03. The filter paper used is Type II Whatman No. 42. The filter paper used in this research is shown in Fig. 2.
Fig. 2 Filter paper Whatman no.42
After peat soil sampling and soil properties, soil testing, then proceed with the preparation of making a sample of the specimen. The making of this specimen was done in Soil
Mechanics Laboratory of Civil Engineering Department of Sriwijaya University. Using a piece of pipe measuring 57 mm in diameter and about 50 mm in height, the soil sample used was compacted on the compacted pipe. In this research, we used two pieces of pipe mold soil samples. The soil mold of each piece of pipe will be used as a sample of the test material for soil suction measurement. At least more than two pieces of pipe are required to print the soil sample to be used in the soil suction test. In the peat soil and clay soil measurement test using the filter paper method, six samples were used as a sample of the suction test. Research from [2] had been used compacted samples with height (h) 70 mm and internal diameter (d) 85 mm for the filter paper test method.
The data obtained from the test results are data soil properties (soil characteristics), data of soil test suction with a filter paper method, and water content data every seven days. Soil suction test obtained data weight of dry filter paper and water in filter paper. From the data obtained value of filter paper water content. The soil suction value was obtained by calibrating the moisture content of the ASTM standard Whatman filter paper 42. From the data of the water content can be obtained the value of a degree of saturation (Sr, %) and volumetric water content (ϴv, %). In soil suction testing that has been done can be known Soil Water Characteristic Curve (SWCC) which describes the relationship of soil water with moisture content (), a degree of saturation (Sr), and volumetric water content (ϴv).
III. RESULTS AND DISCUSSION
The type of soil had been taken was peat soil and clay soil. Soil properties testing has been done on this soil samples. The test was conducted at Soil Mechanics Laboratory of Civil Engineering Department of Sriwijaya University. The results of the laboratory tests are shown in Table 1 and Table 2. The water content (ω) from peat soil in Table 1 is 294.30 %. The acidity (pH) value of peat soil samples obtained from field testing is 3.00 and from laboratory testing is 3.16. The pH results indicate that the peat soils contain high levels of acid and are included in the category of highly acidic. Based on the Von Post classification, peat soils are included on the H4 scale where peat soils decay slightly and emit dark and very turbid water. So that the characteristics of peat soil from Village III Banyu Urip, Banyuasin regency are included in the type of fibrous peat soil. The characteristics of peat soil in Ogan Ilir Regency, South Sumatera Province were also classified as fibrous peat soil. The value of water content () in the range 409.09 % - 493.01 % [9]. Based on the results from [10], the value of acidity (pH) of peat soil which is taken from Indah Kiat Pulp and Paper, Perawang, Riau Province is 3.20.
percentage of grains passed 200 more than 50 % sieve. So the soil including the classification of OH (organic clay with moderate to high plasticity).
TABLEI
CHARACTERISTICS OF PEAT SOIL
No. Tests Results
1. Water Content (ω ,%) 294.300 2. Specific Gravity (Gs) 1.799
3. Acidity (pH) 3.160
4. Organic Content (OC, %) 77.400
5. Ash Content (AC, %) 26.610
6. Fiber Content (FC, %) 70.450
7. Void Ratio (e) 3.092
8. Wet Unit Weight (γb, kN/m3) 17.335
9. Dry Unit Weight (γd, kN/m3) 4.396
10. Cohesion (c, kPa) 7.649
11. Internal Friction (φ, °) 24.000 12. Shear Strength (τ, kPa) 8.720
13. Von Post Scale H4
TABLEII
CHARACTERISTICS OF CLAY SOIL
No. Tests Results
1. Water Content (ω, %) 62.050
2. Specific Gravity (Gs) 2.594
3.. Liquid Limit (LL, %) 65.200
4. Plastic Limit (PL, %) 42.870
5. Index plastic (IP, %) 22.330
6. Wet Unit Weight (γb, kN/m 3
) 17.531
7. Dry Unit Weight (γd, kN/m3) 10.818
8. Void Ratio (e) 1.396
9. Acidity (pH) 5.000
10. Cohesion (c, kPa) 18.000
11. Internal Friction (φ, °) 22.835 12. Shear Strength (τ, kPa) 26.521
13. Classification AASHTO A-7-5
14. Classification USCS OH
The fiber content can be examined under a Scanning Electron Microscope (SEM). Fig. 3 and Fig. 4 shows the typical fiber orientation obtained by Scanning Electron Microscope (SEM) for soil obtained from Village III Banyu Urip, Banyuasin, South Sumatra Province. Based on test results conducted on the SEM peat in the Chemical Laboratory of Chemical Engineering Department of the Sriwijaya Polytechnic visible pores and fibers contained. The sample used in this test was a sample which is cut horizontally with a magnification up to 10.000x.
Testing of EDS (Energy Dispersive Spectroscopy) also performed for peat soil and clay soil sample from Village III Banyu Urip, Banyuasin, South Sumatra Province. EDS test was done to analyze the chemical elements contained in the peat soil and clay soil. The results of the testing of EDS can be seen in Fig. 5 and Fig. 6. Research [11] reported the results from a Scanning Electron Microscope (SEM) and Energy Dispersive Spectroscopy (EDS) tests. Based on the results of the EDS test showed that element C has the highest content.
Fig. 3 Result of sem 10000x peat soil sample in village iii banyu urip, banyuasin regency
Fig. 4 Result of sem 10000x clay soil sample in Village iii banyu urip, banyuasin regency
Fig. 5 Result of eds from peat soil in Village iii banyu urip, banyuasin regency
Soil suction testing using filter paper method on clay soil and peat soil from Village III Banyu Urip, Banyuasin regency had been done at Soil Mechanics Laboratory of Civil Engineering Department of Sriwijaya University based in ASTMD5298-03. Soil suction tests conducted as many as six samples on peat soil and clay soils. In this research, the soil suction value was obtained from the amount of water content on the Filter Paper calibrated by using a calibration curve or with an equation for Whatman Filter Paper No. 42.
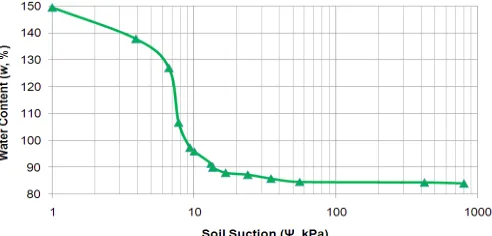
Table 3 shows the peat soil peat result from P1 sample testing. Table 4 shows the clay soil result from C1 sample testing. Based on Table 3, peat soil under the Degree of Saturation (Sr) condition is 100 % obtained water content () 149.4095%, Volumetric of water content (ϴv) 85.3882 %, and Soil Suction (Ψ) 1.000 kPa. While in clay soil (Table 4) for Degree of Saturation (Sr) of 97.7485 % obtained water content () 42.5407%, Volumetric of water content (ϴv) 56.9463 %, and soil suction (Ψ) 1.000 kPa.
The result of soil suction in Table 3 and Table 4 can be seen that the change of the suction value occurring on the peat and clay soils is related to the value of water content and the degree of saturation possessed by soil samples. The relationship of moisture content, a degree of saturation, and volumetric water content with soil suction occurring on peat soil samples can be seen in Fig. 7, Fig. 8, and Fig. 9. While Fig. 10, Fig. 11, and Fig. 12 shows the relationship of moisture content, a degree of saturation, and volumetric water content with suction on clay soil.
The graph of the relationship between water content () peat soil and soil s suction value as shown in Fig. 7 shows some points of initial value of soil sucking test, AEV value point, and residual water content. From the figure results the soil suction Ψ = 1,000 kPa with = 149.4095 % as the initial value of soil suction test, Ψ1 = 6,632632 kPa with 1 = 127.0030 % as the AEV value, and Ψ2 = 16.7062 kPa with
2 = 87.9751 % as value of residual water content.
The graph of the relationship between the degree of saturation (Sr) of peat soil and soil suction value in Fig. 8 shows some points of initial value of soil suction test, AEV value point, and residual water content. Based on the Fig. 8 results soil suction Ψ = 1.000 kPa with Sr = 142.5387 % as the initial value of soil suction testing, Ψ1 = 6.63263 kPa with Sr1 = 141.1450 % as AEV values, and Ψ2 = 16.7062 kPa with Sr2 = 137.6341 % as residual water content.
Fig. 9 shows a graph of the relationship between volumetric water content (θv) of peat soil and soil suction value. Fig. 9 shows some points of initial value of ground suction testing, Air Entry Value, and residual water content. The results is soil suction Ψ = 1 kPa with θv = 85.3882 % as the initial value of soil suction testing, Ψ1 = 6.6326 kPa with
θv1 = 78.9674 % as AEV values, and Ψ2 = 16.7062 kPa with θv2 = 64.4148 % as residual water content.
The relationship between soil suction clay with water content can be seen in Fig. 10. From the graph, it can be known that the starting point of the test on soil suction value
Ψ = 1.0000 kPa with a degree of saturation = 42.3292 %. While the soil suction value, Ψ1 = 48.9050 kPa with 1 = 40.8399 % shows the value point Air Entry Value and value
Ψ2 = 103.5342 kPa with 2 = 37.9294 % as residual water water content.
The result of the filter paper test on clay soil obtained the graph of soil saturation relationship with a degree of saturation (Fig. 11). From the graph, it can be seen the starting point of testing on soil suction value Ψ = 1.0000 kPa with a degree of saturation, Sr = 97.4560 %. While the soil suction value, Ψ1 = 48.9050 kPa with Sr1 = 93.6319 % shows the point value of AEV (Air Entry Value) 103.5342 kPa with Sr2 = 87.4753 % residual water content. Fig. 12 illustrates the soil suction graph with volumetric water content. From the graph it can be seen the starting point of testing on soil suction value Ψ = 1.0000 kPa with volumetric water content, ϴ = 56.7759 %. While the soil suction value,
Ψ1 = 48.9045 kPa with ϴ1 = 54.5481 % shows the value point AEV (Air Entry Value) and value Ψ2 = 103.5342 kPa with ϴ2 = 50.9613 % as residual water content. The value of AEV (Air Entry Value) from [13] in the range 3kPa- 200 kPa.
TABLEIII
RESULTS OF PEAT SOIL SUCTION FROM SAMPLE P1
No.
Water Content
(ωωωω, %)
Degree of Saturation
(Sr, %)
Volumetric of Water Content
(ϴv, %)
Soil Suction (Ψ, kPa)
1. 149.4095 100.0000 85.3882 1.0000
2. 137.7388 99.9000 82.1750 3.8826
3. 127.0030 99.0000 78.9674 6,6326
4. 106.5902 95.8970 72.4620 7.7614
5. 97.3758 91.2470 68.9482 9.3663
6. 95.9804 90.1480 68.1180 10.0358
7. 91.3841 87.4720 66,0961 13.1782
8. 90.0128 86,4600 65,3315 13.4625
9. 87.9751 85.2470 64,4148 16.7063
10. 87.2716 84.1747 63.6042 23.9449
11. 85.8190 83.1140 62.8027 34.8745
12. 84.6429 82.2577 62.1556 55.5056
13. 84.3120 81.7230 61.7520 421.9588
14. 83.9462 81.1560 61.3232 798.5424
TABLEIV
RESULTS OF CLAY SOIL SUCTION FROM SAMPLE P1
No.
Water Content
(ωωωω, %)
Degree of Saturation
(Sr, %)
Volumetric of Water Content
(ϴv, %)
Soil Suction (Ψ, kPa)
1. 42.5407 100.0000 56.9463 1.0000
2. 41.9737 96,5143 56.2273 14.0080
3. 41.1994 94.6953 55.1676 19.7394
4. 40.4207 93.0846 54.2292 27.1052
5. 39.9430 91.7572 53.3172 31.5157
6. 39.0946 90.4190 52.6762 41.6312
7. 38.0377 88.4253 51.5148 49.9796
8. 37.3970 87.1340 50.7625 61.8733
9. 36.8482 85.9830 50.0920 129.2291
Fig. 7 Graph of water content versus peat soil suction from sample p1
Fig. 8 Graph of degree of saturation versus peat soil suction from sample p1
Fig. 9 Graph volumetric of water content versus peat soil suction from sample p1
As shown in the graph above shows that the value of water content indicated by the soil may affect the value of saturation degree and volumetric water content which will then also affect the value of suction produced by the tested peat soil. Each graph of the three samples shows three different points in each sample. The points on each graph show the amount of value at the beginning of the occurrence of soil suction, the value of the Air Entry Value, and the value of the value at the beginning of the residual water content.
The initial value of the occurrence of soil suction, the magnitude of the AEV value, and the value of the initial value of residual water content shown on the graph are the parameters that form the Soil Water Characteristic Curve(SWCC). The points that lie between the AEV point and starting point of the residual water content are the slope points of the moisture (). The results of peat soil suction with a filter paper test method are shown in Table 5. Table 6 shows the results of clay soil suction. Fig. 12 and Fig.13
illustrate the graph of the relationship between Soil Water Characteristic Curve (SWCC) with peat soil and clay soil.
Fig. 10 Graph of water content versus clay soil suction from sample c1
Fig. 11 graph of degree of saturation versus clay soil suction from sample c1
Fig. 12 Graph volumetric of water content versus clay soil suction from sample c1
In soil suction testing conducted with peat soil samples indicated that peat soil has a low suction to water with a soil suction value of no more than 1000 kPa. The clay has a relatively small percentage of pore volume. The amount of Pressure required on soil sucking is related to the pores of a land. The larger the pores of the soil, the pressure required to suction the water gets smaller because the soil that has a larger pore can be easier in passing water. The research of [12] describes the matrix suction of 10 and 500 kPa on coarse-grained soils and fine-grained soils. The results show that the Grained soils and fine-grained soils. The results show that the sensitivity analysis obtained a good SWCC curve.
TABLE V
RESULTS OF PEAT SOIL SUCTION WITH FILTER PAPER METHOD
Parameters
Peat Soil Suction Initial
Value of Suction
Air Entry Value (AEV)
Residual Water Content
Sample P1
ω, % 149.4095 127.0030 95.9804 Sr, % 100.0000 99.0000 90.1480
ϴ, % 85.3882 78.9674 68.1180
Ψ, kPa 1.0000 6.6326 10.0358
Sample P2
ω, % 149.4095 127.0030 95.9804 Sr, % 100.0000 99.0000 84.2890
ϴ, % 83.5066 77.4935 67.0247
Ψ, kPa 1.0000 2.8320 3.2432
Sample P3
ω, % 149.4095 127.0030 91.3841 Sr, % 100.0000 99.1000 85.7510
ϴ, % 84.6304 78.3499 65.5933
Ψ, kPa 1.0000 10.3836 16.2930
Sample P4
ω, % 149.4095 127.0030 95.9804 Sr, % 100.0000 99.3000 90.1500
ϴ, % 80.8882 74.4674 63.6180
Ψ, kPa 1.0000 4.5326 9.3580
Sample P5
ω, % 149.4095 127.0030 95.9804 Sr, % 100.0000 99.4500 84.8750
ϴ, % 87,3066 81,2935 70,8247
Ψ, kPa 1.0000 3,9320 4,3432
Sample P6
ω, % 149.4095 127.0030 91.3841 Sr, % 100.0000 99.2160 85.5750
ϴ, % 88.4804 82,1998 70,8247
Ψ, kPa 1.0000 11.6136 17.5230
Fig. 13 Soil water characteristic curve (swcc) peat soil suction
TABLEVI
RESULTS OF CLAY SOIL SUCTION WITH FILTER PAPER METHOD
Parameters
Clay Soil Suction Initial
Value of Suction
Air Entry Value (AEV)
Residual Water Content
Sample C1
ω, % 42.3292 40.8400 37.9294
Sr, % 97.4560 93.6319 87.4753
ϴ, % 56.7759 54.5481 50.9613
Ψ, kPa 1.0000 48.9050 103.5342
Sample C2
ω, % 43.3412 42.3106 38.53392 Sr, % 99.2137 96.4817 89.20705
ϴ, % 57.7999 56.2083 51.97024
Ψ, kPa 1.0000 30.4006 64.1832
Sample C3
ω, % 42.5407 41.1994 37.39659
Sr, % 97.7485 94.6953 87.1339
ϴ, % 56.9463 55.1676 50.7625
Ψ, kPa 1.0000 19.7394 61.8733
Sample C4
ω, % 42.1292 38.7500 35.7440
Sr, % 95.2546 91.5225 85.3675
ϴ, % 55.6750 53.2543 49.8768
Ψ, kPa 1.0000 46.768 100.3421
Sample C5
ω, % 42.5057 41.1065 37.5467
Sr, % 98.2150 95.3750 88.1354
ϴ, % 56.6581 55.1768 50.8554
Ψ, kPa 1.0000 29.3756 63.1205
Sample C6
ω, % 43.2168 42.4510 38.5545
Sr, % 99.7685 96.9753 89.2500
ϴ, % 57.6560 56.1895 51.9432
Fig. 14 Soil water characteristic curve (swcc) clay soil suction
Based on the soil suction capability generated in soil suction testing, it is found that the greater the value of water content of a soil type, the greater the degree of saturation and volumetric moisture value of the soil type. Conversely, the water content of land will affect the absorption or puffing of the soil with the higher the value of moisture content, a degree of saturation, and volumetric water content of the soil will be smaller the value of suction produced by the soil. So from the results of research that has been done can be concluded that clay soil has a high soil suction ability compared with the suction be possessed by peat soil.
IV. CONCLUSION
The value of water content (ω) from peat soil is 294.30 %. The pH value of peat soil is 3.00. Peat soils are included on the H4 from Von Post classification. So, peat soils are classified as fibrous peat soils. The value of peat soil suction (Ψ) is 3.2432 kPa -17.5230 kPa. Peat soils have a fairly low suction capability. This is because the amount of soil suction value (Ψ) on peat soil obtained from the suction test with paper test does not reach more than 1000 kPa. The water content of clay soil is 62.05 %. pH value about 5.00. Classification of clay soils based on AASHTO is A-7-5. Moreover, based USCS is OH (organic clay). The value of peat soil suction (Ψ)= 61.8733 kPa-100.3421 kPa.
ACKNOWLEDGMENT
The author would like to thank Lily Triani and Ade Marshella. This research is part of the Dissertation research from Faculty of Engineering, Universitas Sriwijaya.
REFERENCES
[1] ASTM International. Standard Test Method for Measurement of Soil Potential (Suction) Using Filter Paper, D5298-03. ASTM International. 2003.
[2] Leong, E., C., Kizzam, R., and Rahardjo, H., Measurement of Soil Suction using Moist Filter Paper. E3S W. UNSAT 10012. DOI: 10.1051/ e3sconf/20160910012. 2016.
[3] Hezmi, M.a., Saari, R., Zahari, M., Z., Abdullah, R., A., Yunus, N., Z., M., and Safuan, Rashid, A., S., A., Soil Water Characteristic Curves of Compacted Kaolin for Various Initial Moisture Content. Jurnal Teknologi (Sciences and Engineering) 76:2 (2015) 39.44. [4] Leong, E., C., He, L., and Rahardjo, H., Factors Affecting the Filter
Paper Method for Total and Matric Suction Measurements. Journal Geotechnical Testing, Vol. 25, No. 3. Paper ID GTJ20028198_253. 2002.
[5] J. A. Munoz-Castelblanco, Jean-Michel Pereira, Pierre Delage, Yu-Jun Cui. Suction measurements on a Natural Unsaturated Soil: A Reappraisal of the Filter Paper Method. Alonso, E. E., and Gens, A. Unsaturated Soils-Proc. Fifth Int. Conf. on Unsaturated Soils, Sep 2010, Barcelona, Spain. CRC Press, 1, pp.707-712, 2010.
[6] Fredlund, D., G., Rahardjo, H., and Fredlund, M., D., Unsaturated Soil Mechanics in Engineering Practice. John Wiley and Sons. Canada. 2012.
[7] Zhai, Q., and Rahardjo, H., Determination of Soil Water Characteristic Curve Variables. Computers and Geotechnics 42 (2012) 37-43.
[8] Kheng, B., C., Leong, E., C., and Rahardjo, H., A Simplified Method to Estimate The Soil Water Characteristics Curve. Canadian Geotechnical Journal. 47: 1382-1400. doi:10.1139/T10-033. 2010. [9] Sutejo, Y. et al., Engineering Properties of Peat in Ogan Ilir Regency.
Jurnal Teknologi (Sciences and Engineering) 78: 7-3. 61–69. 2016 [10] Nevia. The response of Rice and Carbon Emission to Application of
Ameliorant Dregs in The Peat Soil With Saturation and Unsaturation Condition International. Journal on Advanced Science, Engineering And Information Technology (IJASEIT), Vol.4 No. 6 ISSN: 2088-5334. 2014.
[11] Bow, Y., Hairul, and Hajar, I., Molecularly Imprinted Polymer (MIP) Based PVC-Membrane-Coated Graphite Electrode for the Determination of Heavy Metals. Journal on Advanced Science, Engineering and Information Technology (IJASEIT), Vol.5. No. 6 ISSN: 2088-5334. 2015.
[12] Satyanaga, A., Rahardjo, H., Leong, E., C., and Wangm, J., Y., Water Characteristics Curve of Soil with Bimodal Grain Size Distribution. Computers and Geotechnics 48. 51-61. 2013.