Ames Laboratory Accepted Manuscripts
Ames Laboratory
12-14-2017
Ionic depletion at the crystalline Gibbs layer of
PEG-capped gold nanoparticle brushes at aqueous
surfaces
Wenjie Wang
Ames Laboratory, [email protected]
Honghu Zhang
Iowa State University and Ames Laboratory
Surya Mallapragada
Iowa State University and Ames Laboratory, [email protected]
Alex Travesset
Iowa State University and Ames Laboratory, [email protected]
David Vaknin
Iowa State University and Ames Laboratory, [email protected]
Follow this and additional works at:
http://lib.dr.iastate.edu/ameslab_manuscripts
Part of the
Condensed Matter Physics Commons
, and the
Nanoscience and Nanotechnology
Commons
This Article is brought to you for free and open access by the Ames Laboratory at Iowa State University Digital Repository. It has been accepted for inclusion in Ames Laboratory Accepted Manuscripts by an authorized administrator of Iowa State University Digital Repository. For more information, please [email protected].
Recommended Citation
Wang, Wenjie; Zhang, Honghu; Mallapragada, Surya; Travesset, Alex; and Vaknin, David, "Ionic depletion at the crystalline Gibbs layer of PEG-capped gold nanoparticle brushes at aqueous surfaces" (2017).Ames Laboratory Accepted Manuscripts. 90.
Ionic depletion at the crystalline Gibbs layer of PEG-capped gold
nanoparticle brushes at aqueous surfaces
Abstract
In situ
surface-sensitive x-ray diffraction and grazing incidence x-ray fluorescence spectroscopy (GIXFS)
methods are combined to determine the ionic distributions across the liquid/vapor interfaces of
thiolated-polyethylene-glycol–capped gold nanoparticle (PEG-AuNP) solutions. Induced by the addition of salts (i.e.,
Cs2SO4) to PEG-AuNPs solutions, two-dimensional hexagonal lattices of PEG-AuNPs form spontaneously
at the aqueous surfaces, as is demonstrated by x-ray reflectivity and grazing incidence small-angle x-ray
scattering. By taking advantage of element specificity with the GIXFS method, we find that the cation Cs+
concentration at the crystalline film is significantly reduced in parts of the PEG-AuNP film compared with
that in the bulk.
Disciplines
Condensed Matter Physics | Nanoscience and Nanotechnology
PHYSICAL REVIEW MATERIALS1, 076002 (2017)
Ionic depletion at the crystalline Gibbs layer of PEG-capped gold nanoparticle brushes
at aqueous surfaces
Wenjie Wang,1Honghu Zhang,2Surya Mallapragada,3Alex Travesset,4and David Vaknin4,*
1Division of Materials Sciences and Engineering, Ames Laboratory, U.S. DOE, Ames, Iowa 50011, USA 2Ames Laboratory and Department of Materials Science and Engineering, Iowa State University, Ames, Iowa 50011, USA 3Ames Laboratory and Department of Chemical and Biological Engineering, Iowa State University, Ames, Iowa 50011, USA
4Ames Laboratory and Department of Physics and Astronomy, Iowa State University, Ames, Iowa 50011, USA
(Received 18 May 2017; revised manuscript received 6 September 2017; published 14 December 2017)
In situsurface-sensitive x-ray diffraction and grazing incidence x-ray fluorescence spectroscopy (GIXFS) methods are combined to determine the ionic distributions across the liquid/vapor interfaces of thiolated-polyethylene-glycol–capped gold nanoparticle (PEG-AuNP) solutions. Induced by the addition of salts (i.e., Cs2SO4) to PEG-AuNPs solutions, two-dimensional hexagonal lattices of PEG-AuNPs form spontaneously at
the aqueous surfaces, as is demonstrated by x-ray reflectivity and grazing incidence small-angle x-ray scattering. By taking advantage of element specificity with the GIXFS method, we find that the cation Cs+concentration at the crystalline film is significantly reduced in parts of the PEG-AuNP film compared with that in the bulk.
DOI:10.1103/PhysRevMaterials.1.076002
I. INTRODUCTION
Natural self-assembly into ordered functional structures has long served as inspiration for developing artificially self-assembled novel structures for various applications. Many of the self-assembly processes, natural or artificial, take place in fluids that facilitate diverse interactions and that, in particular, can mimic biological ones [1]. In the past two decades, the programmable self-assembly of nano-objects in aqueous media have been exemplified by taking advantage of DNA functionalization and hybridization to crystallize colloidal nanoparticles (NPs) [2,3]. By varying parameters such as particle size, linker length, solution conditions, and other parameters, general rules for programmable three-dimensional (3D) superlattice formations have been gradually established [4]. At the same time, assembling NPs into two-dimensional (2D) crystalline and noncrystalline structures have also been developed. In one approach, charged Langmuir monolayers have been used as templates that attract and crystallize capped nanoparticles from solutions [5–7]. In a different approach, it has been found that by manipulating salt concentrations in NPs suspensions, a Gibbs-like monolayer can be spontaneously formed and crystallized [8–10]. It should be emphasized that for all these assemblies, 2D or 3D, salts play a decisive role in tweaking the charge of the DNA strands and facilitate specific 3D assembly of NPs or migration of NPs to the liquid interface [5–10]. In fact, a recent study suggests that the underlying mechanism that drives DNA-capped AuNPs to the surface and to crystallization has to do with the role of salt in tweaking the hydrophobic-hydrophilic character of the DNA-capped AuNPs [10]. This in turn led to the manipulation of salt (e.g., K2CO3) concentrations in assembling 2D and
3D ordered structures of polyethylene-glycol-capped (PEG-capped) AuNPs [11–13], taking advantage of the aqueous biphasic system (ABS) of PEG in salt solutions [14–16].
Herein, we report on x-ray reflectivity (XR), grazing incidence small angle x-ray scattering (GISAXS), and grazing
incidence x-ray fluorescence spectroscopy (GIXFS) measure-ments (on the same samples) to determine the structure of the crystalline film that is formed when salt is added to PEG-AuNP suspensions. In particular, we use the GIXFS method, which is both element-specific and surface-sensitive, to determine interfacial ion distributions [17]. Recently, the GIXFS method has been extensively employed to determine the specific ion enrichment at air-liquid interfaces [18–20]. The GIXFS can probe the surface-specific ion enrichment with high sensitivity and accuracy under the condition that the ion bulk concentration is dilute (so that the bulk fluorescent signals are relatively weak compared with those from the surface). In this study, we encounter the opposite case, where the bulk fluorescent elemental concentration is quite high and the surface fluorescent elemental concentration may be reduced.
II. EXPERIMENTAL DETAILS
The PEG-capped AuNPs (PEG-AuNPs) are prepared by using a simple aqueous-phase ligand exchange method, as documented previously [11,21]. Briefly, in the aqueous solu-tion the surface-bound citrate ligands on the unfuncsolu-tionalized AuNPs (nominal size of 10 nm; Ted Pella, Inc.) are replaced with poly(ethylene glycol) methyl ether thiol (PEG-SH, average molecular weight 6000 Da; Sigma-Aldrich) through thiol-gold chemistry. The as-prepared PEG-AuNPs are then washed with3 rounds of centrifugation (at 20 000g×1 h) and redispersion in Millipore water. UV-visible absorption measurements are used to determine the final concentration of PEG-AuNPs. For the x-ray measurements, PEG-AuNP suspensions (24 nM in water) are mixed with an equal volume of cesium sulfate solution (1.0 M Cs2SO4; Fisher Scientific).
The mixture (12 nM PEG-AuNPs and 500 mM Cs2SO4; 2 mL)
is loaded in a rectangular steel trough (99 mm×20 mm) with shallow depth (100 μm) in an airtight enclosure that is continuously purged with water-saturated helium gas for all x-ray measurements. Recently, we examined ionic specificity in interfacial crystallization of PEG-AuNPs [13] including, for instance, Na+, K+, and Cs+, and found Cs+ to be
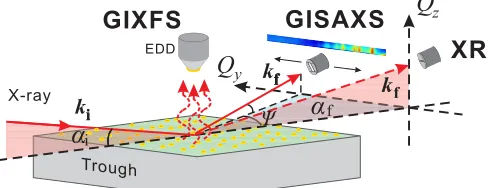
FIG. 1. Schematic setup for XR, GISAXS, and GIXFS mea-surements of the liquid/vapor interface. A point detector (Bicron) is used for both XR and GISAXS. In XR measurements, the detector rotates in the scattering plane and maintainsαi=αf. In GISAXS
measurements, the detector rotates horizontally. An energy-dispersive detector (EDD, Vortex) is placed above the sample surface for GIXFS measurements. See details in the text.
appropriate for our fluorescence study using an in-house x-ray spectrometer (operating at∼8 keV) and an energy-dispersive detector (EDD). Here, we seek to determine the distribution profiles of the Cs and Au based on GIXFS data. Thus, we choose Cs2SO4 salt to induce surface crystallization, taking
advantage of the high fluorescence yield of Cs+ [22,23] and absorption cross section [24] (compared with K+). In addition, Cs fluorescent signals (in the energy range 3.5–6 keV) are at higher energies than those of K and thus less attenuated along the pathway from the fluorescent sources to the detector (through windows).
X-ray measurements (XR, GISAXS, and GIXFS) are carried out on a liquid-surface spectrometer (LSS) at Ames Laboratory with the setup illustrated in Fig. 1. The incident x-rays are generated by a Rigaku Ultrax 18 operated at 50 kV and 250 mA using a copper rotating anode (Cu Kα) and pass through a monochromator (x-ray energyE=8.048 keV, x-ray wavelength λ=1.5404 ˚A) and are further collimated by slits along the beam path. As is common, scattering and spectroscopic intensities (i.e., photon counts/s) are normalized by the incident beam intensities recorded with a monitor placed upstream (not shown in Fig.1). Therefore, arbitrary units are used for intensities.
A specular XR method is employed to determine the electron-density (ED) profiles along the aqueous surface normal (designated as the zaxis). The monochromatic and collimated incident x-ray beam with the wave vector ki
impinges on the aqueous surface at an incident angleαiwith
respect to the surface. A Bicron detector is adjusted in the scattering plane to intercept the specularly reflected x-rays with the exit angleαfand the wave-vectorkf(see more detail
in Ref. [17]). The measured reflectivity,R, is expressed as a function ofQz(=2k0sinαi, with k0 being the wave number
2π/λ), which is thez-axis component of the scattering vector Q=kf−ki.
The GISAXS method is used to probe the lateral packing of the surface-bound PEG-AuNPs by fixingαi≈0.9αc(αc=
0.154◦ is the critical angle for total reflection from pure water) and collecting the scattered beam by adjusting the detector arm at a series of angle corresponding to the in-plane components of the scattering vector; namely,Qxy≈
2k0sin(/2) (see Fig.1). The vertical slits after the sample and in front of the Bicron detector are kept wide open to allow integration over a range ofQz values (in our case from 0 to
Qz≈0.085 ˚A−
1
). The horizontal slits are adjusted to allow for partial resolution between theKα1 andKα2 lines in the direct beam (both lines are superimposed such thatKα2peak shows as a distinct shoulder on the mainKα1peak).
For the GIXFS, we use a Vortex energy-dispersive detector (EDD) that is mounted above the sample surface collecting characteristic photons emitted from the illuminated volume including the elastic (Thomson) and inelastic (Compton) scattering [17,25]. The fluorescence spectra are collected as a function of incident beam angle αi such that below the
critical angle for total reflectionαc, the penetration depth of
the evanescent x-rays is finite, and thus surface sensitive (only fluorescent species within the∼100 ˚A are excited and fluoresce forαi< αc). Forαi> αc, the x-rays penetrate into the bulk,
probing multiple micrometers deep, and excite fluorescent species on the beam path.
In general, the goodness of the model-based profile fitting is represented byχ2, i.e.,
i(Ymodel,i−Yexpt,i)2/δYi2, where
Ymodel,i, Yexpt,i, andδYiare the calculated, experimentalith data
point and its associated error, respectively.χmin2 is the lowest
χ2value that corresponds to the most optimal profile fitting. The characterization of our PEG-AuNPs including small-angle x-ray scattering (SAXS), dynamic light scattering (DLS), and UV-vis spectroscopic methods have been described in detail elsewhere [11,12]. The average diameter of the AuNPs used in this study is determined as 88±8 ˚A. It is worth noting that the XR and GISAXS results in this study have been reproduced by employing synchrotron radiation under otherwise similar conditions [13]. Here, for consistency and completeness, we present the x-ray data collected from the same sample with all three methods.
III. RESULTS AND DISCUSSION
Specular x-ray reflectivity, R(Qz), from 0.5 M Cs2SO4
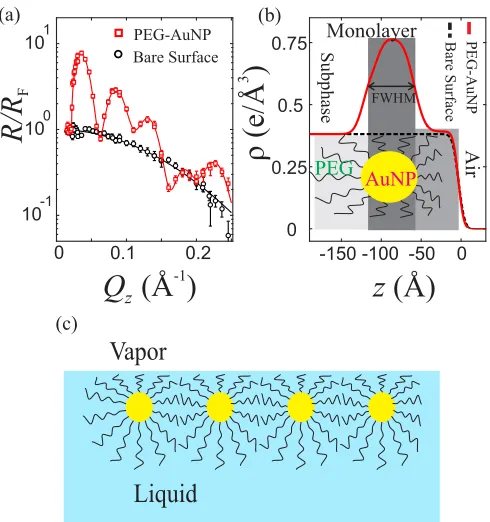
solution (without the PEG-AuNPs), normalized to the Fresnel reflectivity RF (calculated for an ideally smooth and flat vapor-solution interface), is shown in Fig.2(a). The R/RF
profile from the salt solution surface resembles that of an air-water interface where R/RF∼exp(−ξ2Q2z), and ξ is a measure of the instrumental resolution-dependent interfacial roughness [17,26,27]. In the presence of PEG-AuNPs in solu-tions, theR/RFprofile dramatically changes, showing a clear
interference pattern that is characteristic of a highly uniform film at the interface. The alternating maxima, separated by
Qz≈0.052 ˚A −1
up toQz∼0.15 ˚A −1
in theR/RFcurves, resemble the Kiessig fringes that are typical of a reflectivity curve from a homogeneous slab of thickness 2π/ Qz≈ 120 ˚A [26]. We note that the reflectivity from PEG-AuNPs solution in the absence of salt (in this case Cs2SO4; data
IONIC DEPLETION AT THE CRYSTALLINE GIBBS . . . PHYSICAL REVIEW MATERIALS1, 076002 (2017)
10-1 100 101
0 0.25
0.5 0.75
Q
z(Å )
-1R/R
F
z
( )
Å
)
/e
(
ρÅ
3
PEG-AuNP Bare Surface
ri
A
Monolayer
es
a
h
p
b
u
S
(a) (b)
FWHM
AuNP
PEG
P
N
u
A-G
E
P
ec
af
r
u
S
er
a
B
Liquid
Vapor
(c)
0 0.1 0.2 -150 -100 -50 0
FIG. 2. (a)R/RFfor Cs2SO4 solutions in the absence of
PEG-AuNPs () and in the presence of PEG-AuNPs (). The solid lines are the calculatedR/RFbased on the refined structural parameters.
(b) The corresponding electron-density profiles (solid line for the PEG-AuNP-laden surface and dashed line for the bare surface) across the air-solution interfaces based on the best-fit structural parameters. The FWHM marks the full width at half maximum for the bell-shaped ED segment with respect to the subphase ED. The ED profile for the PEG-AuNP film can also be envisioned as a stack of ED-uniform slabs with smeared interfaces (∼10 ˚A) for the rich slab. The Au-rich slab has an ED of 0.76e/A˚3 and the top slab has an ED of 0.39e/A˚3. (c) A side-view depiction of the air-solution interface that is crystalline Gibbs film of PEG-AuNPs induced by the addition of 0.5 M Cs2SO4to the aqueous suspension of PEG-AuNPs.
reflectivity. The ED profiles are generated by refinement of the effective-density model [28] by calculating the reflectivity with the Parratt recursion formalism [17,26,27]. Figure2(b) shows the optimal ED profiles that best fit the R/RF data
presented in Fig.2(a). The ED profile for an air-solution (i.e., 0.5 M Cs2SO4) interface in the absence of the PEG-AuNPs
resembles a smooth step-like function with a gradual transition (characterized withξ ∼6 ˚A) from zero to the bulk ED. In the presence of PEG-AuNPs with salt, the ED profile exhibits a prominent bell-shaped ED segment with a FWHM≈60 ˚A (measured with respect to the subphase ED). The total film depth is extended over about 100 ˚A contiguous to the subphase and a plateau regime (50 ˚A) adjacent to the vapor phase. It is obvious that the bell-shaped ED segment can be associated with a monoparticle layer of AuNPs such that their centers form a well-defined plane parallel to the liquid surface. This is supported by the FWHM which is comparable to the diameter of the AuNPs used in this study,D=88±8 ˚A (the uncertainty arises mainly from the particle-size distribution). The ED of spheres (centers forming a plane at z=z0) in
a uniform medium varies along the surface normal, z axis,
10-2 10-1 100
Q
xy(Å )
-1
)s
ti
n
u .
br
a(
yti
s
ne
t
nI
1
3 4
7
[image:5.608.52.297.69.330.2]-0.08 -0.04 0 0.04 0.08
FIG. 3. GISAXS intensity integrated overQz range from 0 to
0.085 ˚A−1as a function ofQxy. The main peak atQxy=0 is due to the
specularly reflected beam and the contribution from diffuse scattering. The symmetric diffraction pattern indicates the formation of a 2D hexagonal structure of the PEG-AuNPs induced by the addition of salt to the suspension, in this case 0.5 M Cs2SO4. The solid line is the
profile constituted by superposing a number of Lorentzian functions. The dashed lines (in red, blue, green, and magenta), indicated by 1, √
3,√4, and√7 (i.e., the ratio of theQxy position of each peak
with respect to the primary peak), correspond to the primary up to the fourth-order diffraction peaks (each is modeled as a Lorentzian function), characteristic of a 2D hexagonal lattice.
proportional to (D/2)2−(z−z0)2, with a maximum ED at
z=z0 and a FWHM=D/√2. In our case the calculated FWHM=62±5 ˚A. This is remarkably close to the FWHM extracted from the XR reflectivity (≈60 ˚A), indicating the PEG-AuNPs form a very flat layer at the interface. This is also consistent with the surface ED profiles determined for aqueous surface superlattices of PEG-AuNPs induced by K2CO3[11].
The topmost layer is associated with a PEG-rich phase, as depicted in Fig.2(c).
Figure3shows the GISAXS intensity integrated over theQz axis (integrated fromQz=0 to≈0.085 ˚A
−1
) from Cs2SO4
solution in the presence of PEG-AuNPs. The prominent peak at Qxy=0 is dominated by specular reflection (i.e., total reflection at Qz=0.9Qc, where Qc=2k0sinαc) and
diffuse scattering. On both sides of the central peak, there are diffraction peaks with the primary Bragg reflection (centered atQxy =Q1=0.0254 ˚A−
1
) and the higher-order reflections with the following relations, Qi/Q1=1,
√
3, √4, and √
7 where i=1,2,3,4. This is evidence of a spontaneous self-assembly into 2D hexagonal lattice with an average interparticle distance aL=4π/(
√
3Q1)≈285 ˚A, consistent
with results obtained with similar PEG-AuNPs in the presence of K2CO3 [11]. Assuming monodisperse PEG-AuNPs (Au
core radius≈44 ˚A) with an average interparticle distanceaL and using the maximum ED,ρmax≈0.76e/A˚
3
obtained in XR measurement (shown in Fig.2), we estimate an almost 100% surface coverage by a hexagonal crystalline film (details of the calculations are given in the supporting information of Ref. [11]). We note that the volume fraction of the AuNPs (D=88 ˚A) in the unit cell of the 2D hexagonal lattice is estimated as the ratio ofπ D3/6 (i.e., the volume of a AuNP)
[image:5.608.313.562.69.223.2]0
1
2
3
4
5
0
10
20
30
40
)s
ti
n
u .
br
a(
yti
s
ne
t
nI
(b)
Energy (keV)
α α
i/
c,water<0.9
Water
Cs SO solution2 4
Cs SO solution & PEG-AuNPs
2 4
(a)
AuMα1
CsLα1,2
CsLβ1
CsLβ2
CsLγ1
α α
i/
c,water=1.6
2 2.5 3 3.5 4 4.5 5 5.5 7.8 8.2
Water
Cs SO solution2 4
Cs SO solution & PEG-AuNPs
[image:6.608.52.297.67.335.2]2 4
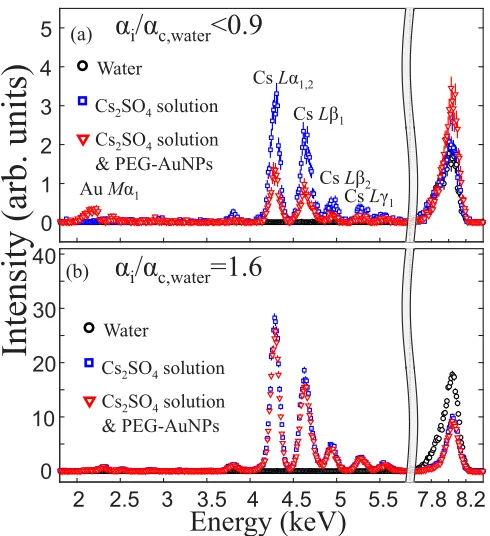
FIG. 4. Fluorescence x-ray spectra from an x-ray-illuminated surface for water, 0.5 M Cs2SO4solution, and for PEG-AuNPs with
0.5 M Cs2SO4(a) integrated overαi< αc,waterand (b) at one particular
incident angleαi> αc,water. (Here,αc,waterrepresents the critical angle
for an air-water interface). The asymmetric signal around 8 keV is a superposition of the Thomson and Compton scattering at a scattering angle of 90◦. The peaks in the range of 3.5 to 6 keV are all identifiable as Cs characteristic emission lines [29], and the Au signal is at ∼2.1 keV. Spectral intensities in both panels (a) and (b) are scaled with respect to the incident beam intensity.
to√3a2
LD/2 (i.e., the volume of a unit cell) is only∼5.7%. Moreover, the ratio of a AuNP compared with the total volume of capped PEG-AuNP is even smaller, which is important to our estimate below regarding cationic concentration at the interface; i.e., ignoring solution volume displacement by AuNPs does not significantly affect ion counting in the crystalline film.
Figure4(a) shows the fluorescent spectra integrated over the αi< αc,water (high sensitivity for interfacial ions; note
the αc,water is slightly smaller than the αc of 0.5M Cs2SO4
solution). The spectra in the 3.5 to 6 keV energy range are all characteristic emission lines of Cs [29], (for instance,Lα1,2at
4.3 keV,Lβ1at 4.6 keV,Lβ2at 4.9 keV, andLγ1at 5.3 keV).
The Cs spectra exhibit a significant reduction in intensity in the presence of PEG-AuNPs in the solution, indicating significant reduction of Cs+ ions at the crystalline interface. Under the same conditions, a peak at≈2.1 keV corresponding to theMα1
emission line of Au emerges, and the scattering of the primary beam at energy≈8.04 keV is enhanced (due primarily to the high scattering cross section of Au). All of these demonstrate that the spectra are highly sensitive to interfacial enrichment of PEG-AuNPs. Figure4(b)shows the spectra collected above the critical angle for total reflection (at αi=1.6αc,water) that
are dominated by signals from the bulk water and ions. Above
Elastic and inelastic scattering
10
010
110
210
3)s
ti
n
u .
br
a(
yti
s
ne
t
nI
(a)
(b)
10
010
110
210
3Water
Cs SO solution
2 4Cs SO solution
& PEG-AuNPs
2 4
Integrated over [7.5-8.5] keV
Integrated over [4.0-5.4] keV
Cs fluorescence
Cs SO solution
2 4Cs SO solution
& PEG-AuNPs
2 4
0.5 1.0 1.5
α
i/α
c,waterFIG. 5. (a) Integrated Cs+ fluorescent intensity (over energy range 4.0–5.4 keV) as a function of normalized incident angle
αi/αc,water for a 0.5 M Cs2SO4 solution in the absence () and
presence of PEG-AuNPs (). The solid lines are calculated profiles in terms of optimal parameters and the matrix method (see the appendix for more details on modeling). (b) Integrated intensity over 7.5 to 8.5 keV of the Thomson and Compton scattering at 2θ≈90◦from a pure water surface (), 0.5 M Cs2SO4 solution (), and from
12 nM PEG-AuNP suspension with 0.5 M Cs2SO4 (). The solid
lines are optimally calculated profiles based on Eqs. (A3) and (A4) for scattering from a bare surface of water or salt solution. The shaded area in panels (a) and (b) represent acceptable optimal profiles for the salt solution in the presence of PEG-AuNPs calculated based on the multiple-layer model shown in Fig.6and the matrix method.
the critical angle, the penetration depth of the primary beam significantly decreases due to the attenuation by Cs ions. (see the appendix for more details).
[image:6.608.320.559.67.513.2]IONIC DEPLETION AT THE CRYSTALLINE GIBBS . . . PHYSICAL REVIEW MATERIALS1, 076002 (2017)
versus the normalized incident beam angle (αi/αc,water) for
a 0.5 M Cs2SO4 solution in the absence and presence of
the PEG-AuNPs. It is evident that, over the entireαi range,
the intensity of the Cs signal is lower in the presence of PEG-AuNPs at the interface, providing qualitative evidence of reduced [Cs+] at the PEG-AuNP film compared with the same Cs2SO4solution without the NPs. We emphasize that such ion
reduction in the film is not due to the well-known ion surface depletion of salt solutions, which can be hardly detected by x-ray methods and only for much higher salt concentrations (few molar) [30] compared with the concentrations used in this study. Figure5(b)shows the direct-beam scattering intensity (Thomson and Compton) as a function ofαifor pure water, salt
solution, and salt solution with PEG-AuNPs. In the absence of the PEG-AuNPs, the common trend in the scattering intensity profiles for water and Cs2SO4 solutions in Fig. 5(b) is a
balance between the high concentration of the [Cs+] with large scattering cross sections (increasing scattering intensity) and the resulting shortened x-ray penetration depth (decreasing the effective volume of scattering), as described in the appendix. In the presence of PEG-AuNPs in solution, the intensity below the critical angle is higher compared with that from Cs2SO4
solution and the other way around above the critical angle. This is an indication that the accumulation of interfacial PEG-AuNPs as strong scatterers significantly attenuates the beam that penetrates the subphase. To model theαidependence of
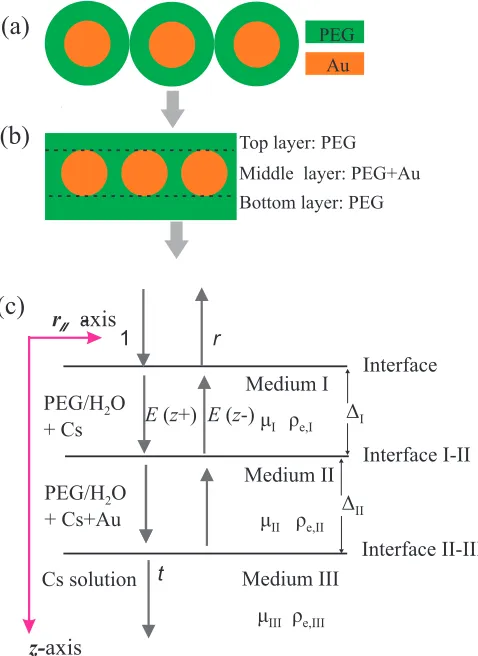
the fluorescence-intensity profiles, we use standard procedures [17,31] and extend them to simultaneously fit the spectra of Cs and the scattering from the direct beam. For that, we simplify the crystalline film structure as a stack of two strata (based on and consistent with the XR and GISAXS), each of which has a distinct chemical composition, as is shown in Fig. 6. The topmost stratum consists of densely packed PEG of thickness I50 ˚A, and a AuNP-rich stratum of
thickness IIadjacent to it (Au core occupying only 5.7% of
the volume in this stratum when II=88 ˚A, as shown above).
A third stratum of the PEG attached to the AuNPs and in contact with the subphase is assumed to be a continuum of the subphase because it has practically the same ED as the solution [11], and it is considered as indistinguishable from the bulk subphase. Combining the direct beam scattering (Thomson and Compton) and the fluorescence allows for self-consistent evaluation of the electric field (of x-rays) in the film, taking into account x-ray absorption and scattering processes assuming the stratified model shown in Fig. 6. We also note that the in-plane density of AuNPs is kept constant consistent with GISAXS. The x-ray intensity at a depth z, is a function of incident beam intensity, incident angle αi, depth z, and
the optical properties of the medium with respect to x-rays; namely, linear attenuation coefficient μand atomic number densityρat, represented by the refractive indexn=1−δ+iβ
[26] using the optical matrix method summarized in the appendix. For each stratum, δ=(reλ2/2π)
iρat,iZi and
β =(λ/4π)iρat,iσa,i, where i in the subscript represents theith elemental species,Z is the atomic number, andσa is the x-ray absorption cross section listed in TableI. The solid lines in Figs.5(a)and5(b)for water and the 0.5 M Cs2SO4
solution without PEG-AuNPs are obtained without any fitting parameters, as described in the appendix. The solid lines to the spectra of the PEG-AuNPs/Cs2SO4 in solution are obtained
(a)
(b)
Interface
Interface I-II
Interface II-III
t
1 r
(c)
z-
axis
r
//axis
-PEG Au
Top layer: PEG Middle layer: PEG+Au Bottom layer: PEG
PEG/H O + Cs
2
PEG/H O + Cs+Au
2
Cs solution
E z( +) E z( -) ΔI
ΔII Medium II Medium I
Medium III μ ρI e,I
μII ρe,II
μIII ρe,III
FIG. 6. (a) Illustration of a single planar layer of PEG-AuNPs suspended in vacuum (side view). (b) Close-packed PEG-AuNPs envisioned as core Au particles embedded in the matrix of PEG. (c) In GIXFS data analysis, the matrix method is employed. The middle gold-rich layer (i.e., medium II), where the core gold particles are confined, is approximated as a layer where gold is uniformly distributed. The top PEG-rich layer (i.e., medium I) and bottom-PEG-diluted layer are both viewed as a Au-free layer [11]. The bottom PEG-diluted layer (i.e., medium III) is viewed as mixed with aqueous solution. The optical properties,μ (the linear absorption coefficient) and ρe (ED) are fully determined by the constituent
elemental densities.
from the best, nonlinear least squares parallel fitting to the combined spectra of Cs and direct beam. To fit the data we use four parameters: I (in a limited range 10–50 ˚A), II(in
a limited range of 60–120 ˚A), and [Cs+] concentration with an upper limit of 1 M (i.e., the bulk concentration) and the PEG volume ratio (denotedVPEG%) in the mixture of PEG and
water. To a first approximation, media I and II possess the same [Cs+] andVPEG%. Our analysis shows that, within these limits,
and to be consistent with the spatial limit posed by XR results (i.e., I+ II100 ˚A), the optimal fitting is obtained for I=15±10 ˚A, II=90±20 ˚A, VPEG%=0.2±0.2 and
[Cs+]=0.4±0.1 M with a significant decrease compared with 1 M in the bulk (uncertainties correspond to at most 20% change inχ2with respect toχmin2 ). The generated profiles in terms of these parameters including uncertainties are shaded as shown in Fig.5. Again, we emphasize that such a dramatic reduction has nothing to do with the classical ionic surface
[image:7.608.316.555.71.399.2]TABLE I. Reference data for x-ray (elastic and inelastic) scattering intensity per atom and absorption cross section per atom.f represents the mean atomic scattering factor (in units ofre, the classical radius of the electron) at 2θ=90◦[i.e., (sinθ)/λ=0.46 ˚A
−1
] for a free atom.Iinc
represents the incoherent intensity of Compton scattering per atom at (sinθ)/λ=0.46 ˚A−1. The value is obtained through linear interpolation by using two neighboring, consecutive tabulated values. Data source forf andIincis theInternational Tables for Crystallography[36].σa
represents the absorption cross section per atom (in units of barns, 1 barn=10−24cm2) for x-rays atE=8.0 keV. Data source forσ
aisXCOM:
Photon Cross Sections Database, a web database provided by the National Institute of Standards and Technology (NIST) [24].
Elements H C O S Cs Au
Z 1 6 8 16 55 79
f [re] 0.09 1.77 2.56 7.34 30.85 49.06
Iinc[re2] 0.99 4.36 5.60 8.58 19.45 n/a
σa[barn] 9.816×10⁻³ 8.459×101 2.967×10² 4.986×10³ 7.015×10⁴ 6.584×10⁴
depletion due to high salt concentrations in solutions. First, for pure salt solutions, the length scale over which the depletion falls off is merely a few ˚A [30] and, second, the overall depletion (total ions in the illuminated volume) is not as dramatic as we observe over the depth of the crystalline film. It is in fact expected that ion concentration in the corona of the capped AuNPs is at the so-called θ point; however, it has not been demonstrated yet. Below, we examine the Cs concentration in relation to the PEG and water content in the region of the crystalline film.
IV. THEORETICAL CONSIDERATION
We consider a general salt consisting of ions AzA and
BzB and chemical formula AzA
p BqzB, where the condition
pzA+qzB =0 enforces charge neutrality. In the presence of two media of dielectric constantsε1 (the index 1 refers to
the content in I+ II) and ε2 (the bulk), the salt
concen-trations aren1=[Cs+]filmandn2=[Cs+]bulkfor the surface
PEG-AuNP film and the bulk, respectively. The equilibrium condition between the PEG-AuNP film, salt and water, and the bulk is
(p+q)kBTlnn1= G+(p+q)kBTlnn2, (1)
where we assume that the free-energy cost of transferring ions between the two media (film and bulk) is given by the Born approximation
G= − e
2
8π ε0
1
ε1 −
1
ε2
pz
2
A
rA +qz
2
B
rB
. (2)
Combining Eqs. (1) and (2) and assumingε2=εw (i.e., the dielectric constant of water) leads to the relation
ln
n1 n2
= 1
p+q
1−ε2
ε1
pz2
A
rA +qz2B
rB
lB, (3)
where rA and rB are the ionic radii of ions AzA and BzB, respectively, andlB =e2/(8π ε0εrkBT) is the Bjerrum length in water.
We assume that the film consists of water with a dilute species whose intrinsic dielectric constant isεP, which is PEG in our case. We define a quantity x as the fraction of PEG within the film as follows:
x = NPEG
NPEG+Nw
, (4)
whereNPEGandNware the number of PEG monomers and the number water molecules in the crystalline film, respectively. The dielectric constant in the film is then given by
ε1=(1−x)εw+xεP =εw[1−(1−γ)x], (5) whereγ =εP/εwis the ratio of the dielectric constant of the dilute species and water. Therefore, the equation relating the two densities is
ln
n1 n2
= − lB
p+q
pz2
A
rA +qzB2
rB
(1−γ)x
1−(1−γ)x. (6)
To apply this formula to (Cs1+)2(SO24−)1 (p=2, q=1,
zA=1, zB = −2), we use rA=0.169 and rB=0.23 [32] (in nm) and εP ≈10 [33]. We note thatn2 varies close to
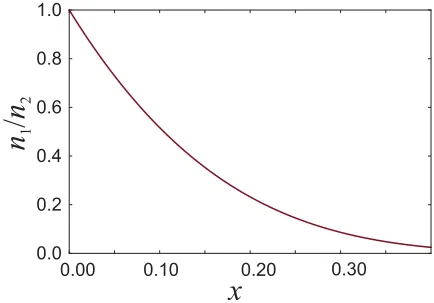
the interface; however, this variation is negligible compared with the depletion due to the presence of a crystalline film of PEG-AuNPs at the interface. The relation betweenx (PEG fraction) and the amount of ion depletionn1/n2is shown in
Fig.7. As implied in the discussion above, our experimental results (XR, GISAXS, and GIFXS) are not sensitive to the ratio x. So, by evaluating the experimental (GIFXS) upper limit n1
n2 ≈0.4, we obtain a lower limit forx ≈0.12; namely, that the crystalline film contains about 12% of PEG monomers and 88% water molecules in which the salt is
0.00 0.10 0.20 0.30
0.0 0.2 0.4 0.6 0.8 1.0
x
n
n
2
1
[image:8.608.328.545.537.689.2]/
FIG. 7. Ratio of the Cs ionic concentration at interface (n1)
compared with bulk (n2) vs x=NPEG/(NPEG+Nw), whereNPEG
and Nw are the number of PEG monomers and number water
molecules in the film (within I+ II). Note that the quantity
IONIC DEPLETION AT THE CRYSTALLINE GIBBS . . . PHYSICAL REVIEW MATERIALS1, 076002 (2017)
dissolved. Such a ratio corresponds to over approximately 6 M PEG monomers in the film compared with the average 2.6×10⁻⁴ M in the bulk. [Note that PEG monomer bulk concentration is estimated based on the number of monomers per PEG6k (≈136), the grafting density of PEG6k per AuNP
(≈160) [11], and the bulk concentration of PEG-AuNPs in the solution, i.e., 12 nM.] Given the measured hydrodynamic diameter (measured with DLS) of PEG-AuNPs in the bulk,
Dh=38 nm, one can assume PEGs are contained in the shell surrounding the Au core with thickness (Dh−D)/2≈14 nm and estimate that the PEG monomer concentration in the shell of a PEG-AuNP that is suspended in the bulk is approximately 1.3 M. Therefore, it can be concluded that a significant amount of water is squeezed out of the shell of PEG-AuNPs as they populate and crystallize at the surface.
V. CONCLUSION
In this study, we combine surface-sensitive x-ray scatter-ing and spectroscopy methods to characterize the structure, coverage, and ionic depletion at an interface that consists of crystalline AuNPs capped with PEG induced by the presence of salt in solution. The angular dependence of the fluorescence spectra allows us to determine a significant reduction in the cation (i.e., Cs+) concentration at the interface, from 1 M in bulk to 0.4 M in the crystalline film. We also show that such a reduction results from the difference in dielectric constant between the bulk and the interface due to the accumulation of polymers at the interface, where the polymer concentration at the crystalline film is approximately 104times that of the bulk.
ACKNOWLEDGMENTS
This research was supported by the U.S. Department of Energy, Office of Basic Energy Sciences, Division of Materials Sciences and Engineering. Ames Laboratory is operated for the U.S. Department of Energy by Iowa State University under Contract No. DE-AC02-07CH11358.
APPENDIX A: FLUORESCENCE AND SCATTERING CONSIDERATIONS
In the grazing incidence fluorescence spectroscopic mea-surements, the x-ray beam is incident on the aqueous surface at a series of incident angleαinear the critical angle for total
reflection,αc. The energy-dispersive detector (EDD) is pointed
at the surface along the surface normal. The resulting x-ray flu-orescence signals are omnidirectional and only a small portion of the fluorescence photons that propagate along the surface normal are accepted and discriminated by the EDD. Mean-while, the x-ray photons that result from the scattering pro-cesses (elastic and inelastic) are also detected by the EDD, cor-responding to the scattering angle 2θ ≈90◦, in the vicinity of the incident x-ray energy∼8.0 keV (see Fig.8). Asαichanges, the corresponding fluorescence and scattering intensities ob-tained by EDD also change accordingly. Theαi-dependent
flu-orescence and scattering intensity profiles are discussed below. The fluorescent and scattering intensities are proportional to the x-ray wave intensity within the media and the concentration
Interface =0z
α
iEDD
2θ
Incident X-rays
[image:9.608.327.543.69.177.2]Fluorescence and Scattering
FIG. 8. Illustration of the grazing-incidence x-ray fluorescence spectroscopic measurement configuration for a simple air-liquid interface. X-rays impinge on the air-liquid interface at a grazing incident angle αi. Within the x-ray penetration depth, the liquid
molecules (e.g., water) and other present ions, if any, interact with x-rays and give off elastic and inelastic scattering, and fluoresce if excited. The EDD above the surface collects x-rays emanating from the surface along the surface normal.
of the atoms in the x-ray pathway. Here, we employ the optical matrix method for stratified media to assess the x-ray intensity distribution in solutions [17,34]. The intensity of x-rays originating from scattering processes (elastic or inelastic) that take place at a depth z below the air-solution interface is proportional to the x-ray intensity, i.e., |E(αi,z)|2 [E(αi,z)
being the electric-field amplitude at depthzwhen the incident angle of the primary beam isαi] and the local concentrations
of the atoms or ions that scatter. The scattering (including Thomson and Compton scattering) intensity along the surface normal,Isc, can be expressed as follows:
Isc(αi)=ηscA0
|E(αi,z)|2
Ci(z)
fi2+Iinc,i dz, (A1)
whereCrepresents concentration of certain constituent species in the solution. The subscriptirepresents a particular element, as listed in TableI.ηscis a scaling factor accounting for detector
efficiency for the x-ray signals at the relevant photon energy.
A0is the overlap between the area of the incident x-ray-beam footprint and the EDD effective detecting area. Likewise, the angular fluorescence intensity of a specific element (i.e., Cs in this case),Ifluo(αi), can be expressed similarly as
Ifluo(αi)=ηfluoA0
|E(αi,z)|2CCs(z)dz, (A2)
whereηfluo is the intensity scaling constant andCCs(z) is the
Cs+ion concentration at depthz.
1. Single vapor-liquid interface
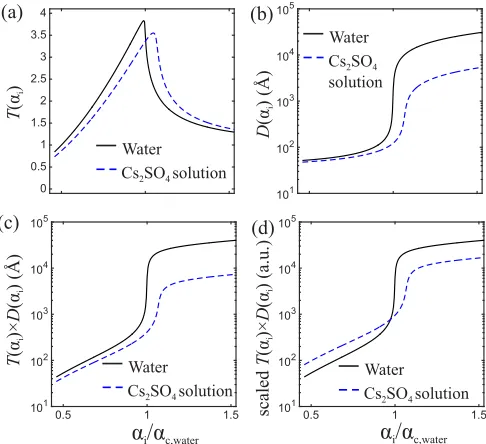
The single interface between the vapor phase and solution, i.e., the air-liquid interface, is by far the simplest case. The concentrations of the scattering and fluorescent entities (i.e., ions, atoms, or molecules) are considered constant throughout the aqueous solutions thus the integrals in Eqs. (A1) and (A2) are reduced to the closed form, i.e., the product of the functionsT(αi) andD(αi), whereT(αi) is the Fresnel intensity
transmission function at the vapor-bulk interface andD(αi) is
0 0.5 1 1.5 2 2.5 3 3.5 4 101 102 103 104 105 T ) (α i D ) Å( ) (α i T ×) (αα i i D ) Å( ) ( Water Cs SO solution2 4
(a) (b)
0.5 1 1.5 101
102 103
104 105
0.5 1 1.5 101 102 103 104 105 (c) (d)
α α
i/
c,waterα α
i/
c,water×) ( de la cs T α α i i D ). u. a( ) ( Water Cs SO solution2 4
Water Cs SO solution2 4 Water
Cs SO solution
2 4
FIG. 9. (a) X-ray intensity transmission coefficientT as function ofαicalculated for an air-water and air-Cs2SO4solution interface.
(b) X-ray penetration depthD(αi) along the surface normal for a
water and a Cs2SO4solution subphase. The calculation is based on the
parameters given in TableII. (c) The corresponding product ofT(αi)
andD(αi) for water and Cs2SO4solution (0.5 M). (d) The product of
T(αi) andD(αi) rescaled by the scattering factors, i.e., theT(αi)D(αi)
for Cs2SO4 solution is multiplied by {[H2O](fH22O+Iinc,H2O)+
[Cs2SO4](fCs22SO4+Iinc,Cs2SO4)}/{[H2O](fH22O+Iinc,H2O)}.
the x-ray penetration depth function [17,26–28,34]. Given the x-ray wavelength,T(αi) andD(αi) can be calculated based on
the index of refraction (a complex number)n=1−δ+iβof the media onto which the x-rays are incident from vacuum [17,26–28,34]. The δ and β for a given medium can be explicitly expressed as a function of x-ray wavelength λ, electron number densityρe, and linear absorption coefficient
μ [26]. Figures 9(a) and 9(b) show the calculated T(αi)
and D(αi) for pure water and a Cs2SO4 solution (0.5 M),
respectively. The presence of Cs2SO4 (0.5 M) changes the
optical properties of the media (i.e., water) and significantly reduce the x-ray penetration depth at incident angles above the critical angle. Given the same parameters (i.e., ηsc and
A0) and intensity normalization by incident beam flux0, the
obtained scattering intensity by the EDD is simply the product of functionT(αi) andD(αi), and the total scattering from the
constituent atoms or ions.
The scattering from pure water can be expressed as the
T(αi)D(αi) scaled by the scattering factors of individual H2O
molecules. The concentration of water, denoted as [H2O], is
constant, i.e., 55.56 mol/L (corresponding to a mass density of 1 g/cm3), throughout the bulk. Equation (A1) is expressed as
Isc(αi)= ηsc0A0[H2O]
f2
H2O+Iinc,H2O T(αi)D(αi)
water
, (A3)
where both T(αi) and D(αi) are calculated for the water
[image:10.608.52.295.71.293.2]subphase [17,25]. For a concentrated Cs2SO4 solution, the
TABLE II. Parameters to evaluate x-ray transmission coefficient and penetration depth. The attenuation lengthsfor pure water and salt solution are calculated based on their mass density. The values for PEG are estimated based on its bulk properties [35].
Media Pure water Cs2SO4solution (0.5 M) PEG
[×107A]˚ 1.0 0.19 1.4
ρe[e/A˚
3
] 0.334 0.381 0.369
scattering is as follows:
Isc(αi)=ηsc0A0×[H2O]
fH2
2O+Iinc,H2O +[Cs2SO4]
fCs2
2SO4+Iinc,Cs2SO4 T(αi)D(αi)
Cs2SO4solution
,
(A4)
where fH2O and fCs2SO4 are the scattering form factors per molecule and can be approximated by using the tabulated, individual atom scattering factors (see TableI). For instance,
fH2
2O≈2f
2
H+fO2on the ground that the scattering angle 2θ
is considered large enough, hence the scattering from the H2O
molecule is the incoherent sum of the scattering from the individual atoms (f2
Hfor a hydrogen atom andfO2for an oxygen
atom).
Similarly, the fluorescent signals from the Cs bulk solution (i.e., Cs2SO4 solution) can be handled in the same manner.
The angular Cs fluorescent intensity,Ifluo(αi), is expressed as
follows:
Ifluo(αi)=ηfluo0A0[Cs+]T(αi)D(αi)
Cs2SO4solution
, (A5)
where the constant ηfluo represents the EDD detecting
effi-ciency of the x-ray photon energy at the Cs emission line energy (4.2–5.3 keV forLα,Lβ, andLγ). Both constantsηsc
andηfluo can be calibrated with the pure subphase solution
of known concentrations [see Figs.5(a)and5(b)in the main text].
Figure 9 shows the two important functions, T(αi) and
D(αi), with αi being normalized to the critical angle for
total reflection of water (denoted asαc,water) againstαi. For
dilute salt solution, these two functions are nearly identical to their counterparts of water. For Cs2SO4 solution at high
concentration, the two relevant x-ray optical properties for the media are significantly different from water, shown in TableII, which result in the conspicuous difference in theT(αi) and
D(αi). With the knownT(αi) andD(αi) for the known media
(i.e., water and Cs2SO4 solution), the only parameter to be
determined experimentally isηsc. The scattering factors for all
constituent atoms in the x-ray path are given in TableI. Theηsc
[image:10.608.312.560.119.169.2]IONIC DEPLETION AT THE CRYSTALLINE GIBBS . . . PHYSICAL REVIEW MATERIALS1, 076002 (2017)
matrix method [34], which treats each layer as a chemically distinct slab where all constituent elements are homogeneously distributed, are carried out to calculate how x-ray waves propagate, reflect, and attenuate within each layer, depending on the electron density and absorption coefficient for particular chemical compositions.
2. Multi-interfaces representing surface structures
The matrix method [34] is employed to determine the x-ray propagation within the stratified media, as shown in Fig. 6. The incident x-ray plane wave of unit amplitude, traveling in medium 0 (i.e., vapor phase) down into the multilayer is expressed as exp(iωt−k||,0·r||−kz,0z), where
k0=(|k||,0|2+kz,20)1
/2=2π/λ, withk
0being the wave
num-ber of x-rays in medium 0 (vapor phase). The amplitude of the reflected wave (r; exiting the multilayer back into the vapor phase) and the transmitted wave (t, into the subphase, medium III) shown in Fig.6(c)can be expressed in a matrix operation:
1
r
=
p0−I m0−I
m0−I p0−I
×
e−ikz,I I 0 0 eikz,I I
×
pI−II mI−II mI−II pI−II
×
e−ikz,II II 0 0 eikz,II II
×
pII−III mII−III mII−III pII−III
×
t
0
, (A6)
where
pi,j =
kz,i+kz,j 2kz,i
, mi,j =
kz,i−kz,j 2kz,i
,
and
kz,j =12
Q2
z−8k02δj +i8k20βj, (A7) whereδj =2πρe,jr0/k20andβj =μj/2k0(i, j =0,I,II,III).
The reflectivityR equals|r|2 and the intensity transmission
coefficientT equals|t|2. Within each layer, the electric field
E(z,r||,t) can be considered as the sum of the wave traveling down and up, as indicated in Fig. 6, and the amplitude of the field is the sum of the two items corresponding to wave down (z+) and up (z−), i.e.,|E(z)| = |E(+) exp(−ikz,jz)+
E(−) exp(ikz,jz)|, whereE(+) andE(−) are the amplitude of each and can be determined based on the boundary conditions; a matrix approach similar to Eq. (A6) [34].
We first consider the hypothetical case where both Cs and water are absent in the top two media shown in Fig.6. The top layer (medium I) is considered as exclusively PEG and is characterized withμIandρe,Iwhich are derived from the bulk
properties of PEG and are listed in TableII. The thickness of the layer is denoted as Ias depicted in Fig.2(b). Here Iis a
variable parameter. The second layer (medium II) is considered as a mixture of PEG and Au. The AuNPs are regarded as an array of monodisperse pure gold spheres of diameterD(the mean value is used based on the SAXS measurement). Thus the total volume of gold is considered as distributed throughout layer II with PEG. The correspondingμII andρe,II are then
dependent on the thickness II. The layer of PEG attached
to the AuNPs in contact with the solution is considered as the same as the aqueous subphase regarding the x-ray optical properties.
Now, in the presence of the Cs, depending on the specific scheme, the concentration of Cs modifies the (μI, ρe,I) and
(μII, ρe,II) by which the electric field in the respective media
can be determined. Finally, the water can be incorporated into media I and II assuming both have certain PEG volume fraction (denotedVPEG%).
APPENDIX B: SUMMARY OF PREVIOUS RESULTS ON BRUSH POLYMERS
The main parameters of the model areN, the number of Kuhn lengths;b, the Kuhn length;σ, the grafting density; and
D=2R, the core nanoparticle diameter, whereRis the radius. In our previous study [11], we established that the grafted NPs in solution have a hydrodynamic diameterDh:
Dh
D
2
=1+4N b
D (σ b
2)1/2(2w 0)1/4.
Using the parameters b=0.724 (nm), σ =1.51 chains/nm2, w
0= 16(a dimensionless three-body interaction),
N=68.5. ForR=5 nm, this givesDh=38 nm, which is in good agreement with the value of 40 nm obtained by light scattering in our previous study [11].
Thus, if we assume II≈D=10 nm, then III≈(Dh−
D)/2=15 nm. The fact that our experimental data are consistent with I < III clearly shows that the PEG chains
are highly compressed in the air-water interface, as previously pointed out in Ref. [37].
[1] G. M. Whitesides and B. Grzybowski, Self-assembly at all scales,Science295,2418(2002).
[2] D. Nykypanchuk, M. M. Maye, D. van der Lelie, and O. Gang, DNA-guided crystallization of colloidal nanoparticles,Nature (London)451,549(2008).
[3] S. Y. Park, A. K. R. Lytton-Jean, B. Lee, S. Weigand, G. C. Schatz, and C. A. Mirkin, DNA-programmable nanoparticle crystallization,Nature (London)451,553(2008).
[4] R. J. Macfarlane, B. Lee, M. R. Jones, N. Harris, G. C. Schatz, and C. A. Mirkin, Nanoparticle superlattice engineering with DNA,Science334,204(2011).
[5] S. Srivastava, D. Nykypanchuk, M. Fukuto, and O. Gang, Tunable nanoparticle arrays at charged interfaces,ACS Nano
8,9857(2014).
[6] S. Srivastava, D. Nykypanchuk, M. Fukuto, J. D. Halver-son, A. V. Tkachenko, K. G. Yager, and O. Gang, Two dimensional DNA-programmable assembly of nanopar-ticles at liquid interfaces, J. Am. Chem. Soc. 136, 8323
(2014).
[7] W. Wang, H. Zhang, I. Kuzmenko, S. Mallapragada, and D. Vaknin, Assembling bare Au nanoparticles at positively charged templates,Sci. Rep.6,26462(2016).
[8] M. J. Campolongo, S. J. Tan, D. M. Smilgies, M. Zhao, Y. Chen, I. Xhangolli, W. Cheng, and D. Luo, Crystalline Gibbs monolayers of DNA-capped nanoparticles at the air-liquid interface,ACS Nano5,7978(2011).
[9] S. J. Tan, J. S. Kahn, M. J. Campolongo, M. Zhao, D. M. Smilgies, and D. Luo, Crystallization of DNA-capped gold nanoparticles in high-concentration, divalent salt environments,
Angew. Chem., Int. Ed.53,1316(2014).
[10] H. Zhang, W. Wang, N. Hagen, I. Kuzmenko, M. Akinc, A. Travesset, S. Mallapragada, and D. Vaknin, Self-assembly of DNA functionalized gold nanoparticles at the liquid–vapor interface,Adv. Mater. Interfaces3,1600180(2016).
[11] H. Zhang, W. Wang, S. Mallapragada, A. Travesset, and D. Vaknin, Macroscopic and tunable nanoparticle superlattices,
Nanoscale9,164(2017).
[12] H. Zhang, W. Wang, S. Mallapragada, A. Travesset, and D. Vaknin, Assembling and ordering polymer-grafted nanoparticles in three dimensions,Nanoscale9,8710(2017).
[13] H. Zhang, W. Wang, S. Mallapragada, A. Travesset, and D. Vaknin, Ion-specific interfacial crystallization of polymer-grafted nanoparticles,J. Phys. Chem. C121,15424(2017). [14] H. D. Willauer, J. G. Huddleston, and R. D. Rogers, Solute
par-titioning in aqueous biphasic systems composed of polyethylene glycol and salt: The partitioning of small neutral organic species,
Ind. Eng. Chem. Res.41,1892(2002).
[15] J. G. Huddleston, H. D. Willauer, and R. D. Rogers, Phase diagram data for several PEG+salt aqueous biphasic systems at 25◦C,J. Chem. Eng. Data48,1230(2003).
[16] Partitioning in Aqueous Two-Phase System: Theory, Methods, Uses, and Applications to Biotechnology, edited by H. Walter, D. E. Brooks, and D. Fisher (Academic Press, Orlando, 1985).
[17] D. Vaknin, X-ray diffraction and spectroscopic techniques for liquid surfaces and interfaces, inCharacterization of Materials, edited by E. N. Kaufmann (John Wiley & Sons, New York, 2012), Vol. 2, pp 1393–1423.
[18] D. Vaknin and W. Bu, Neutrally charged gas/liquid interface by a catanionic Langmuir monolayer,J. Phys. Chem. Lett.1,1936
(2010).
[19] W. Wang, I. Kuzmenko, and D. Vaknin, Iron near absorption edge x-ray spectroscopy at aqueous-membrane interfaces,Phys. Chem. Chem. Phys.16,13517(2014).
[20] Z. T. Graber, W. Wang, G. Singh, I. Kuzmenko, D. Vaknin, and E. E. Kooijman, Competitive cation binding to phosphatidylinositol-4, 5-bisphosphate domains revealed by x-ray fluorescence,RSC Adv.5,106536(2015).
[21] K. Rahme, L. Chen, R. G. Hobbs, M. A. Morris, C. O’Driscoll, and J. D. Holmes, PEGylated gold nanoparticles: Polymer quantification as a function of PEG lengths and nanoparticle dimensions,RSC Adv.3,6085(2013).
[22] J. H. Hubbel, P. N. Trehan, N. Singh, B. Chand, D. Mehta, M. L. Garg, R. R. Garg, S. Singh, and S. Puri, A review, bibliography, and tabulation ofK,L, and higher atomic shell x-ray fluorescence yields, J. Phys. Chem. Ref. Data 23, 339
(1994).
[23]X-Ray Data Booklet, edited by A. C. Thompson (Lawrence Berkeley National Laboratory, University of California, Berke-ley, 2009).
[24] https://www.nist.gov/pml/xcom-photon-cross-sections-database.
[25] W. Wang, W. Sung, M. Ao, N. A. Anderson, D. Vaknin, and D. Kim, Halide ions effects on surface excess of long chain ionic liquids water solutions,J. Phys. Chem. B117,13884(2013). [26] J. Als-Nielsen and D. McMorrow,Elements of Modern X-Ray
Physics(John Wiley & Sons, New York, 2011).
[27] P. S. Pershan and M. L. Schlossman, Liquid Surfaces and Interfaces: Synchrotron X-Ray Methods(Cambridge University Press, Cambridge, 2012).
[28] M. Tolan, X-Ray Scattering from Soft-Matter Thin Films: Materials Science and Basic Research(Springer-Verlag, Berlin, 1999).
[29] J. A. Bearden, X-ray wavelengths, Rev. Mod. Phys. 39, 78
(1968).
[30] E. Sloutskin, J. Baumert, B. M. Ocko, I. Kuzmenko, A. Checco, L. Tamam, E. Ofer, T. Gog, O. Gang, and M. Deutsch, The surface structure of concentrated aqueous salt solutions,
J. Chem. Phys.126,054704(2007).
[31] W. Wang, N. S. Murthy, I. Kuzmenko, N. Anderson, and D. Vaknin, Structure of biodegradable films at aqueous surfaces: X-ray diffraction and spectroscopy studies of polylactides and tyrosine-derived polycarbonates,Langmuir29,11420(2013). [32] Y. Marcus,Ion Solvation(Wiley, Chichester, 1985).
[33] N. Koizumi and T. Hanai, Dielectric properties of polyethylene glycols : Dielectric relaxation in solid state,Bull. Inst. Chem. Res., Kyoto Univ.42, 115 (1964).
[34] A. Gibaud, Specular reflectivity from smooth and rough surfaces, in X-Ray and Neutron Reflectivity: Principles and Applications, edited by J. Daillant and A. Gibaud (Springer-Verlag, Berlin, Heidelberg, 1998).
[35] N. S. Murthy, W. Wang, and J. Kohn, Microphase sep-aration in copolymers of hydrophilic PEG blocks and hydrophobic tyrosine-derived segments using simultaneous SAXS/WAXS/DSC,Polymer51,3978(2010).
[36]International Tables for Crystallography (Volume C): Mathe-matical, Physical and Chemical Tables, edited by A. J. C. Wilson (Kluwer Academic Publishers, Dordrecht, 1992).
[37] Z. A. Zell, L. Isa, P. Ilg, L. G. Leal, and T. M. Squires, Adsorption energies of poly(ethylene oxide)-based surfactants and nanoparticles on an air-water surface, Langmuir30, 110