Vol.3, No1, February 2013
Performance Evaluation of Round Robin and
Proportional Fair Scheduling Algorithms for Constant
Bit Rate Traffic in LTE
Swetha1, Mohankumar N M2 , Devaraju J T3 1, 2, 3
Department of Electronic Science Bangalore University
Bangalore, India
Abstract— Scheduling is a key Radio Resource Management
(RRM) mechanism for realizing Quality of Service (QoS) requirements and optimizing system performance of Long Term Evolution (LTE) network. Scheduling is the process of dynamically allocating physical resources to User Equipments (UEs) based on scheduling algorithms implemented at the LTE base station. Various algorithms have been proposed by network designers/researchers as the implementation of scheduling algorithm is an open issue in LTE standard. The choice of scheduling algorithm critically impacts resource utilization and the overall performance of LTE network. This paper makes an attempt to study and compare the performance of Round Robin (RR) and Proportional Fair (PF) scheduling algorithms for Constant Bit Rate (CBR) traffic scenario. Performance metrics considered for simulation studies are throughput, delay and jitter.
Keywords-LTE; QoS; Scheduling; Round Robin; Proportional Fair
I. INTRODUCTION
Long Term Evolution (LTE) is a broadband wireless access network offering a rich suite of multimedia applications such as 3D videoconferencing [1], mobile HD TV and real time streaming videos at very high vehicular speeds. These applications have heterogeneous Quality of Service (QoS) requirements such as priority, transmission delay, jitter, packet loss rate, packet error rate etc., to provide better user experience. QoS provisioning offers a challenge for the LTE network designers to efficiently utilize the limited available radio resources in a highly fading wireless medium. In order to meet this challenge, LTE standard incorporates Radio Resource Management (RRM) mechanisms such as Call Admission Control (CAC), scheduling etc., which are open issues for designers. Scheduling is a crucial RRM mechanism which divides and allocates radio resources among different users while maintaining QoS to optimize system performance.
The scheduling in both downlink and uplink is carried out by scheduler present at the Medium Access Control (MAC) sublayer of eNodeB (eNB). Since scheduling algorithm for eNB MAC scheduler is not standardized, LTE network designers have proposed scheduling algorithms which results in
significantly different levels of user and system performance. Hence in this paper an attempt has been made to evaluate the performance of Round Robin (RR) and Proportional Fair (PF) scheduling algorithms for Constant Bit Rate (CBR) traffic scenario using QualNet network simulator.
The rest of the paper is organized as follows. Section II gives a brief insight of LTE system overview and Section III describes QoS and Evolved Packet System (EPS) Bearers. RR and PF scheduling algorithms in LTE are described in Section IV. Simulation studies and results are given in section V and Section VI concludes the paper.
II. LTESYSTEM OVERVIEW
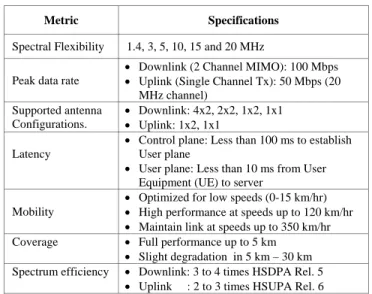
LTE, developed by Third Generation Partnership Project (3GPP), is designed to support ubiquitous delivery of multimedia services with IP-based network architecture and Orthogonal Frequency Division Multiple Access (OFDMA) based air-interface technology. The air-interface related attributes of the LTE Rel-8 are summarized in Table I.
TABLE I. LTEPERFORMANCE SPECIFICATIONS
Metric Specifications Spectral Flexibility 1.4, 3, 5, 10, 15 and 20 MHz
Peak data rate
• Downlink (2 Channel MIMO): 100 Mbps • Uplink (Single Channel Tx): 50 Mbps (20
MHz channel) Supported antenna Configurations. • Downlink: 4x2, 2x2, 1x2, 1x1 • Uplink: 1x2, 1x1 Latency
• Control plane: Less than 100 ms to establish User plane
• User plane: Less than 10 ms from User Equipment (UE) to server
Mobility
• Optimized for low speeds (0-15 km/hr) • High performance at speeds up to 120 km/hr • Maintain link at speeds up to 350 km/hr Coverage • Full performance up to 5 km
• Slight degradation in 5 km – 30 km Spectrum efficiency • Downlink: 3 to 4 times HSDPA Rel. 5
Vol.3, No1, February 2013
Evolved Packet Core
E-UTRAN PGW SGW MME eNB UE Other IP networks
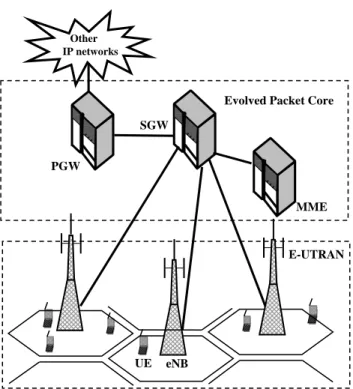
The architecture of LTE is termed as EPS which consists of Evolved Packet Core (EPC) and Evolved-Universal Terrestrial Radio Access Network (E-UTRAN) as shown in Fig. 1[2, 3].
Figure 1. Simplified LTE architecture
EPC is an IP-based core network responsible for providing access to both 3GPP and non-3GPP technologies. The functionality of EPC includes mobility management, charging, authentication and setup of end-to-end connections. In order to accomplish these functionalities, EPC consists of logical nodes such as Mobility Management Entity (MME), Serving Gate Way (SGW) and Packet data network Gate Way (PGW).
The E-UTRAN is responsible for the RRM mechanisms such as scheduling, CAC, retransmission protocols, coding, power control, handover and various multi-antenna schemes [4]. It contains single type of network element called eNB, which act as the terminal point for all radio communications carried out by the User Equipment (UE). Also, eNB relays data flows between the radio connection and the EPC network.
III. QUALITY OF SERVICE AND EPSBEARERS
QoS is the concept of providing a particular quality guarantee for a specific type of service. Since LTE is an all IP network, QoS provisioning becomes one of the greatest challenges for providing a range of IP-based services like VoIP, FTP etc. In order to provide QoS, LTE has defined EPS bearer which uniquely identifies a packet flow that would receive common QoS treatment between the UE and the gateway [5, 6]. Multiple bearers can be established for a user in order to provide different QoS streams or connectivity to different packet data networks.
Bearers can be classified into two categories: Guaranteed Bit Rate (GBR) bearers and Non-GBR bearers based on the nature of the QoS requirements to support multiple applications in UE at any time.
GBR: For GBR bearers, dedicated transmission resources are permanently allocated at bearer establishment or modification. Bit rate higher than the GBR called Maximum Bit Rate (MBR) may be allowed for a GBR bearer if resources are available.
Non-GBR: For non-GBR bearers, no bandwidth resources are allocated permanently, hence they do not guarantee any particular bit rate.
The EPS QoS concept is class-based, wherein each bearer is assigned a scalar QoS Class Identifier (QCI). The QCI specifies the packet forward treatment associated with bearer. The standardized QCI characteristics for the bearer traffic between UE and the gateway are specified in terms of bearer type (GBR or non-GBR), priority, packet delay budget, and packet error loss rate [7]. Standardized QCIs for LTE are given in Table II.
TABLE II. STANDARDIZED QCIS FOR LTE
QCI Bearer Type Priority Packet Delay Budget (ms) Packet Error Loss Rate Example Services 1 GBR 2 100 10-2 Conversational voice 2 GBR 4 150 10-3 Conversational video (live streaming) 3 GBR 5 300 10-6 Non-conversational video (buffered streaming) 4 GBR 3 50 10-3 Real-time gaming 5 Non-GBR 1 100 10 -6 IMS signaling 6 Non-GBR 7 100 10 -3
Voice, video (live streaming), interactive gaming 7 Non-GBR 6 300 10 -6 Video (buffered streaming) 8 Non-GBR 8 300 10-6 TCP-based (e-mail), chat, FTP, p2p file sharing, progressive video etc. 9 Non-GBR 9 300 10 -6
IV. ROUND ROBIN (RR) AND PROPORTIONAL FAIR (PF) SCHEDULING ALGORITHMS IN LTE
Scheduling algorithm is employed to select different users in time domain and different Physical Resource Blocks (PRBs) in frequency domain depending on the channel conditions and bandwidth requirements of the user while ensuring fairness, stability and throughput optimality [8]. Several scheduling algorithms have been designed for efficient scheduling based on the following three properties: low complexity, bounded delay and fairness to optimize system performance [9]. In this section, RR and PF scheduling algorithms are described.
Vol.3, No1, February 2013
A. Round Robin (RR):
RR scheduling algorithm maintains a constant delay between two transmissions to the same user. This is an advantage for modern voice and video communications which have strict delay requirements. RR scheduling algorithm also has the advantage of reduced overhead, since the eNB does not need to sacrifice transmission time to inform the users in every block about their allocated slot positions [10].
B. Proportional Fair (PF):
The PF scheduling algorithm provides a good tradeoff between system throughput and fairness by selecting the user with highest instantaneous data rate relative to its average data rate. However, in every block PF scheduler informs the UEs about their allotted slot positions of radio resources thus increasing scheduler complexity and overhead.
V. SIMULATION STUDIES AND RESULTS
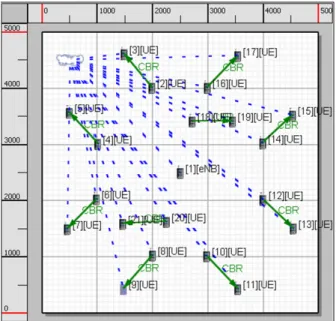
The performances of RR and PF scheduling algorithms for CBR traffic are evaluated using QualNet 5.2 simulator by considering an eNB and ten pairs of UEs in a single cell environment. Two ray path loss model with lognormal shadowing is considered for the simulation studies. The remaining simulation parameters are listed in Table III.
TABLE III. SIMULATION PARAMETERS
Property Value Simulation-Time 20S Simulation-Area 5Km X 5Km Propagation-Channel-Frequency 2.4GHz Propagation-Model Statistical Shadowing mean 4dB Channel-Bandwidth 10MHz Propagation-Speed 3x10⁸ mps
Antenna-Model Omni directional
Round-Robin MAC-LTE-Scheduler-Type Proportional-Fairness PHY-LTE-Tx-Power 46dBm PHY-LTE-Num-Rx-Antennas 2 Antenna-Height 15m Antenna-Gain 14dB eNB parameters MAC-LTE-Transmission-Mode 1(SIMO) MAC-LTE-Scheduler-Type Simple-Scheduler PHY-LTE-Tx-Power 23dBm PHY-LTE-Num-Rx-Antennas 1 Antenna-Height 1.5m UE parameters Antenna-Gain 0.0dB
The snapshot of the scenario designed for simulation study using QualNet 5.2 simulator is shown in Fig. 2.Following subsections describe the performance of RR and PF scheduling algorithms in two different scenarios.
A. Scenario 1: No fading without and with mobility
In this scenario, a CBR connection is established between each pair of stationary UEs in a no fading environment. Simulation has been carried out with the data rate of 200Kbps
for each CBR connection and performance metrics such as aggregate throughput, average end-to-end delay and average jitter of connections are recorded. Simulation studies are repeated by changing the data rate of each CBR connections insteps of 200Kbps up to 2Mbps and further insteps of 1Mbps up to 4Mbps.
Figure 2. Snapshot of the Scenario designed for simulation study
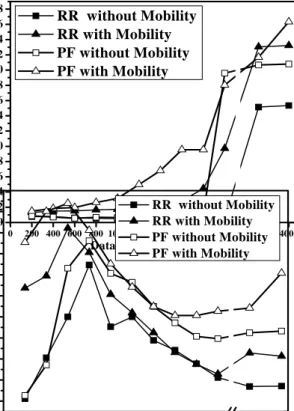
In order to analyze the effect of mobility on performance metrics in no fading environment, simulation studies are repeated by enabling random mobility of 100Kmph to all the UEs. Fig. 3 shows the plot of aggregate throughput for different CBR data rates in no fading environment.
Vol.3, No1, February 2013 0 200 400 600 800 1000 1200 1400 1600 1800 2000 3000 4000 0.00 0.02 0.04 0.06 0.08 0.10 0.12 0.14 0.16 0.18 0.20 0.22 0.24 0.26 0.28 RR without Mobility RR with Mobility PF without Mobility PF with Mobility Delay ( sec) Data rate (Kbps) 0.0010 0.0015 0.0020 0.0025 0.0030 0.0035 0.0040 0.0045 0.0050 0.0055 RR without Mobility RR with Mobility PF without Mobility PF with Mobility Jit ter (s ec) 0 200 400 600 800 1000 1200 1400 1600 1800 2000 3000 4000 0 2000 4000 6000 8000 10000 12000 14000 16000 18000 20000 22000 RR without Mobility RR with Mobility PF without Mobility PF with Mobility Th rou g hput (K b p s) Data rate (Kbps) 0 200 400 600 800 1000 1200 1400 1600 1800 2000 3000 4000 0.00 0.05 0.10 0.15 0.20 0.25 0.30 RR without Mobility RR with Mobility PF without Mobility PF with Mobility D ela y ( sec) Data rate (Kbps) 0 200 400 600 800 1000 1200 1400 1600 1800 2000 3000 4000 0 2000 4000 6000 8000 10000 12000 14000 16000 18000 20000 Th roughput (K b p s) Data rate (Kbps) RR without Mobility RR with Mobility PF without Mobility PF with Mobility
Figure 3. Aggregate throughput performance for different CBR data rates in no fading environment
It is observed from Fig. 3 that the throughput performance of both RR and PF scheduling algorithms is similar for lower data rates (up to 1.8Mbps) and RR performs better for higher data rates. The graph shows that the aggregate throughput for both scheduling algorithms saturates for higher data rates as PRBs required by individual users increases with data rate leading to scarcity of resource blocks [11][12]. Also, the overall throughput performance of RR is better than PF in no fading environment, since RR scheduling algorithm does not have an additional overhead of allocating resources dynamically depending on channel conditions which is present in PF scheduling algorithm [10].
It is also observed that both RR and PF scheduling algorithms perform better for the UEs moving at vehicular speed than stationary UEs. Since UEs at the cell edge move towards better Modulation and Coding Scheme (MCS) regions and thus improving the overall throughput performance [13].
Figure 4. Average delay performance for different CBR data rates in no fading environment
Figure 5. Average jitter performance for different CBR data rates in no fading environment
The average delay and jitter performance of RR and PF scheduling algorithms for different CBR data rates in no fading environment are shown in Fig. 4 & 5 respectively. The delay and jitter performance of RR scheduling algorithm is better than the PF, since resource allocation remains constant for CBR connections. At higher data rates, there is an increase in the number of PRBs required by individual user which leads to an additional delay [11].
B. Scenario 2: Rayleigh fading without and with mobility Retaining all the parameters of scenario 1, Rayleigh fading environment has been introduced in scenario 2 to study the effect of fading on performance of RR and PF scheduling algorithms. Simulation studies are repeated by considering same metrics as in scenario 1. Fig. 6 shows the plot of aggregate throughput for different CBR data rates in Rayleigh fading environment.
Figure 6. Aggregate throughput performance for different CBR data rates in Rayleigh fading environment
Fig. 6 depicts that the aggregate throughput performance of RR and PF scheduling algorithms in Rayleigh fading environment follows a similar trend as observed in no fading environment. It is observed (Fig. 3 & 6) that the throughput performance of RR scheduling algorithm in Rayleigh fading environment is marginally higher than in no fading environment. Further, RR scheduling algorithm outperforms
PF scheduling algorithm in no fading and Rayleigh fading environment.
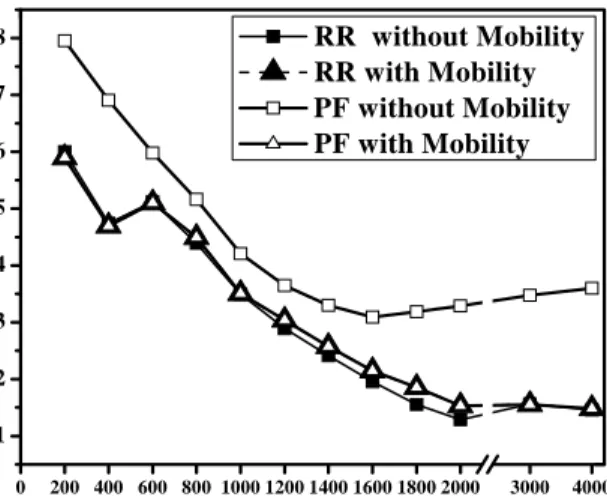
Figure 7. Average delay performance for different CBR data rates in Rayleigh fading environment
Vol.3, No1, February 2013 0 200 400 600 800 1000 1200 1400 1600 1800 2000 3000 4000 0.001 0.002 0.003 0.004 0.005 0.006 0.007 0.008 RR without Mobility RR with Mobility PF without Mobility PF with Mobility Ji tt er (s ec ) Data rate (Kbps)
Figure 8. Average jitter performance for different CBR data rates in Rayleigh fading environment
The average delay and jitter performance of RR and PF scheduling algorithms for different CBR data rates in Rayleigh fading environment are shown in Fig. 7 & 8 respectively.
From the Fig. 4, 5, 7 & 8, it is observed that the delay and jitter performance of RR scheduling algorithm is marginally better in no fading environment than in Rayleigh fading environment. It is also observed that the delay and jitter performances of RR scheduling algorithm is better than that of PF scheduling algorithm in no fading and Rayleigh fading environment.
VI. CONCLUSION
In this paper, performance of RR and PF scheduling algorithms in LTE network is compared through simulation studies considering throughput, delay and jitter as performance metrics. The simulation results show that the performance of RR is better than PF for various CBR data rates for stationary as well as UEs at vehicular mobility, in no fading and fading environment.
ACKNOWLEDGMENT
Authors would like to thank UGC for providing Junior Research Fellowship under ‘At Any One Given Time Basis Scheme’ to carry out the research work.
Authors would also thank Nihon Communications Bangalore for their technical support.
REFERENCES
[1] Luis Pérez, Luis Velasco, Juan Rodríguez, Pedro Capelastegui, Guillem Hernández-Sola, Lorena Calavia, Antonio Marqués, Borja Iribarne, Amador Pozo and Antoine De Poorter, “Network convergence and QoS for future multimedia services in the VISION project”, Computer Networks 56, 1183–1199, DOI:10.1016/j.comnet.2011.11.018, 2012. [2] 3GPP TS 36.300, “E-UTRA and E-UTRAN Overall Description”,
v8.4.0, (2008-03).
[3] Erik Dahlman, Stefan Parkvall and Johan Sköld, “4G LTE/LTE-Advanced for Mobile Broadband”, Copyright © 2011
[4] 3GPP TS 36.133, “Evolved Universal Terrestrial Radio Access (E-UTRA) Requirements for support of radio resource management”, v8.1.0, (2008-03).
[5] M. Corici, F. Gouveia and T. Magedanz, “A Network Controlled QoS Model over the 3GPP System Architecture Evolution,” Proceedings of the 2nd International Conference on Wireless Broadband and Ultra Wideband Communications, 2007
[6] Li Li and Subin Shen, “End-to-End QoS performance management across LTE networks” Network Operations and Management Symposium (APNOMS), 2011
[7] S. M. Chadchan and C. B. Akki, “3GPP LTE/SAE: An Overview”, International Journal of Computer and Electrical Engineering, Vol. 2, No. 5, October, 2010, Pp(s):1793-8163.
[8] Preethi Chandur, Karthik R.M and Krishna M. Sivalingam, “Performance Evaluation of Scheduling Algorithms for mobile WiMAX”, IEEE International Conference on Pervasive Computing and Communications Workshops , 2012,Pp(s): 764 – 769
[9] Xin Y uan and Zhenhai Duan ,“FRR: a Proportional and Worst-Case Fair Round Robin Scheduler”, Proceedings of IEEE INFOCOM, ISBN: 0-7803-8968-9, DOI : 10.1109/INFCOM.2005.1498314, vol. 2, Page(s): 831 - 842
[10] Claude Simon and Geert Leas “Round-Robin scheduling for time-varying channel with limited feedback”, IEEE 10th workshop on signal processing advances in wireless communication, 2009, ISBN-978-1-4-4244-3695-8, DOI: 10.1109/SPAWC.2009.5161781, Pp(s): 231-234 [11] M. Saad ElBamby and Khaled M. F. Elsayed, “A Transportation
Problem based Resource Allocation Scheme for an LTE-Advanced System with Carrier Aggregation”, IFIP Wireless Days, 2012, Pp(s): 1 - 6, ISBN: 978-1-4673-4402-9, DOI: 10.1109/WD.2012.6402869 [12] Juan J. Sánchez, D. Morales-Jiménez, G. Gómez, J. T. Enbrambasaguas,
“Physical Layer Performance of Long Term Evolution Cellular Technology”, 16th IST Mobile and Wireless Communications Summit, 2007, Pp(s):1-5, ISBN: 963-8111-66-6, DOI: 10.1109/ISTMWC.2007.4299090
[13] F. Capozzi, G. Piro, L. Grieco, G. Boggia and P. Camarda, “Downlink Packet Scheduling in LTE Cellular Networks: Key Design Issues and a Survey”, IEEE Communications Surveys & Tutorials, Pp(s): 1-23, DOI: 10.1109/SURV.2012.060912.00100
AUTHORS PROFILE
Swetha received M.Sc degree from Bangalore
University. Now she is pursuing her PhD in the Department of Electronic science, Bangalore University. Her interests include New Generation Mobile Networks, Embedded Systems and Networking.
MohanKumar N. M. received M.Sc degree from
Bangalore University. Now he is pursuing his PhD in the Department of Electronic science, Bangalore University. His interests include Long Term Evolution networks and Wireless Sensor Networks.
Devaraju J. T. is working as an Associate Professor
at Department of Electronic Science, Bangalore University. He received his Ph.D. degree from Bangalore University. His research interests include Embedded Systems, Wireless Networks and Chalcogenide glasses. He has worked as a member for several committees. He and his research team are working on Wireless Networks protocols.