Harmonization with Variable Speed Limits on
Motorways
Per Strömgren
1, 2and Gunnar Lind
21Royal Institute of Technology (KTH), Division of Transport planning, Economics and Engineering, SE-100 44 Stockholm.
2Movea Trafikkonsult AB, SE-117 37 Stockholm, Sweden [email protected], [email protected], [email protected]
Abstract
This paper presents an investigation and a state-of-the-art description of traffic effects of harmonization with variable speed limits.
Expansion of the E4 south of Stockholm has been carried out during the years 2009-2013. The expansion includes a rearranged lane configuration within the existing road section (25 m) and traffic management systems. Previous design with two lanes and hard shoulder has been replaced with three lanes without shoulder. In addition, the road has been equipped with variable speed limits (with red ring); queue warning system with recommended speed (without red ring) and emergency refuge areas (ERAs).
The queue warning functionality was activated in 2011 and harmonization in 2013. Reduced speed variance is an important goal for the traffic management system and is considered to both reduce rear-end collisions and the risk of capacity breakdown.
German experience shows that harmonization affects capacity down to about 80 kph. English experience is that the harmonization and monitoring can reduce accidents by 40 % at normal speed of 70 mph (112 kph). Germany and England decrease the speed with approximately 20 kph at the degree of saturation of 0.7 to let the flow be harmonized before the traffic density has increased too much. Two different models of harmonization have been developed and one of them implemented on the E4 south of Stockholm. The model in field-tests has been iteratively designed and ultimately set to 325 vehicles/5 min across all lanes, with speed limit is reduced to 80 kph, which has worked well.
Keywords: Harmonization, Variable Speed Limits, Motorway, Capacity Volume 15, 2016, Pages 664–675
ISEHP 2016. International Symposium on Enhancing Highway Performance
1
Introduction
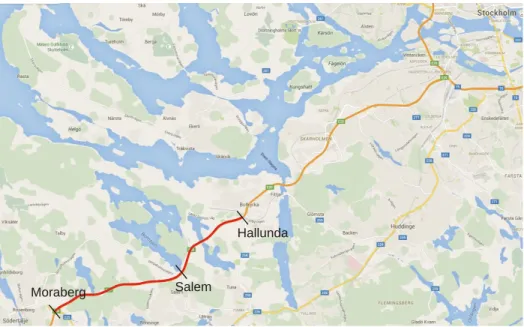
On the Södertälje motorway (E4 Södertälje-Stockholm), see Figure 1, harmonization has been tested, the speed limit is normally 100 kph, which means that one cannot expect the same great effects as measured in other countries.
Figure 1: The E4 Södertälje motorway with the project between interchange Hallunda and interchange Moraberg and the interchange Salem in between.
Once the queues formed, which normally means speeds below 60 kph, it is no longer possible to influence the flow. It is therefore important to quickly reduce speed as a preventive measure before the queues is formed. The reconfiguration of the E4 Södertälje motorway lasted for 2009-2012. The reconfiguration includes a rearranged lane configuration within the existing road section (25 m) and a new motorway control systems (MCS). The motivation for traffic to be controlled is that on Friday and Sunday afternoons and during the major holidays there is big risk for congestion, long queues and rear-ends collisions.
Earlier design with two lanes (3.75 m width) and shoulder (2.5 m width) per direction is replaced with three lanes (3.5 m width) and a variable narrow shoulder. Additionally the road is equipped with queue warning system (recommended speed), dynamic speed limits (with a red ring), new lighting and lay-bys (ERAs). The detector sites and sign gantry is spaced between 250 and 350 m on the 10.6 km long stretch. There are 33 gantries in the south direction and 38 in the north direction. Three existing measure stations was located at Hallunda, Salem (called Aspen) and Moraberg, therefore was these points selected as evaluation sites.
The reconstruction of the E4 Södertälje motorway means a new type of motorway section with narrow shoulders where the increased accident risk is assumed to be compensated by a comprehensive traffic management system. This type of road is likely to become increasingly common on busy motorways in the future. It is therefore in the national interest to document the technical, functional, socio-economic and impact goals, so that any adjustments in the design and application can be made.
The study consisted of evaluation of extended number of lanes, variable speed limits and harmonization. The calibration of the implemented harmonization algorithm was iterative performed during an eighteen month long period.
Moraberg Salem
2
Literature review
International experience shows that dynamic speed limits (DSL) are effective on highways in the high speed environment with speed limit of 110 or 120 kph. On the other hand gives studies of lower speeds and advisory speed limits no difference in capacity and level of service (Nissan 2011). Regulation by the DSL provides increased throughput, fewer collisions and fewer capacity breakdowns (Geistefeldt 2011). When the flow reaches approximately 80 % of the capacity, roughly equivalent when average speed has dropped about 10 kph compared to free flow, the speed limit is reduced by 20 kph. There are good experiences of decreasing the speed limit to stabilize the flow from several countries (STA/Trafikverket, 2011):
• The capacity increases up to 10 % when reducing the speed limit from the free speed to 80 kph
• Personal injury accidents decrease 10-20%, severe accidents up to 50%
Kerner (Kerner, 2011) has tried to explain what is happening on a highway at high load. There are three kinds of flow; free flow, harmonized (or synchronized) flow and congestion (queues depending on capacity breakdown). Free or nearly free flow prevails at low and medium traffic up to flows of 70-80 % of the capacity limit. Then the average speed decreases. Harmonized flow means less synchronized speeds in heavy traffic, which may or may not lead to traffic collapse. Oversaturated conditions can be of two kinds:
1) Spontaneous oversaturation, which occurs on the road due to high traffic flow. Free flow prevails both upstream and downstream of the road segment, where the congestion occurs.
2) Induced oversaturation, which occurs as a result of increasing queues at a bottleneck e.g. an intersection.
Spontaneous oversaturation occurs as a function of the flow on a segment. Near the minimum capacity a relatively large disturbance of flow due to speed or density (distance control) is required for a breakdown to occur. At maximum capacity it requires only a minimal disturbance for a spontaneous collapse to occur. Kerner notes (Kerner, 2013) that the traffic management measures cannot affect queue situation once the collapse has occurred. This means, inter alia, that when 45 kph is detected by the Automatic Accident Detection (AID) algorithm and the recommended speed has been reduced to 70 kph at E4 Södertälje motorway it is already too late to prevent a collapse. It is therefore important to harmonize the flow before the queues have been formed. Queue warning with recommended speed is at this stage mainly aimed to reduce the risk of secondary accidents near the end of the queue where braking occurs.
Grumert have in an evaluation of different MCS algorithms found that the most important characteristics is, early detection of changed characteristics on the road, rapid response to changes, speed reductions should correspond to conditions on the road (not too large changes), reduced speed in as small area as possible, but large enough to give effect and an algorithm that can be applied regardless of location (Grumert, 2014).
A new method called Mainstream Traffic Flow Control (MTFC) aims to prevent substantial capacity reductions in connection with suddenly created bottlenecks and thereby increase throughput and minimize queue length and delay (Carlsson et al. 2011). Simulated cases results in reductions in travel times of up to 50 % compared to conditions without MTFC. Grumert noted in the simulated comparisons that this algorithm produced the best results of the four compared algorithms (Grumert, 2014).
Many studies indicate that harmonization of speed gives a smoother traffic flow (Garcia 2009) and higher capacity (Heydecker et. al. 2011) and attenuation of shock waves (Hegyi et. al. 2005). A study by Van Nes (Van Nes et. al. 2008) shows that lowering the speed limit has a significant impact on the speed differences between the different lanes on the highway and thus that DSL provides an increasing
homogenization of speed. Vadde (Vadde et. al. 2012) has compiled effects of harmonization from various countries, it shows increased throughput in an interval of 5-10 %, see Table 1.
Case study locations Benefits of speed harmonization
Germany [1-2] 3%–30% reduction in crashes with light property, heavy material damage and personal injury crashes
Netherland [1] 23% decrease in accidents, 4%–5% increase in vehicle throughput Minimized total time vehicle spends in network
United Kingdom [1-2] 5%–10% increase in freeway throughput, 10% decrease in collisions 28% decrease in accidents
Minnesota, United States [3] 7% increase in vehicle throughput, 20%–60% increase in speed limits Michigan, United states [3] Minimal decrease in travel time, 5% of speed is increased in freeway Table 1: Benefits of speed harmonization from past studies (Vadde et. al. 2012).
3
Capacity and accident analysis
Table 2 shows the maximum throughput at 5-, 15- and 60-minute level before and after the reconfiguration of the road at the measuring point Hallunda on E4. In May 2010 it was still a four-lane highway. In May 2011 the widening was finished with six lanes and narrow shoulders, about 0.5 m at Hallunda. The speed limit was raised again to 100 kph between Hallunda and Salem.
Max value, Hallunda north bound
Lanes, year Vehicles/5 min Vehicles/15 min Vehicles/60 min
4kf, 2010 305 875 3152 6kf, 2011 338 956 3425 6kf, 2012 338 995 3731 6kf, 2013 361 1008 3714 6kf, 2014 373 1022 3906 Diff 6kf/4kf +22% +17% +24%
Table 2: Maximum capacity before and after reconstruction in the northbound direction at Hallunda.
Another interesting question that should be highlighted is the distribution of flow between the lanes. To get the maximum performance from the three lane highway it should be a fairly large proportion that uses the right lane.
The analysis shows that 75 % of the traffic used the right lane at Moraberg in May 2010, when the road segment had two lanes. At Hallunda this had changed to a more even distribution. At Moraberg there is a significant on-ramp flow from Södertälje. At Hallunda interchange there is a significant off-ramp flow heading north and south.
An important factor to manage is the instability of flow, which affects the appearance of shock waves, speed, and in worst case accidents. In off-peak it occur relatively more single vehicle accidents than other vehicle accidents. Single accidents decreases with increasing load, while the multi-vehicle accidents increase. Several studies indicate that there is a minimum risk of accidents at 60-70 % degree of saturation. The minimum is more significant for property damage accidents than for personal injury accidents, which is explained by the high degree of rear-end collisions that occur with lower severity (Zhong et al 2005). At increasingly disturbed traffic over 60-70 % of degree of
saturation the risk of accidents increases significantly and can close to capacity limits have doubled (Zhou et al 1997).
The number of accidents during the month of may have been studied from 2010 to 2014. The number of accidents have decreased from 11 2010 to 3 2014, see Figure 2. This is a significant reduction after the implementation of the third lane and the motorway control system.
Figure 2: Number of registered unplanned events, like accidents, standstill vehicles etc. on the Södertälje motorway. Black = before widening; Red = road works started; Green = Hallunda-Salem finished; Yellow= Salem-Moraberg finished; Blue = MCS installed.
The number of accidents per year rose sharply in connection with the construction works, but returned to the previous level of about 35 injury accidents per year as the road works were completed in 2011. Since then, the accident rate decreased steadily after installation of the Motorway Control System and ERA’s in 2012- 14 and the road users’ gradual adaptation to the system. The highest number (49) occurred in 2011 when the road works was in full swing. The risk of accidents has now been more than halved compared to the previous two-lane motorway.
4
Model for harmonizing speed
The Swedish Transport Agency (Trafikverket) started trials of harmonization in spring 2013. The route E4/E20 Hallunda - Salem is expanded from two to three lanes and was operational with MCS in December 2011. The route E4/E20 Salem - Moraberg is also expanded from two to three lanes with MCS which was deployed in January 2013. A very short and simplified description of the AID algorithm in the MCS is as follow, when speed has decreased to 45 kph the AID gives the speed limit 70 kph on the VLS. When speed reaches 35 kph the speed limit on the VLS it set to 50 kph. If speed reach the level of 18 kph then 30 kph is shown on the VLS. When speed increases to 55 kph the VLS is changed to 50 kph and when it reaches 75 kph it shows 70 kph. The last threshold is 85 where the VLS go out.
New functionality in the core MCS system and in the new outstations on the road gives the opportunity to use the red ring combined with speed, i.e., the speed limit on the segment. The study on Södertäljevägen showed that the effect of the increased number of lanes is that compliance decreased from 94 % to 84 % (the definition of compliance is speed limit + 10 kph). Input in terms of number of
0 10 20 30 40 50 60
jul 09 nov 09 mar 10 jul 10 nov 10 mar 11 jul 11 nov 11 mar 12 jul 12 nov 12 mar 13 jul 13 nov 13 mar 14
Number of acciden
vehicles and speed used to create alarms to the traffic management staff in Trafik Stockholm (The Traffic Management Central (TMC) in Stockholm). The alarm triggers an action plan in the National Traffic management System (NTS) where the operator activates 80 kph on the variable lane signal (VLS). A new alarm tells you when it is time to remove the action plan and return to 100 kph. Is there an AID taken place after the harmonization this will occurs autonomous.
The first step to designing the harmonization algorithm is to analyze the capacity of the road. According to the theory above, there is a minimum and a maximum capacity where traffic breakdown occurs due to dense traffic. The maximum value can be observed from the data. The lowest value is difficult to isolate, because then one has to sort out the collapses caused by minor incidents. Instead, it is assumed that the minimum value is approximately 90 % of the maximum capacity.
Input management for each direction is divided into two segments, Moraberg – Salem and Salem- Hallunda in the north direction and Hallunda – Salem respective Salem – Moraberg in the south direction. Input collected from three locations in the beginning, middle and end of each segment of the road, called site. Three gantries per site give a total of eighteen gantries in each direction. In this case about two third of all the gantries. Three gantries have been selected at each site to minimize errors in the event of failure of the detectors and the median value is selected per site. If at least two sites reach the threshold an alarm is activated for lowering and raising speed limit within the segment. The traffic code states only the concept dense traffic. After the activation of a lower speed limit one have to wait 15 minutes before the speed can be raised, even if the input data indicates otherwise. This is to reduce the risk for rapid changes towards the road users.
Dense traffic originally defined (March 2013) as q > 350 vehicles/5 minutes (4200 vehicles/hour) results in a reduction to 80 kph. When the flow later declines to q < 300 vehicles/5 minutes (3600 vehicles/hour) and v > 78 kph the speed is raised to 100 kph again. As shown below, the algorithm gradually changed at the basis of the experience gained from the experiment.
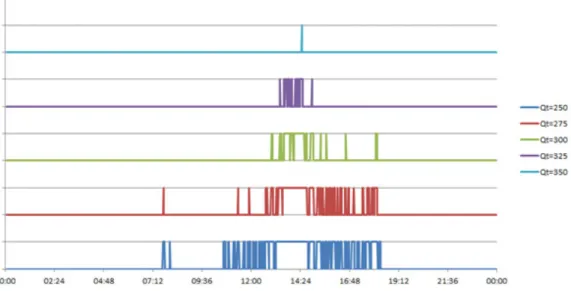
During the first months it turned out that the harmonization algorithm never had been activated. It was then questioned if the flow criterion was set to strict. To get a better basis for the selection of the activation level a study was performed to determine how often the flow criteria should have been activated dependent on the level of threshold during Easter week 2013. The analysis showed how the criteria 250, 275, 300, 325 and 350 vehicles/5 minutes turned out in the two directions. One can see on the x-axis, the actual time, when the criteria are fulfilled. Figure 3 shows the outcome at the gantry E4S 32110, i.e. Salem southbound.
With the criterion of 350 vehicles/5 minutes the flow criterion is activated only for a short time in the southbound direction the 28th of March. Guided by the figures, the recommended level of the criterion would be reduced to the level 300 vehicles/5 minutes. Then the harmonization will be activated for one or two hours at very dense traffic.
The requirement for the activation of the threshold in two sites at the same time can be discussed. It should according to our view be enough with one site. The idea of harmonization is to calm the traffic before the capacity is reached. Once oversaturated condition have occurred the capacity is reduced (so-called capacity drop) and we will not be able to register high values of flow in both ends of the segment. The criterion was lowered based on the analysis above the 12 May 2013 to 300 vehicles/5 minutes. Initial misunderstanding of the objectives, however, led to the system not being active during the summer period from May to August. This was corrected later and in September the system was back in operation.
During the project, a continuous discussion has taken place about the appropriate criteria for harmonization, in parallel with the various traffic analyzes. Trafikverket has been concerned that the speed limit would be lowered too often, and that this would lead to strong protests from the road users. The criterion was therefore relatively high 350 vehicles/5 min in relation to the recommended ratio 300-325 vehicle/5 min. Then, when practically no alarm came in during the spring of 2013 the criterion was reduced in May 2013 to 300 vehicles/5 min. Even so, no alarms were registered, which later proved to be due to handling problems at Trafik Stockholm. The system was then re-started on September 20, but then it was considered that the number of alarms got too high and already on 26 September went back to 350 vehicles/5 min.
The optimal algorithm is a balancing act between enabling too few activations and having limited impact on the incidence of queues and activations too often and then reduced respect for the system and poorer compliance. The presence of different high flows was analyzed. Below the results in the direction of Stockholm is shown for the three cross sections Moraberg, Salem (Aspen) and Hallunda in May 2013. Flows over 250 vehicles per five minute period occur about 60 hours per month, that is, two hours per day in average. The criterion of > 350 vehicles/5 minutes occur 0.3-1.1 hours per month at the three sites. This increases 4-6 times if the criterion is set to 325 vehicles/5 minutes, and an additional 3-4 times to about 10 hours per month if one lowers the criterion even further to 300 vehicles/5 minutes.
Moraberg Salem (Aspen) Hallunda Flow/5 min Vehicles Hours Vehicles Hours Vehicles Hours
> 375 1165 0.3 1927 0.4 0 0 > 350 2262 0.5 4824 1.1 1431 0.3 > 325 11658 2.8 15562 3.8 7798 1.9 > 300 42374 11.1 40772 10.5 39165 10.3 > 275 111788 31.3 98240 27.3 116287 32.8 > 250 216242 64.5 194950 58.0 223969 67.0
Table 3: Prevalence of high flows (vehicles/5 minutes) northbound during May 2013.
A better measure than the degree of saturation to describe disturbed traffic may be the relative change in the standard deviation of the average speed (1-minute values) for 5-minute periods (Abdel-Aty et. al. 2005). In case of accidents the variation in average speed upstream is often (according to Abdel-Aty et. al. 2005) significantly higher than normal 5-10 minutes before a real incident occurs. It is therefore possible to detect an increased risk if the variation in average speed is increasing. Most likely, this also has a strong connection to the fact that the congestion occurs in dense traffic.
The conditions for studying this measure, CVS (Coefficient of Variation of Speed), at the E4 Södertälje motorway have been investigated and are calculated as Equation 1;
ܥܸܵ ൌ
ௌௌௌ (1) Where:ܥܸܵ = coefficient of variation (during the last 5 minutes)
ܵܵ = standard deviation for vehicle speed (during the last 5 minutes)
ܣܵ = average speed (during the last 5 minutes) calculated according to:
ܣܵ ൌ
ே σ భ ೠ א (2) Where:ܫ = number of observations/passages during the last 5 minutes
ܰ = number of observations in the amount of ܫ and
ݑ = the individual speed observations during the last 5 minutes.
To allow a comparing analysis of the variable variance (var = SS2) for vehicle data with already aggregated data on one-minutes level (MCS-data) and five-minute levels (cross-section) has an approximate method been developed. The reason for this is that it is not possible with the existing system to have more detailed data then 1-minute harmonic average of speed and flow (no standard deviation or similar information is possible to retrieve). Data on vehicle level have of course been to prefer. Therefor more detailed data, on vehicle level, was collected via a temporary measure system. The method requires that the parameter α, the relationship between time-gap (T) and the flow and relationship between T*α and the determined variance. First the parameter α, occupancy and the average vehicle length is estimated.
ߙ ൌ
ାെ ͲǤͲͲͲͲͲ͵ͷͶ ή ܳ െ ͲǤͲͲͲͲ͵͵͵ ή ܸ ͲǤͲͲ͵͵ (3)
Where: Ƚ = Parameter = occupancy (s)
= average vehicle length during the period (m) = length of detector (m)
= Flow (vehicle/5 minutes) = speed (kph)
Comparison between α based on vehicle level and a 5-minute averaging gives an R-squared value of 0.99, which shows that the relationship is very strong. With the data on one-minute level from the MCS system it is even easier to determine the parameter α. In order to enable calculation of the CVS it is required that the variance and the correlation between time-gap and flow can be calculated as
ൌ ʹͺǤͶ ή ቀ୕ଷቁିǤଽଵ (4)
Where:
= time-gap (s) = flow (vehicle/h)
Also this relationship is strong, R-squared value of 0.99, and shows that the average time-gap (T) can be calculated from the flow during a five minute period (multiplied by the factor 12 to have
vehicle/h). Once the time-gap (T) is estimated the variance (Var) and standard deviation (SS) is determined, this is done by the following relationship
ܵܵଶൌ்ήఈିǤଵହ Ǥଶ଼ (5) Where: = variance = time-gap (s) Ƚ = parameter
The ratio of the variance (Var) and T * α gives an R-squared value of 0.91. Finally, the standard deviation (SS) is calculated as the square root of the variance. Thus, the measure CVS is calculated. High values of the CVS indicate that the risk of capacity breakdown and accidents is higher than normal. To identify variations in CVS between two time slots that may give a risk of increased contractions in the flow, two CVS periods of time are compared with each other. To find a threshold level, that not gives to many alarms and not too few, an iterative calibration were done (Movea 2015).
Historical data of May 2012 has been analyzed in detail to find unexpected speed changes. Totally during the whole May abnormal speed changes occurred during 15 days, i.e. approximately every other day. Of these 15 days, only 14 days could be analyzed, the 15th shows loss of data. Most have already been identified through the identification of incidents. Just over half, 8 occasions, are capacity breakdowns where no incident or accident was involved. Two occasions of type vehicle breakdown have a capacity reduction. Only at one occasion has an accident occurred without the CVS value increased before, indicating that it was random. Two accidents occurred a long time after the CVS value was increased and there is congestion, i.e. the accident occurred in the end of the queue.
The figure 4 below show one example of the difference between how CVS measurement and MTM/2-AID algorithm (MTM/2 is the system from the Netherlands which is used in Sweden) reacts in case of an accident.
The green curve indicates the average speed. The blue curve shows the CVS across all lanes, i.e. when the speed variation for all vehicles in all lanes is used to calculate CVS. The disturbance is strongest in the left lane (ln1, red) and the CVS measurement is very high (nearly 8 times higher than normal) around 16:28. Right lane (ln3, purple) are least affected, but CVS measure is still about four times higher than normal.
Figure 4: E4S 32110 (Salem) 120521.
In two cases, 14% of the investigated speed decreases, the accident took place without the MTM/2 AID algorithm being activated, and in one of the accidents the CVS value showed that it was a speed decrease at the time. In the second situation an accident occurs without preceded by an increased CVS value, a likely scenario is that a driver made a sudden mistake impossible to detect. In two (14%) of the situations the CVS values have increased long before the accident occurred, thus it can be concluded that it is in the queue end and due to inattention the accident occurred. In the other situations there is a rapid speed drop, but it has not been prompted by any incident or caused anyone. In five, 36%, of these situations the CVS value early shows that a speed drop is to take place and that a harmonization could mitigate this. In the remaining three, 21% of the situations, there is a very drastic speed drop, which is difficult to detect in advance.
It is obvious that the CVS measure's advantage is that it reacts to disturbances in the flow that eventually can be amplified and lead to a capacity collapse or accident. In these situations it should be possible to alleviate the effects of speed differences between vehicles. The advantage is greatest when the speed reduction does not happen so dramatically that the MTM/2 AID is activated, which occurs at 45 kph. The CVS indicator reacts up to 45 minutes faster when there are interference from braking and acceleration. If an accident occurs unexpectedly and this leads to a sudden speed drop, there is no difference between the CVS algorithm and the MTM/2 AID algorithm.
An estimation of the delay has been made based on the analyzed VH alarms. An overall estimate is made on the basis of delay per travel minute at the capacity breakdown and reduction in speed from 90 kph to 80 kph with harmonization. Comparisons have been made with the traffic model CALMAR (Strömgren 2015). CALMAR is a cell transmission model that uses input data as; number of lanes, speed limits, flow demand, proportion of heavy vehicles and information about on- and off-ramp design. The demand flow for each quarter was retrieved from the MCS-database for the three studied scenarios.
A reduced capacity by 30 % at Södertälje motorway gives a delay of 4.7 h/queue minute at a capacity breakdown according to CALMAR estimations. Upon activation of harmonization occurs a reduced speed limit from 90 kph to 80 kph. At 80 kph, this gives a journey time of 508 seconds and at 90 kph, 452 sec, thus a delay of 56 seconds. At 3900 v/h (325*12), this gives 1.01 hours of delay per minute, and thus 15.2 hours as the minimum time of 80 kph is 15 minutes. For the periods when it has been a breakdown and harmonization is on, it is thus time multiplied by 1.01. During the periods in which harmonization has not been activated, but there has been a breakdown it is considered that harmonization would have passed the half of the period and then would collapse occurred. The total delay for two month is calculated in Table 4.
No harmonization Manual harmonization Autonomous system
Delay (h) 3384 2685 1843
Table 4: Delay for 3 different scenarios, no harmonization, manual harmonization and autonomous system (south direction).
The result shows that there are opportunities for improvement in the queue-warning system. The closest at hand is to complete the MTM/2-system with a harmonization algorithm built on CVS logic. Thus it would be possible to apply countermeasures 5-10 minutes earlier, in at least half of the analyzed interference cases.
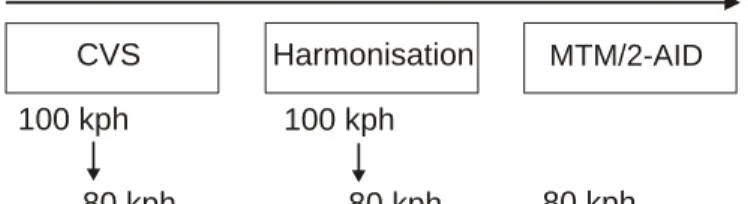
A complete MCS-system can thus contain three parts, a CVS-based early speed harmonization in combination with a flow harmonization triggered by fix flow levels and finally an unchanged queue warning algorithm (AID) under the current MTM/2, see Figure 5.
Figure 5: Method description of the various algorithms over time.
5
Conclusions and further research
This paper describes a model for detecting speed drops and implementation of a harmonizing algorithm. The conclusion from the literature review is that harmonization gives higher throughput when harmonization is used.
Summary results of the study are; maximum throughput has increased by 10% after installation of the traffic management system. Homogenization contributed a few percent to this. The tendency is that the number of situations with capacity breakdown decreases slightly, but that the duration has been slightly increased. The speed variance within each lane, and in total, decreases in proportion to the speed reduction of 7-10 kph when harmonization is activated. The effect is less than expected. Speed checks is required if a stronger effect is desired. The speed differences between lanes are maintained, but at a lower level. The queue warning system has contributed to the fact that braking now takes place on a much longer distance (> 15%). The average speed during low and medium traffic has increased by 4.5 kph after the installation of the traffic control system. Of which approximately 10% is attributed to the traffic control system (and the rest to the additional lanes). The average speed during rush hour on weekdays has increased by 2.5 kph after the installation of the traffic control system, of which approximately 25% is attributed to the traffic control system.
Accidents increased during the road works, but then returned to the same level as before the conversion. Later when MCS and ERA’s were installed, and road users have adapted to the new conditions, accidents have been halved and is considerably lower than before the conversion.
We recommend following procedure for local adaptation in the introduction of harmonization: • Find out the maximum throughput in five minutes
• Adjust the value downwards with regard to bottlenecks at interchanges
• Use the proxy activation criterion of 80 % of the maximum throughput at bottleneck • Trim by raising or lowering the criterion regarding the frequency of break-down situations Future research includes harmonization in low-speed environments in tunnels, for example 60-80 kph, where there effects are uncertain. Harmonization has been shown to have the intended effects on busy highways with high speed limits, typically 110-130 kph, but also Södertälje motorway with a speed limit of 100 kph. The Södertälje motorway traffic management system has been introduced while the number of lanes has been increased. It has therefore been difficult to isolate the effect exclusively from the traffic control system. Trimming of the MCS system is planned north of Stockholm. This may be a unique opportunity to explore the impact of harmonization with preserved
CVS Time 100 kph 100 kph 80 kph 80 kph 80 kph 70 kph 50 kph Harmonisation MTM/2-AID
road configuration in general. The influence of the frequency of the speed surveillance on the impact of harmonization should be explored. The impact of automatic speed surveillance in England has been used to enhance harmonization at variable speed limits. Compliance has thus become much larger than on Södertälje motorway. The costs of MCS systems are relatively high, which threatens to restrict the implementation. It may therefore be necessary to examine whether the effects will be less if an extension of the distance between MCS portals is performed. The traffic code in Sweden means that a driver from the previous gantry should be able to see the next lane signal.
References
Abdel-Aty M., Uddin N and Pande A. (2005) improving safety and security by developing a traffic accident prevention system. First International Conference on Safety and Security Engineering Proceedings. Rome, 2005).
García, A. (2009). Estudio sobre la gestión variable de la velocidad en las vías de acceso a las áreas urbanas, Cambra Oficial de Comerç, Indústria i Navegació de Barcelona. Barcelona, Spain.
Geistefeldt, J. (2011). Capacity effects of variable speed limits on German freeways. 6th International Symposium on Highway Capacity and Quality of Service.
Grumert, E. (2014). Cooperative Variable Speed Limit System. Modeling and Evaluation using Microscopic Traffic Simulation. Linköping University, Department of Science and Technology.
Hegyi, A., De Schutter, B. and Hellendoorn. J. (2005). Optimal coordination of variable speed limits to suppress shock waves. IEEE Transactions on Intelligent Transportation Systems, 6(1), 102– 112.
Heydecker, B.G. and Addison. J.D. (2011). Analysis and modelling of traffic flow under variable speed limits. Transportation Research, Part C: Emerging Technologies, 19(2), 206–217.
Kerner, Boris S (2011) Traffic FlowRates and Light Signal Controls in Networks. TEC. Kerner, Boris S (2013) Fundamental Empirical Features of Traffic Breakdown. TEC.
Movea (2015). Slutrapport E4/E20 Södertäljevägen. Effekter av trafikledning, vägrensutnyttjande och nödfickor. V1., Januari 2015.
Nissan, A. (2007). Evaluation of Impacts of the Motorway Control System (MCS) in Stockholm. TRITA-TEC-RR 07-005, Royal Institute of Technology, Stockholm, Sweden.
Strömgren, Per (2015), Calibration and Validation of a Swedish Space-time Analytical Model, Transportation Research Procedia Volume 6, 2015, Pages 158–171, 4th International Symposium of Transport Simulation (ISTS'14) Selected Proceedings, Ajaccio, France, 1-4 June 2014.
Swedish Traffic Agency/Trafikverket (2011) Aktiv högtrafikledning -Kunskapsdokument och tillämpningsråd. VGU underlag.
Vadde, R., Sun, D., Sai, J. O., Faruqi, M. A. and Leelani, P. T. (2012). A simulation study of using active traffic management strategies on congested freeways. Journal of Modern Transportation Volume 20, Number 3, September 2012, Page 178-184Texas A&M University-Kingsville, Department of Civil Engineering MSC 194, Kingsville, Texas 78363, USA.
Van Nes, N., Brandenburg, S. and Twisk. D. (2008). Dynamic speed limits; effects on homogeneity of driving speed. Intelligent Vehicles Symposium, IEEE, 269.
Zhong L, Sun X, Chen Y, He Y and Zhang J (2005) Relationship Between Volume to Capacity Ratio and Crash Rate on Freeway. Zhou, M. and Sisiopiku, V.P. (1997) Relationship Between Volume-to-Capacity Ratios and Accident Rates. Transportation research record 1581, TRB, 1997.
Zhou, M. and Sisiopiku, V.P. (1997) Relationship Between Volume-to-Capacity Ratios and Accident Rates. Transportation research record 1581, TRB, 1997.