A Dynamic Self-adaptive Resource-Load Evaluation
Method in Cloud Computing
Liyun Zuo
∗†, Lei Shu
∗, Shoubin Dong
†, Zhangbing Zhou
‡, Lei Wang
§ ∗Guangdong Provincial Key Lab. of Petrochemical Equipment Fault Diagnosis,Guangdong University of Petrochemical Technology, China
†School of Computer Science and Engineering, South China University of Technology, China
‡China University of Geoscience, Beijing, China and TELECOM SudParis, France §School of Software, Dalian University of Technology, China
Email:{liyun.zuo, lei.shu}@lab.gdupt.edu.cn, [email protected], [email protected], [email protected]
Abstract—Cloud resource and its load have dynamic char-acteristics. To address this challenge, a dynamic self-adaptive evaluation method (termed SDWM) is proposed in this paper. SDWM uses some dynamic evaluation indicators to evaluate re-source state more accurately. And it divides the rere-source load into three states – Overload,N ormal andIdle by the self-adaptive threshold. Then it migrates overload resources to balance load, and releases idle resources whose idle times exceed a threshold to save energy, which can effectively improve system utilization. Experimental results demonstrate SDWM has better adaptability than other similar methods when resources dynamically join or exit. This shows the positive effect of the dynamic self-adaptive threshold.
Keywords—cloud computing; energy; load evaluation
I. INTRODUCTION
In cloud computing environment[1], many dynamic and uncertain factors of resource and load can influence resource availability and task scheduling, e.g., node load of resource dynamically changing along with time, and the amount of resource request changing with year, season and holiday. Meanwhile, there are many changes in the resource itself, i.e., resources may join or exit at any time. These dynamic and uncertain factors lead to a series of problems. For example, if the load is too light, it causes a waste of resources. And if the load is too heavy, it influences the performance of services which are running on a node referring to a server. Therefore, it is necessary to real-timely evaluate and manage cloud resources and their load. Here, a node means a server.
There are some works on evaluating the resource load. But most of them use some physical indicators, such as CPU, bandwidth, memory and other information [2-6]. These static indicators cannot meet the needs because it is difficult to reflect the dynamic changes of cloud resources. Some current researches divide the load status of resource by fixed threshold when evaluating the resource load, but such fixed thresholds are unsuitable for dynamic load environments.
To improve the situation discussed above, this paper pro-poses a dynamic self-adaptive evaluation method (termed SDWM). It evaluates resource state through leveraging three dynamic indicators, and divides resource load into three states by dynamic self-adaptive thresholds, which includeOverload,
N ormal and Idle. Then it releases the idle resources to
save energy and migrates overload resources to balance load
and improve system utilization. The main contributions are as follows.
• First, it uses three dynamic indicators (the number of resource requests, resource service capacity, resource service strength) to evaluate the usage of resources. These dynamic indicators could describe the resource state more accurately.
• Second, it proposes a dynamic self-adaptive evaluation method to evaluate the resource load states accurately. It divides the resource load into three states by dynam-ic self-adaptive thresholds, whdynam-ich include Overload,
N ormalandIdle. Then it releases the idle resources
to save energy and migrates overload resources to balance load and improve system utilization.
The rest of the paper is organized as follows. The related work is introduced in section II, and the preliminary is shown in section III. The SDWM is illustrated in section IV. The experiment for SDWM is shown in section V, and the paper is concluded in section VI.
II. RELATEDWORK
The related work is reviewed from the following two aspects: resource load evaluation and resource load evaluation and energy.
A. Resource Load Evaluation
Currently, some static and physical indicators have been used in resource load evaluation, such as CPU computing power, memory and bandwidth. But in dynamic cloud envi-ronment, these indicators have the uncertain and non-iconic characteristic (that is to say, two CPUs are equal to computing power value, but the actual processing speed is different). So it is difficult for these static indicators to reflect the actual service capacity of a resource. Hence, some research work (e.g., [7]) leverages the extended form of these indicators, such as CPU utilization. But it is not accurate that the CPU utilization cannot really reflect the actual CPU use state because it also includes the memory latency. It is limited to judge resource load only by the CPU extension indicator. For example, the paper [8] evalu-ates and analyzes cloud resources data centers. It considers the overload case, but it does not consider extreme idle resources. The paper [9] evaluates the needs of the client and server
QSHINE 2015, August 19-20, Taipei, Taiwan Copyright © 2015 ICST
computing power, then proposes an resource allocation method aiming at client demand. But it does not evaluate the usage of resources. Some researchers predict and self-adaptively allocate resource by the use state to achieve dynamic and proactive resource management, scheduling and planning for interactive e-business applications [10]. A heterogeneity-aware dynamic capacity provisioning scheme for cloud data centers is proposed through considering the heterogeneity of both workload and machine hardware and proposes [11]. But when they evaluate the use state of resources they only deal with the overload resources. Those idle resources are not taken into account.
B. Resource Load Evaluation and Energy
Some researches integrate resource load evaluation with energy. The virtual resources are also dynamically consolidated by migration through an energy-aware model [12]. However, it does not take into account the resource load state. A heuristic method is used to set the overload threshold of host, which is set to 85% of CPU utilization. Those resources are determined to overload if their loads exceed this threshold [13]. However, these static thresholds cannot meet need of the dynamic resource load in cloud computing. Therefore, some researchers determined overload by dynamically adjusting the load threshold through a historical analysis [14] [15] [16], such as Median Absolute Deviation (MAD), Interquartile Range (IRQ), Local Regression (LR) and Local Regression Robust (LRR). They expect to save energy by migrating or consol-idating overload resources. But these methods do not divide the state of resource in more detail, only judging overload. Although there is an adjustable factor to set the threshold in paper [7], it is used to balance energy and the Service Level Agreements Violation (SLAV).
The paper [17] divides resources into three states–hot, warm and cold spots based on resource utilization. Then it migrates some hot resources to avoid overload and releases the cold spot to save energy. This method of dividing resources and saving energy is similar to the proposed in this paper. But the evaluation threshold is fixed, and it does not test the performance concerning energy saving.
From the above analysis, these current researches on re-source load do not divide rere-source load in detail, and their evaluation thresholds are fixed. So a more detailed method is proposed to evaluate and divide resource load state in this paper. Resource loads are divided into three states–Overload,
N ormalandIdleby dynamic evaluation indicators and
self-adaptive thresholds. At the same time, the evaluation thresholds are dynamic and self-adaptive, thus can meet the dynamic needs of cloud resource loads.
III. PRELIMINARY
Now there are some existing evaluation methods. They judge overload based on CPU utilization. The resource is judged as overload when its CPU utilization exceeds a thresh-old.
(1) MAD (median absolute deviation): For the set
X1,X2,. . . ,Xn (The method of calculating X is shown in
papers [15] [16]. Here, only the basic idea is shown.), take their absolute values, and sort these absolute values in ascending
order to obtain the set X1,X2,. . . ,Xn, then take its midpoint,
i.e.
M AD=median(X1, X2, . . . , Xn) (1)
The upperbound thresholdTu is defined as follows.
Tu= 1−s·M AD (2)
Wheres∈R+is a dynamic variable factor, whilesis used
to balance energy and performance. When Tu is lower, the
energy is less, but the SLAV is higher. The resource is judged as overload when CPU utilization exceeds the threshold Tu.
(2) IRQ (interquartile range): it takes advantage of the quartile for ordered sets.
IRQ=Q3−Q1 (3)
WhereQ1 is the quartile value of order sets, Q3 is
three-quarters of its value. The threshold Tu is defined as follows.
Tu= 1−s·IRQ (4)
Where the meaning ofsis the same to MAD. Similarly, the resource is judged as overload when CPU utilization exceeds the threshold Tu.
(3) LR (Local regression): it is a linear regression method. It fits the distribution of CPU utilization by curve-fitting techniques, then obtains the shortest distance line, y =f(x). The fitting straight line is used to predict the future CPU utilization. The resource is judged as overload when CPU utilization exceeds the threshold Pu.
Pu=s·f(xn+1) (5)
(4) LRR (Local regression Robust): it is the advanced linear regression method. It is the same as LR, but the weight of the deviate value is changed for weakening the influence of outliers on the fitted curve.
These existing evaluation methods only use CPU utilization as the overall resource usage. However, in fact, CPU utilization does not fully represent the state of resources. It also includes a memory waiting time. Moreover, they only judge the overload state of resource load and do not consider the long-term idle or unavailable resources. Finally, they divide the resource state by a fixed threshold, which does not meet the dynamic needs of cloud resources nor reflect real-time information resources accurately.
IV. DYNAMICWEIGHTEDLOADMODELBASED ON SELF-ADAPTIVEALGORITHM
A. Dynamic Evaluation Indicators
First, SDWM uses three dynamic evaluation indicators to describe dynamic state of resource load accurately [18]. It assumes that there arenresources in the set of cloud resources
U, which is U = U1, U2, ..., Un. These resources include
physical resources and VM resources.
(1) The number of resource requests,r: the average number of service requests received by the resources per unit time.
If the number of resource request in each resource node
Ui(1 ≤ i ≤ n) is ri(1 ≤ i ≤ n), then the resource request
number of U isrN =P n i=1ri.
(2) The resource service capacity, h: the average number of service requests which the resource completes per unit time.
A larger value ofhindicates a stronger resource service ca-pacity and the higher price of resources. Resource price is pro-portional toh. Resource capacity of U ishN =n/Pni=1h1
i.
(3) The resource service strength,q: the ratio of the average time to complete a service request and their average time interval.
The variableqreflects the relative relationship of resource load strength and its available strength. q = Cr·h. In this formula C is the parallel service strength. Resource strength of U isqN =rN/(hN ·P
n i=1Ci).
B. SDWM
Here, a dynamic weighted load evaluation algorithm is proposed. Resource nodes periodically execute SDWM to evaluate load state and calculate the normalized relative load value L[i].L[i]can reflect the performance difference among resources and the potential load strength. L[i] is also used to divide the resource load state by the dual thresholds λ1 and λ2 (λ1< λ2).L[i] is defined as Formula 6.
L[i] =
(
1, if(ri =Riorhi≥Hiorqi≥Qi)
w1Rrii +w2Hhii +w3Qqii, Others
(6)
Where ri and Ri are current request amount and the
maximum request amount of the resourceUi, respectively;hi
andHi are the current computing capacity and the maximum
computing capacity of the resource Ui. qi and Qi are the
current load strength and maximum load strength of the resourceUi. The ratios Rri
i,
hi
Hi,
qi
Qi are respectively described
as follows: ri for Ri, hi for Hi, qi for Qi are normalized
value, whose range is [0,1].
The quantities ri
Ri,
hi
Hi and
qi
Qi can change the adjustable
weighted value of three resource indicators toL[i]by dynami-cally adjustingwj, so it is named “dynamically weighted load
evaluation algorithm.” The weighted value wj is dynamically
and self-adaptively adjusted by the Formula 7 in every evalu-ation cycle.
wj =w0+µ(w1−w0) (7)
Here w0 andw1 are constants, which are in the range of
[0, 0.5] and [0, 1], and w0 > w1. The value µ is a random
number in range of [0,1]. The formula 7 makes the adjustable weighted value of ri
Ri,
hi
Hi and
qi
Qi change randomly in [w0,w1].
And it follows the formula 8.
3 X
1
wj = 1 (8)
The resource load state is divided into three states –
Overload,N ormalandIdle, based onL[i]by dual thresholds
λ1andλ2(λ1< λ2). The termwjneeds to be updated in every
evaluation cycle.
The λ1 andλ2 are calculated through the subtraction and
addition of the system average load strength and the standard deviation.
λ1=Q−σ (9)
λ2=Q+σ (10)
While Q is the average load strength of all resources in cloud computing system, the σ is the standard deviation of system load.
Q= 1
n
n
X
k=0
Qk (11)
σ=
v u u t
1
n
n
X
k=0
(Qk−Q) (12)
WhileQk is the average load strength of resource k,nis the
number of resource in the cloud data center.
Qk =
1
m
n
X
k=0
qk (13)
Hereqk is the load strength of resource nodeUk(1≤k≤
n) .
The process of updating and adjusting thresholds λ1 and λ2 is shown in Algorithm 1.
Algorithm 1 Dynamic Self-adaptive Threshold Updating Al-gorithm
Input:
< ri, hi, qi> Output:
λ1, λ2 1:FOR i=1 to m
2: IF< ri+1, hi+1, qi+1>6=< ri, hi, qi>THEN 3: CalculateQas Formula 11;
4: Calculateσas Formula 12;
5: CalculateQkas Formula 13; 6: Calculateλ1byQ−σ; 7: Calculateλ2byQ+σ; 8: ELSE
9: Break;
10: END IF
Algorithm 2 Dynamic Self-adaptive Evaluation Algorithm Input:
ri, hi, qi, Ri, Hi, Qi Output:
L[i], Ustate, c, Ak> 1:c= 0;
2:FOR i=1 to n
3: CalculateL[i]as Formula 11; 4: Algorithm 1;
5: IFri=Riorhi≥Hiorqi≥QikL[i]≥λ2THEN 6: Ustate=overload;Ak=Ri−ri;
7: ELSE IFL[i]≤λ1THEN 8: Ustate=Idle;c=c+ 1; 9: ELSE
10: Ustate=N ormal; 11: END IF
12: END IF
13: IFri+16=riorT henumberof V M changesTHEN 14: Updateλ1andλ2;
15: ELSE
16: Break;
17: END IF
18: Updatewj; 19: END FOR
The implementation process of dynamic self-adaptive load evaluation is shown in Algorithm 2.
Wherec is the idle time, andAk is the migration amount
of overload resources.
V. EXPERIMENTS
The experiment is designed to evaluate the performance and dynamic adaptability of evaluation method.
A. Experiments Setup and Metrics
The experiment is performed by the Cloudsim [19]. The experiment uses the workload in the paper [7]. RAM is 4096MB, hard disk capacity is 1TB, and the bandwidth is 1Gbit / s. The average request number follows a Poisson distribution.
The system resource utilization L (the average utilization of the system in all nodes) is used to evaluate the performance of every method. Lis calculated as follows.
L=
PN
i=1Li
N (14)
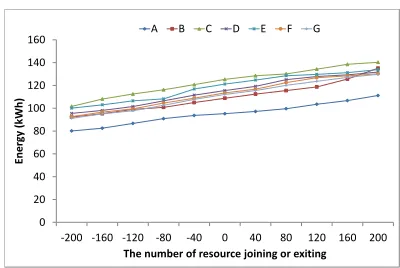
MAD, IRQ, LR and LRR are compared with SDWM. Their parameters using the MMT of the paper [7]: MAD-MMT-2.5, IRQ-MMT-1.5, LR-MMT-1.2 and LRR-MMT-1.2. Besides, two more methods are compared with SDWM to demonstrate its effect of the self-adaptive threshold. One uses the fixed threshold which is the first evaluation threshold, and no longer changes. The other is Non-evaluation, which does not evaluate and consolidate resources. In order to clearly show these methods in figures, SDWM, Fixed threshold, Non-evaluation, MAD, IRG, LR, LRR are marked with the uppercase letters ABCDEFG, respectively.
B. The Dynamic Self-adaptive Effect of the SDWM
This subsection demonstrates the dynamic self-adaptive effect of all methods along with resources changing. The experiment randomly selects 0-200 resources to exit or join.
0 20 40 60 80 100 120 140 160
-200 -160 -120 -80 -40 0 40 80 120 160 200
En
er
gy
(kWh)
The number of resource joining or exiting
A B C D E F G
Fig. 1. Energy with resource joining or exiting.
0 100 200 300 400 500 600 700
-200 -160 -120 -80 -40 0 40 80 120 160 200
A
ver
ag
e
respo
nse
time (ms)
The number of resource joining or exiting
A B C D E F G
Fig. 2. Average response time with resource joining or exiting.
0 10 20 30 40 50 60 70 80
-200 -160 -120 -80 -40 0 40 80 120 160 200
R
esou
rce
ut
iliz
atio
n
(%)
The number of resource joining or exiting
A B C D E F G
Fig. 3. Resource utilization with resource joining or exiting.
The amount of resource requests is 80 per second. Task scheduling uses Min-Min algorithm [20]. The targets are energy, the response time, and resource utilization for all methods. Experiments are carried out 30 times and obtain the average of each case.
Moreover, the dynamic range of SDWM is less than other methods. The reason is that SDWM periodically monitors resources and dynamically updates the threshold.
Fig. 2 shows that the average response time of SDWM is also lower than other methods. The range of SDWM decreasing is from 11% to 66.1% relative to other methods. The dynamic range of SDWM is the least (100ms) when resources dynamically change. Other methods are bigger than 200ms. Thus prove that the dynamic changes of resources greatly impact the response time of task scheduling. SDWM shows better adaptability than other methods, so it is more suitable for cloud computing.
Fig. 3 shows the resource utilization. It is obvious that SD-WM is much higher than other methods. There is an increase of 20% to 58.3%. The resource utilization of other methods changes along with resources joining or exiting significantly, but SDWM only has little difference.
The above results show that SDWM has great self-adaptive performance. The reasons are as follows: resources are real-timely consolidated. Resource load is balanced real-timely, and extreme idle resources are released. As a result, it saves energy and improves system resource utilization.
VI. CONCLUSION
The dynamics of cloud resource makes that the tradi-tional static evaluation indicators cannot describe resource state accurately. Therefore, this paper uses three dynamic evaluation indicators (i.e., the amount of resource request, resource computing capacity and resource load strength) to evaluate the resource load state. A dynamic self-adaptive algorithm is proposed to evaluate the resource load. It divides the resource load state into overload, normal and idle. The overload resources are migrated to balance load, and the idle resources are released to save energy if their idle time exceeds a certain threshold. With regard to the dynamics of cloud resources and loads, two self-adaptive thresholds are proposed. These two dynamic thresholds λ1 and λ2 are dynamically
impacted by the dynamic evaluation indicator (resources load strength). They are updated and adjusted periodically. The experiment show that SDWM has a very great advantage in terms of response time and system resource utilization when resources are dynamically joining or exiting. It is same to energy saving. The maximum of saving energy is nearly 31.5%.
ACKNOWLEDGEMENT
This work is supported by the Natural Science Foundation of Guangdong Province, China Project No. 2014A030313729, 2013 Special Fund of Guangdong Higher School Talent Re-cruitment, 2013 top Level Talents Project in Sailing Plan of Guangdong Province, 2014 Guangdong Province Out-standing Young Professor Project. Lei Shu is the corresponding author.
REFERENCES
[1] C. Zhu, V. C. M. Leung, X. Hu, L. Shu, and L. T. Yang, A review of key issues that concern the feasibility of mobile cloud computing, in Proc. IEEE International Conference on Cyber, Physical and Social Computing (CPSCom), 2013, pp. 769C776.
[2] A. Iosup, M. Jan, O. Sonmez, D. Epema. “The Characteristics and Performance of Groups of Jobs in Grids,” Euro-Par 2007 Parallel Processing Lecture Notes in Computer Science, Springer-Verlag, Berlin, Heidelberg, 2007, pp. 382-393.
[3] P. A. Dinda, D. R. O’Hallaron. “Host load prediction using linear models,”Cluster Computing, vol. 3, no. 4, pp. 265-280, Dec. 2000. [4] A. I. D. Bucur, D. H. J. Epema. “Scheduling Policies for Processor
Collocation in Multi cluster System,”IEEE Transactions on Parallel and Distributed Systems, vol. 18, pp. 958-962, Jun. 2007.
[5] Y. S. Dai, G. Levitin, K. S. Trivedi. “Performance and reliability of tree-structured grid services considering data dependence and failure correlation,”IEEE Transactions on Computers, vol. 56, no. 7, pp. 925-936, Jul. 2007.
[6] F. Song, C. Z. Xu. “Exploring event correlation for failure prediction in coalitions of clusters,” inProc. of the 2007 ACM/IEEE Conference on Supercomputing, Reno, NV, USA , 10-16 Nov. 2007, pp. 1-12. [7] A. Beloglazov, R. Buyya. “Optimal online deterministic algorithms
and adaptive heuristics for energy and performance efficient dynamic consolidation of virtual machines in Cloud data centers,” Concurrency and Computation: Practice and Experience, vol. 24, no. 13, pp. 1397-1420, Sep. 2012.
[8] B. Olivier, E. D. Lionel, T. C. Christopher, R. Hejer. “Heterogeneous Resource Allocation under Degree Constraints,”IEEE Transactions on Parallel and Distributed Systems, vol. 24, No. 5, pp. 926-937, May 2013. [9] S. Islam, J. Keung, K. Lee, A. Liu. “Empirical prediction models for adaptive resource provisioning in the cloud,” Future Generation Computer Systems, vol. 28, no. 1, pp. 155-16, Jan. 2012.
[10] Q. Zhang, M. F. Zhani, R. Boutaba. “Dynamic Heterogeneity-Aware Resource Provisioning in the Cloud,” IEEE Transactions on Cloud Computing, vol. 2, no. 1, pp. 14-28, Mar. 2014.
[11] D. Bruneo. “A Stochastic Model to Investigate Data Center Performance and QoS in IaaS Cloud Computing Systems,” IEEE Transactions on Parallel and Distributed Systems, vol. 25, no. 3, pp. 560-569, Mar. 2014. [12] A. Verma, P. Ahuja, A. Neogi. “pMapper: power and migration cost aware application placement in virtualized systems,”Middleware 2008, Springer Berlin Heidelberg, pp. 243-264, 2008.
[13] X. Zhu, D. Young, B. J. Watson, et al. “1000 islands: Integrated capacity and workload management for the next generation data center,” inProc. of 2008 International Conference on Autonomic Computing, Chicago, IL, 2-6 June, 2008, pp. 172-181.
[14] P. A. Dinda, D. R. O’Hallaron. “Host load prediction using linear models,”Cluster Computing, vol. 3, no. 4, pp. 265-280, Dec. 2000. [15] A. Beloglazov, J. Abawajy, R. Buyya. “Energy-aware resource
allo-cation heuristics for efficient management of data centers for cloud computing,”Future Generation Computer Systems, vol. 28, no. 5, pp. 755-768, May 2012.
[16] A. Beloglazov, R. Buyya. “Managing overloaded hosts for dynamic consolidation of virtual machines in cloud data centers under quality of service constraints,”IEEE Transactions on Parallel and Distributed Systems, vol. 24, no. 7, pp. 1366-1379, Jul. 2013.
[17] Z. Xiao, W. Song, Q. Chen. “Dynamic Resource Allocation Using Vir-tual Machines for Cloud Computing Environment,”IEEE Transactions on Parallel and Distributed Systems, vol. 24, no. 6, pp. 1107-1116, Jun. 2013.
[18] Z. J. Hu, “The resource availability evaluation in service grid environ-ment for QoS,”Ph.D. dissertation, Changsha, Central South University, 2010.
[19] R. N. Calheiros, R. Ranjan, A. Beloglazov, A. F. Cesar, R. De, R. Buyya, “CloudSim: A Toolkit for Modeling and Simulation of Cloud Computing Environments and Evaluation of Resource Provisioning Algorithms,”
Software: Practice and Experience, Wiley, vol. 41, no. 1, pp. 23-50, 2011.