Louisiana State University
LSU Digital Commons
LSU Doctoral Dissertations Graduate School
May 2019
Application of X-ray Grating Interferometry to
Polymer/Flame Retardant Blends in Additive
Manufacturing
Omoefe Joy Kio
Louisiana State University and Agricultural and Mechanical College, [email protected]
Follow this and additional works at:https://digitalcommons.lsu.edu/gradschool_dissertations Part of theMaterials Chemistry Commons,Optics Commons, and theOther Materials Science and Engineering Commons
This Dissertation is brought to you for free and open access by the Graduate School at LSU Digital Commons. It has been accepted for inclusion in LSU Doctoral Dissertations by an authorized graduate school editor of LSU Digital Commons. For more information, please [email protected].
Recommended Citation
Kio, Omoefe Joy, "Application of X-ray Grating Interferometry to Polymer/Flame Retardant Blends in Additive Manufacturing" (2019).LSU Doctoral Dissertations. 4902.
APPLICATION OF X-RAY GRATING INTERFEROMETRY TO
POLYMER/FLAME RETARDANT BLENDS IN ADDITIVE
MANUFACTURING
A Dissertation
Submitted to the Graduate Faculty of the Louisiana State University and Agricultural and Mechanical College
in partial fulfillment of the requirements for the degree of
Doctor of Philosophy in
The Department of Chemistry
by
Omoefe Joy Kio
ACKNOWLEDGEMENTS
My sincere gratitude goes to Dr. Leslie Butler, my research advisor. By accepting me into his research group this project was set in motion. His guidance and instruction helped make this milestone a reality. He was approachable and patient as we tackled this project.
I would also like to thank Dr. Kyungmin Ham of LSU CAMD, her expertise came into play over and over again. She was easy to work with and had a great sense of humor. I would like to appreciate Dr. Miriam Sibenbeurger who has been a great help in the SAXS aspect of this work.
Former members of the Butler group; Adam Brooks, Mutairo Olatinwo and Jumao; Gerry Knapp and Bridget Cadigan are here acknowledged. Together we learnt and shared knowledge as we trod a somewhat unique path in the Chemistry department.
My warm thanks go to Dr. Andrew Maverick, Dr. Revati Kumar and Dr. Richard Kurtz for choosing to be part of my exam committee. Other faculty and staff of the
chemistry department including Dr Thomas Weldgeghoris –of the NMR facilty and Ms.
Kim Mollere are also appreciated.
Now to my family. I really appreciate the love and support I have enjoyed from my Husband, Dr. Abiola Olabode who was a wonderful example of a Ph.D. student to me. My love and appreciation go to our son Mark who always got me to make time for play. I appreciate my parents for the good upbringing I was given, and my siblings. My family has been a lovely one to be a part of and strong members of my support team.
To everyone mentioned here and those not mentioned that contributed one way or the other to this milestone, I cannot repay you. God bless you.
TABLE OF CONTENTS
ACKNOWLEDGEMENTS ...……….………….….. iii ILLUSTRATIONS ...………...……… vi ABSTRACT ………. ix CHAPTER 1. INTRODUCTION ...……….………...…………. 1 1.1 Additive Manufacturing ... 21.2 Flame Retardants in Polymeric Materials ... 6
1.3 Flammability Tests ...15
1.4 References ...19
CHAPTER 2. FROM X-RAYS TO IMAGES ………... 29
2.1 X-Ray Interaction with Matter ….………... 29
2.2 X-ray Sources ... 34
2.3 Area Detectors for X-ray Imaging ………. 42
2.4 Data Processing ... 50
2.5 References ... 52
CHAPTER 3. X-RAY GRATING INTERFEROMETRY ...……….…… 59
3.1 Talbot-Lau Stepped-Grating Interferometry ...……….… 60
3.2 Contrast Generation in Stepped-Grating Interferometry ... 64
3.3 Single-shot Grating Interferometry ... 68
3.4 References ... 69
CHAPTER 4. INTERFEROMETRIC DETECTION OF VOIDS AND GAPS IN FUSED DEPOSITION MODELED POLYMERIC OBJECTS ...……… 73
4.1 Introduction ...…...………... 73
4.2 Materials and Methods... 76
4.3 Results ……...………... 82
4.4 Conclusions ..……….…...……... 89
4.5 References …...………... 90
CHAPTER 5. X-RAY INTERFEROMETRIC STUDIES ON THE EFFECT OF FLAME RETARDANT INCORPORATION INTO POLYMERIC OBJECTS BY FUSED DEPOSITION MODELING .………... 94
5.1 Introduction ..………... 94
5.2 Materials and Methods ...……… 99
5.3 Results ...………..…….. 103
5.4 Conclusions ...……… 113
CHAPTER 6. CORRELATION LENGTH STUDIES OF FUSED DEPOSITION MODELED SAMPLES WITH X-RAY GRATING INTERFEROMETRY
AND SMALL ANGLE X-RAY SCATTERING ...………... 118
6.1 Introduction ..………. 118
6.2 Materials and Methods ………. 121
6.3 Results ...……… 123
6.4 Conclusions ………... 144
6.5 References ...………. 146
CHAPTER 7. CONCLUSIONS AND RECOMMENDATIONS ..………... 149
7.1 Conclusions ………... 149
7.2 Recommendations ...……… 152
APPENDIX A. COPYRIGHT INFORMATION ………...…. 154
A.1. Copyright Information for Paper Reused in Chapter 4 .…………....……… 154
A.2. Copyright Permission for Figure 1.2 .……… 155
A.3. Copyright Permission for Figure 1.3 …...……….. 157
A.4. Copyright Permission for Figures 1.7 and 1.8 .……… 163
APPENDIX B. PSEUDOCODE FOR CURVATURE ANALYSIS ………...…. 167
APPENDIX C. DATA PROCESSING CODES ……… 168
C.1. Sample Mathematica Codes for Stepped-grating Interferometry ..……….. 169
C.2. Sample Tomopy Codes for Stepped-grating Interferometry .……… 186
C.3. Sample Tomopy Codes for Volume Reconstruction ………..… 198
ILLUSTRATIONS
TableLSU CAMD Storage Ring Parameters ……… 39
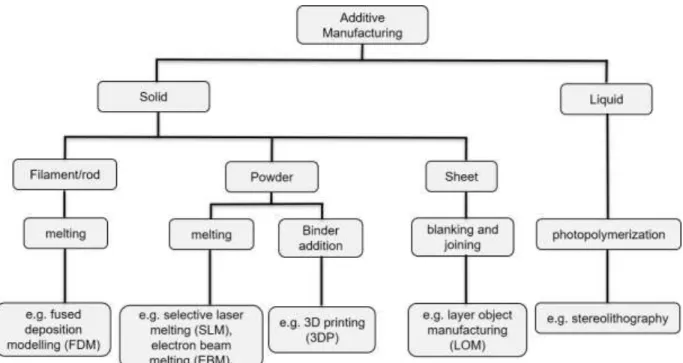
Figures Figure 1.1 Classification of additive manufacturing techniques based on the physical state of feedstock ...……….………….……….... 3
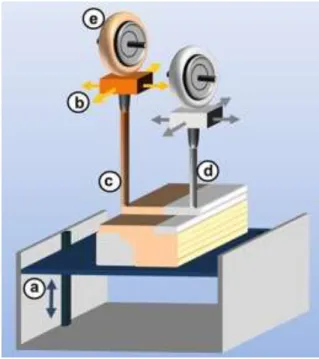
Figure 1.2 Schematic of a fused deposition modeling printer …………..…..……….… 5
Figure 1.3 The polymer combustion cycle ..………..….…………..…….. 8
Figure 1.4 Examples of common brominated flame retardants ...………... 12
Figure 1.5 Examples of Phosphorus-based flame retardants ...……….……... 13
Figure 1.6 The limiting oxygen index flammability test ….……….……... 16
Figure 1.7 The UL-94 flammability test .………..…….……... 18
Figure 1.8 The cone calorimeter ….………..………... 18
Figure 2.1 Elastic scattering of X-rays ..…………..………..… 30
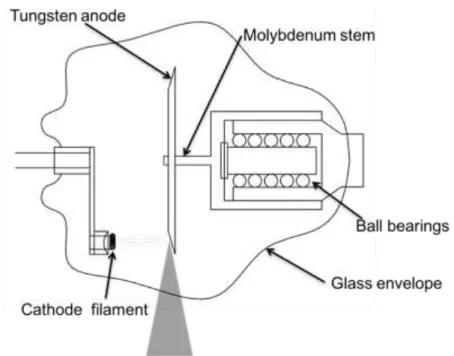
Figure 2.2 Schematics of a rotating anode X-ray tube ..…………..….…………..…... 35
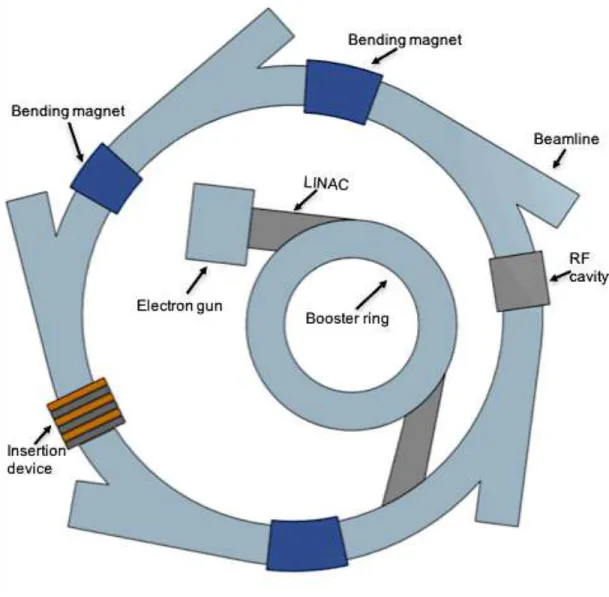
Figure 2.3 A schematic of a synchrotron and its basic components ………….……... 37
Figure 2.4 Schematic of a CCD Detector pixel .………... 45
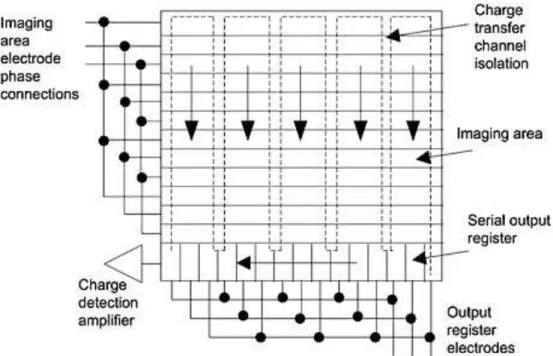
Figure 2.5 Schematic of a full-frame CCD array ..……….……… 46
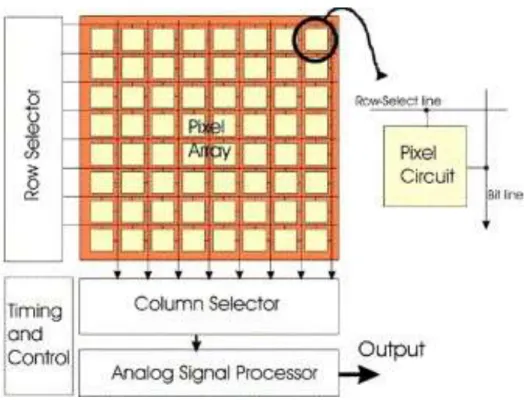
Figure 2.6 Schematic of a CMOS detector ...……….... 47
Figure 2.7 Schematic of a thin-film transistor pixel ...………... 49
Figure 3.1 Stepped-grating interferometer set-up ....……..……… 62
Figure 3.2 Sample interferogram from a pixel showing calculated offset (𝑎0𝑝), amplitude (𝑎1𝑝) and phi (∅𝑝) of the sine curve ………..…. 63
Figure 4.2 A Talbot-Lau stepped grating interferometer with two different
grating configurations ………... 79
Figure 4.3 Volume rendering of reconstructed absorption and dark-field volumes with 20% opacity ………... 83
Figure 4.4 Absorption and dark-field projections of the ABS bunny with line probe plot ………..………. 84
Figure 4.5 SEM image of a portion of an ABS bunny ear ………... 85
Figure 4.6 Reconstructed absorption and dark-field volumes for Stanford Bunny printed in PLA .………... 86
Figure 4.7 Absorption and dark-field projections of the PLA quadratic object obtained using single-shot interferometry .………. 87
Figure 4.8 Curvature analysis ……….... 88
Figure 5.1 Absorption images of a 1:1 ABS/ABSFR sample heated at 265°C …... 104
Figure 5.2 Absorption images of a 3:1 ABS/ABSFR sample heated at 275°C …... 105
Figure 5.3 Sectional views of absorption volumes for 1:1 and 3:1 ABS/ABSFR Samples ..………...………..…… 106
Figure 5.4 Sectional views of dark-field volumes for a 1:1 ABS/ABSFR sample heated at 265°C ……….. 107
Figure 5.5 Sectional views of dark-field volumes for a 1:1 ABS/ABSFR sample heated at 275°C ...……….….. 109
Figure 5.6 Sectional views of dark-field volumes for an ABS/ABSFR 3:1 sample heated at 265°C ...………... 110
Figure 5.7 Sectional views of dark-field volumes for an ABS/ABSFR 3:1 sample heated at 275°C ………..…..111
Figure 5.8 Dark-field projections of a 3:1 ABS/ABSFR sample at two consecutive SDD positions ...………...… 112
Figure 5.9 Dark-field projections of a 3:1 ABS/ABSFR sample at two SDD positions ...……….…………... 113
Figure 6.2 T1(1H) measurement for peak 169.89 ppm (CO) of the pristine PLA
sample .……….……….... 126
Figure 6.3 T1(1H) measurement for peak 69.5 ppm (CH2) of the pristine PLA
sample ...……….………..……… 127
Figure 6.4 T1(1H) measurement for peak 16.8 ppm (CH3) of the pristine PLA
sample .………. 128
Figure 6.5 13C NMR spectrum for PLA heated to 170°C .……….……….……… 129
Figure 6.6 13C NMR spectrum for PLA heated to 215°C ………..…... 130
Figure 6.7 T1(1H) measurement for peak 169.6 ppm (CO) of the 170°C PLA
sample ……….. 131
Figure 6.8 T1(1H) measurement for peak 69.2 ppm (CH2) of the 170°C PLA
sample ………...………... 132
Figure 6.9 T1(1H) measurement for peak 16.6 ppm (CH3) of the 170°C PLA
sample ...………... 133
Figure 6.10 T1(1H) measurement for peak 169.6 ppm (CO) of the 215°C PLA
sample ……….…... 134
Figure 6.11 T1(1H) measurement for peak 69.2 ppm (CH2) of the 215°C PLA
Sample ...……….…... 135
Figure 6.12 T1(1H) measurement for peak 16.6 ppm (CH3) of the 215°C PLA
Sample ...………... 136 Figure 6.13 SEM images of PLA blocks printed with nozzle temperatures
(a) 215°C, (b) 205°C, and (c) 195°C ....………. 137 Figure 6.14 SEM images of PLA blocks printed with nozzle temperatures
(a) 185°C and (c) 175°C …………..………..…. 138 Figure 6.15 SAXS measurements within a layer each of the 175°C, 185°C,
195°C and 215°C samples ………. 139 Figure 6.16 SAXS measurements at layer-layer interfaces for 175°C, 185°C,
195°C and 215°C samples ...………..…... 140 Figure 6.17 Plot of the difference between the scattering measurements for the
and 215°C samples ……….... 141 Figure 6.18 SAXS measurements for ABS/ABSFR blocks ……… 142 Figure 6.19 SAXS curves for interface regions in ABS/ABSFR blocks of 1:1
composition …...………...……... 143
Figure 6.20. SAXS curves for interface regions in an ABS/ABSFR block of 3:1
ABSTRACT
X-ray grating interferometry is a nondestructive tool for visualizing the internal structures of samples. Image contrast can be generated from the absorption of X-rays, the change in phase of the beam and small-angle X-ray scattering (dark-field). The attenuation and differential phase data obtained complement each other to give the internal composition of a material and large-scale structural information. The dark-field signal reveals sub-pixel structural detail usually invisible to the attenuation and phase probe, with the potential to highlight size distribution detail in a fashion faster than conventional small-angle scattering techniques. This work applies X-ray grating interferometry to the study of additively manufactured polymeric objects.
Additively manufactured bunnies made from single material—acrylonitrile butadiene styrene (ABS) and polylactic acid (PLA)—were studied by grating-based X-ray interferometric two-dimensional imaging and tomography. The dark-field images detected poor adhesion in the plane perpendicular to the build plate. Curvature analysis of the sample perimeter revealed a slightly higher propensity to errors in regions of higher curvature.
Incorporation of flame-retardant molecules to near-surface regions of otherwise flammable objects through the fused deposition modeling additive manufacturing technique was also explored. The anticipated advantage was efficient use of the flame retardants while keeping them away from the surface for safety.
To determine heat propagation effects, two-dimensional grating-based interferometry imaging at LSU CAMD was used to study heated samples. The focus was on the dark-field signals to highlight voids and gaps arising from layer delamination or gasification of chemical components. The resulting differential phase and dark-field
images were tainted by fringes attributed to inaccuracies in the grating-step position. Attempts to correct this will be presented. Interferometric tomography was also carried out on the heated samples using the W. M. Keck interferometric system at LSU.
Grating-based interferometry was also used to probe scattering structure sizes of heated samples. Comparison of the data with the conventional small-angle x-ray scattering technique, SAXS, is being pursued.
The results obtained so far from the above-mentioned experimental works are presented in this document.
CHAPTER 1
INTRODUCTION
Since their discovery by Roentgen, X-rays have revolutionized the study of the composition of materials. X-ray imaging has become an indispensable tool in medical and materials imaging, amongst other applications. The wide applications of X-ray imaging
drove research into improved devices for X-ray generation and detection.1-4 Basic X-ray
imaging yields a two-dimensional projection image based on the attenuation of the radiation through sample components of differing density or elemental composition. Repeated projection images of a sample from different angles can be collected digitally and superimposed by mathematical algorithms to obtain a three-dimensional representation of the sample. This technique called computed tomography (CT), enables visualization of components contributing to the two-dimensional projection. To obtain other contrast information, additional optical and electronic devices are incorporated into the imaging system. A recently developed evaluation technique, X-ray grating-based interferometry, that simultaneously yields three sets of signals—absorption, dark-field (small angle scattering) and phase contrast signals—has attracted some attention. The details of this technique will be presented later in this dissertation. Studies have been carried out to explore areas where this technique can be applied. In the pursuit of medical applications, X-ray grating-based interferometry has been used to study biological samples. Dark-field imaging of a healthy rat detected the collapsed lungs with improved
contrast compared to phase imaging while undetectable with absorption imaging.1 X-ray
grating-based interferometry has also been used to visualize morphological changes in the lungs associated with pulmonary fibrosis in mice, with dark-field imaging detecting
In the area of materials science, X-ray grating-based interferometry has been applied to cement, concrete and wood.6-9 Following the comparison of different pearl
products, it was reported that X-ray grating-based interferometry required shorter
exposure time than that used in conventional radiography.10 Application of X-ray
grating-based interferometry to additively manufactured polymeric and metal parts has been
pioneered by our group and some of the results will be presented in this dissertation.11-14
The effect of incorporating flame retardants into otherwise flammable polymeric parts by additive manufacturing is also being explored.
1.1 Additive Manufacturing
Initially referred to as rapid prototyping and utilized for making prototypes and models, additive manufacturing (AM) has metamorphosed into a technology used for a variety of commercial manufacturing applications ranging from prototyping to end-use materials. The additive manufacturing process involves loading the CAD drawing of a desired object into a printer slicing software. The printer deposits material or energy based on the design slice-by-slice till the bulk material is complete or formed. The advantages of this technique over the conventional welding, molding or milling manufacturing technique are the reduction of waste and the ease of making complex
geometries.15,16 The wide application of additive manufacturing is however limited by the
availability of raw materials in a suitable form and long production time thus, it is mostly applied in custom, low-volume production usually where there is some economic
advantage.16,17 There are different additive manufacturing processes including:
stereolithography, 3D printing (3DP), fused deposition modeling (FDM), electron beam melting (EBM) and selective laser melting (SLM); Figure 1.1.18,19 Depending on the
process, the feedstock can be in powder, filament, sheet or liquid form. Materials used
include polymers, ceramics and metals.15,20 There are a limited number of metal alloys
available for AM, with Ti-6Al-4V being the most investigated.13,20 Others are Al-Si-Mg,
Inconel 625, stainless steel 316 and 420 etc.20
Figure 1.1. Classification of additive manufacturing techniques based on the physical state of feedstock. Adapted from reference 19.19
Additive manufacturing has found application in orthodontics; in orthopedics, research is still ongoing into its potential application as scaffolding for bone regeneration.21-23 Patient-tailored medication via FDM has also been investigated.24 The
introduction of conductive inks into additive manufacturing increased the potential for
printing of electronic components or devices.25-27 General Electric’s additively
manufactured LEAP engine fuel nozzle currently powers planes around the world.28,29
combustion chambers.30 Marchelli et al. investigated the use of virgin and recycled glass
as a raw material for the 3D printing AM technique.31
It is important that the performance of additively manufactured parts is comparable to that of parts manufactured by conventional techniques. The slicing step typically
introduces a staircase effect most evident on curved or inclined surfaces.32 Temperature
variation across print layers can lead to microstructural differences within a part, delamination of print layers, cracking and warpage in parts.20,33 There is a general
mechanical weakness in printed parts in the plane normal to the print bed.20,34 These, in
addition to the use of support structures usually necessitate one or more post-processing steps and may prevent the use of an additively manufactured part in some applications. Various research projects have been done on improving the mechanical strength of AM
parts. Fiber reinforcement during printing for 3DP parts has been reported.35 Shaffer et
al. reported improving the thermomechanical properties of FDM objects by exposing the
objects, post printing, to gamma radiation.36 The polymers used were blended with special
radiation sensitizers.
The fused deposition modeling AM technique involves extruding semi-molten thermoplastic polymers based on the slice model (Figure 1.2). The bulk part is the result of the cooling of fused slices. The common thermoplastics used are acrylonitrile butadiene styrene copolymers (ABS), polylactic acid (PLA), polycarbonate (PC), and
polyamides (PA).37,38 The potential of polypropylene as a material for FDM has also been
studied.39 Research into replacing polypropylene with poly-hydroxyalkanoates like
polypropylene, is ongoing.40,41 Poly(3-hydroxybutyrate) is also promising for tissue
engineering via additive manufacturing.42,43
Studies on improving the mechanical properties of FDM parts have included reinforcements with other materials and print parameter optimization.38,44-46 It was noted
that ABS has been the material most studied.46 Hwang et al. reported a decrease in the
tensile strength of ABS-copper and ABS-iron composite parts.45 Mohamed et al.
presented an extensive review on research works into the effect of print parameters on
surface roughness, dimensional accuracy and mechanical properties.46 An integrated
process-materials-design methodology for optimizing the mechanical performance of
Figure 1.2. Schematic of a fused deposition modeling printer.37 The components are (a)
the build platform, (b) the print head where feedstock is heated and extruded from a nozzle, (c) one type of feedstock, (d) another type of feedstock and (e) the spool of a feedstock filament. Reprinted from Chemical Reviews, 117, Ligon S. C., Liska R., Stampfl J. R., Gurr M., and Mülhaupt R., Polymers for 3D printing and customized additive manufacturing, 10212 - 10290, Copyright (2017) with permission from ACS. https://pubs.acs.org/doi/abs/10.1021/acs.chemrev.7b00074. Permission requests should be directed to ACS.
ABS-based FDM parts was reported by Rodriguez et al.47 Infrared thermography have
been used to study temperature profiles of an FDM printed part during printing.34
The susceptibility of additively manufactured parts to faults and associated failures requires greater attention to quality evaluation. Internal evaluation of additively manufactured parts has majorly involved X-ray computed tomography.48-51 Tetrahertz
tomography imaging has been reported for the study of polymer-based parts and
suggested as a cheaper alternative to X-ray CT.52 SEM imaging can be applied to study
failure regions of fractured parts.53 Our research group pioneered the application of X-ray
and neutron grating-based interferometry to study additively manufactured parts. Some
of our works have been recently reported in peer reviewed journals.11-14 Grating-based
interferometry provides two additional sources of contrast mechanisms than X-ray radiography. Thus, there is a potential to extract more information about the printed part. A chapter is dedicated to addressing X-ray grating based interferometry (Chapter 3). Neutron interferometry studies of selective laser melted stainless steel tensile bars predicted the failure region before failure occurrence.11,12
The control in material placement afforded by additive manufacturing can be applied in material reaction or functionality, specifically in the way in which flame retardants are incorporated into otherwise flammable objects. It is important to see how the bulk material, with specific flame-retardant regions, “holds up” when exposed to heat.
1.2 Flame Retardants in Polymeric Materials
For the year 2017, the National Fire Protection Association reports that 3400 civilians died in fires and it is estimated that property damage was about $23 billion.54
materials is of huge concern. The chemical reactions involved take place in three interdependent regions namely: within the condensed phase of the polymer itself, at the interface between the condensed phase and the gas phase, and in the gas phase (Fig. 1.3).55,56 Volatile decomposition products may serve as fuel to sustain the burning process
and/or pose a risk of asphyxiation or toxicity on inhalation. The combustion of the volatiles
in the presence of oxygen involve a free radical chain mechanism.57,58
The following chemical reactions are possible steps in the combustion of methane
and show how the very reactive species H•, OH• and O•may be formed.58
CH4 + O2 → CH3• + H• + O2 H• + O2 ↔ OH• + O• CH4 + OH• → CH3• + H2O CH3• + O• → CH2O + H• CH2O +OH• → CHO• + H2O CHO• + O2 → H• + CO +O2 CO + OH• → CO2 + H•
In order for the process to be self-sustaining, it is necessary for the burning gases to feed back sufficient heat to the material to continue the production of gaseous fuel vapors or volatiles.59 The main exothermic reaction that provides most of the heat to sustain burning
is the reaction forming CO2.60
In practice, the mechanism of polymer decomposition, and hence the nature of the products formed, depends strongly on polymer structure and, in particular, on the nature of the substituent groups attached to the main chain.56 With thermoplastics, such as
simply ‘unzips’ to reform the original monomer leading to complete gasification and loss of physical integrity of the polymer.56 Thus, relatively large amounts of combustible
volatiles are formed.
Figure 1.3. The polymer combustion cycle.55 Oxygen in the air and flammable volatiles
produced as the polymer thermally decomposes, burn and supply heat to sustain the combustion of the polymer. Reprinted from Materials Science and Engineering R, 84, Malucelli G., Carosio F., Alongi J., Fina A., Frache A., and Camino G., Materials engineering for surface-confined flame retardancy, 1 - 20, Copyright (2014), with permission from Elsevier.
With other polymers, the breakdown process consists merely of the detachment of the side chains; some volatile products are thus formed but the main chain remains virtually intact and provides some solid residue.56 Alternatively, the polymer may suffer a
molecular rearrangement, with hardly any weight loss or formation of volatile products, to give a polymer with a different structure.56 This is the case with thermosetting plastics
(e.g. phenolic resins and polyethers), where combustion is mainly that of the smoldering
combustion of a solid residue or char.56 Charring may slowdown the combustion process
In addition to the chemical changes occurring due to heating, thermoplastics may undergo a deformation into a fluid state where the material can flow or drip.59 The effect
of dripping or flowing material may be positive, where non-flaming material flows away
from the heat source; or negative, where flaming material causes the fire to spread.59,62
Crystallinity, aromatic content and crosslinking can raise the glass transition temperature of a polymer.59
Today, synthetic polymeric materials find applications as effective substitutes for steel, metal, wood etc.63 It is important then that the flammability of the most widely used
polymers in applications where fire safety is a concern, is addressed.64 These areas
include building and construction, electrical and electronics, and furniture and
furnishings.64 Examples of these polymers are acrylonitrile butadiene styrene (ABS), low
density polyethylene (LDPE), polycarbonate, polystyrene, polyvinyl chloride,
polyurethanes etc.64 In a number of applications these material can be used only if they
have been provided with a satisfactory fire retardant behavior.55
Though a flammable material cannot be made completely non-combustible, flame retardants can make ignition more difficult and/or decrease the rate of flame propagation when the material is exposed to a source of heat.57 With a decreased rate of flame
propagation there is an increase in time available for escape and rescue from a fire.64
Flame retardants can act physically and/or chemically in one or more of the combustion regions to limit a material’s flammability.58,61 Physical action involves char formation,
dilution of combustible volatiles by the formation of inert gases and heat sink effects where
primarily involves intercepting the scavenging free radicals responsible for the branching of radical chain reactions in the flame.62
Different ways have been suggested to improve the fire behavior of polymers, such as the incorporation of FRs into polymers via melt blending (physical methods), the incorporation of FRs into the chemical structure of polymers (chemical methods, e.g. via copolymerization or grafting) and the coating of a FR layer on the surface of the material.66,67 Depending on how they are incorporated into the substrate, flame retardants
can be classified as reactive (chemically modifying the polymer or monomer) or additive (physically incorporated). In principle, incorporation of FRs into the chemical structure of polymers is the simplest way to achieve flame retardancy however, the resulting materials are generally very expensive to produce and do not possess many of the other physical
properties such as processability, needed for wide acceptance.56,61 Among these
strategies, the incorporation of FRs into polymers via melt blending provides an
acceptable compromise between cost and properties.61,67
Flame retardant additives are available as metal hydroxides, borates, halogenated
compounds, phosphorus-based compounds, nanoclays and nanotubes etc.65 For
halogenated flame retardants, the choice halogens are bromine and chlorine as they can
be readily released within the range of polymer combustion temperatures.65 Halogenated
flame retardants represent the most diversified class of flame retardants of which, brominated flame retardants maintain a good balance of physical properties, such as
good impact and tensile strength and a high heat distortion temperature.62
On pyrolysis halogenated flame retardants yield HX, X2 and RX products, where X
intercepting the combustion free radical reactions, where halogen radicals replace the more reactive H•, OH• and O• in the vapor phase.57,58,62,63,65 In the presence of a
halogenated flame retardant the following reactions are possible.65
RX → R• + X•
CH4 + X• → HX + CH3•
HX + H• → H2 + X•
HX + OH• → H2O + X•
The hydrogen halide HX is readily regenerated from the from halide species and the combustible volatile (methane in this example). Antimony(III) oxide Sb2O3 has been found
to be synergistic with halogenated flame retardants, catalyzing the dehalogenation of the
flame retardant and prolonging the residence of the halogens in the flame zone.62
Previously common additive flame retardants—polybrominated biphenyls (PBBs), hexabromocyclododecane (HBCD) and polybrominated diphenyl ether (PBDE)
compounds like penta- and octa-BDE have been phased out.68 Examples of Brominated
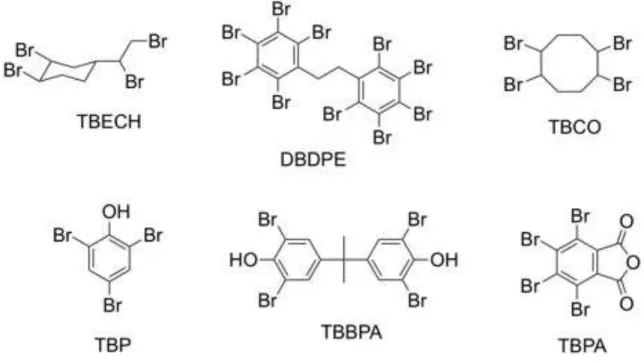
flame retardants currently used are shown in Fig. 1.4. 1,2,5,6-tetrabromocyclooctane (TBCO; used in expanded polystyrene), 1,2-dibromo-4-(1,2-dibromoethyl) cyclohexane (TBECH; used in polystyrene and polyurethane), and decabromodiphenylethane
(DBDPE; used in styrene) are used as additive brominated flame retardants.68 Reactive
brominated flame retardants include tetrabromobisphenol A (TBBPA; used in epoxies and ABS), tetrabromophthalic anhydride (TBPA; used in unsaturated polyesters, styrene-butadiene copolymers etc.), 2,4,6-tribromophenol (TBP; used in phenolics, epoxies).68
Figure 1.4. Examples of common brominated flame retardants.
Phosphorus-based flame retardants are the second most widely used class of flame retardants but are more specific in their action on certain polymers than the halogen-based products i.e. the mechanism of action depends on both the type of
phosphorus compound and the specific polymer.62 Phosphorus compounds are effective
flame retardants for oxygen- or nitrogen-containing polymers and show little efficacy in
polyolefins and styrenics.58,62 Phosphorus-containing flame retardants include phosphate
esters, phosphonates, phosphine oxides, chlorophosphates, chlorophosphonates, red phosphorus, and inorganic phosphates.58 They appear to function in the condensed
phase where they can promote char or coat the char surface with viscous phosphoric acids, in the vapor phase where they can function by the free radical trap process, or
Red phosphorus acts in the vapor phase through its breakdown in fire to produce P2 molecules.69 It is used in polycarbonates, polyamides, polyethylene terephthalate
etc.70 Though red phosphorus can react with moisture to form the toxic phosphine gas,
Figure 1.5. Examples of Phosphorus-based flame retardants.
phosphorus-based flame retardants are generally not harmful.69 Thermal oxidation of
phosphorus compounds mostly yield P2O5 which then hydrolyses to polyphosphoric acid
and contributes to char.69 Ammonium phosphate is a polymeric compound used in
intumescent coatings and paints.70 Phosphorus-based flame retardants have found
application in polycarbonates e.g. bisphenol A bis(diphenyl phosphate), in textiles e.g. diethylphosphinate salts, in epoxies e.g derivatives of
9,10-dihydro-9-oxa-10-phosphaphenanthrene-10-oxide (DOPO) etc.71,72 Triphenyl phosphate and resorcinol
bis(diphenyl phosphate) are used to retard flammability in polycarbonates and
polycarbonate blends such as polycarbonate/ABS.58 Structures of some common
phosphorus-based flame retardants that also contain halogens.70 They may be used in combination
with a bromine flame retardant. The mode of action is presumably in the vapor phase as these materials are volatile.58 Starch in addition to phosphorus-based flame retardant
improved the drippling behavior of PLA sheets and foams.73
Inorganic metal compounds e.g. aluminum hydroxide, magnesium hydroxide, and magnesium carbonate decompose endothermically lowering temperature and releasing water to dilute volatile products.58,69 They are cheap and easy to obtain but require high
loadings to be effective which can unfavorably modify the substrates’ properties.69 Major
applications include unsaturated polyester and polyethylene.58 Compounds of boron
interfere with the decomposition process to favor carbon formation over CO or CO2.74
They have a synergistic effect particularly with halogen systems.74 Aromatic boric acids
are used for ABS and polycarbonate systems.74 Sang et al. published an extensive review
on the studies of graphene and graphene oxide as stand-alone flame retardants and in
combination with known flame retardants.67 Inorganic nanomaterials-graphene
composites were deemed most promising. The flammability of paper was suppressed by coating pulp fibers with nanometer thin films of cationic chitosan and anionic poly(vinylphosponic acid).75 Starch in addition to phosphorus-based flame retardant
improved the dripping behavior of PLA sheets and foams.73
Restrictions on halogen-based fire retardants have led to an increased interest in building fire protections onto the polymer surface to prevent heat transfer and diffusion of volatiles across the material surface.55 A review by Malucelli et al. covers how new
nanotechnologies, like layer by layer nano-deposition, developed for polymer surface engineering, can be exploited for flame retardancy.55
Acrylonitrile-butadiene-styrene (ABS) is widely used due to an excellent
combination of mechanical, thermal and electrical properties, and chemical resistance.76
Fire retardance is generally imparted to ABS by means of additives, among which brominated organic compounds are widely used.76 In a study of the fire retarding effect of
the brominated additives nonabromobiphenyl (NBBP), octabromodiphenyl oxide (OBDPO) and bis(tribromophenoxy) ethane (BTBPE) on ABS, it was reported that their
fire retarding abilities depended on chemical structure.76 It was also concluded that the
antimony-bromine synergism in these systems, was mostly independent of the chemical structure of the brominated additive.76
Flame retardancy can be characterized using various tests such as cone calorimetry, limiting oxygen index (LOI), UL-94, single burning item (SBI) and glow
wire.65,66,77-79 Flame retardancy has also been studied using X-ray K-edge tomography
and X-ray interferometry.80,81 A method to estimate the relationship between a molecule’s
structure and its flammability by calculating an interaction index has been purposed.82
1.3 Flammability Tests
1.3.1 Limiting Oxygen Index (LOI)
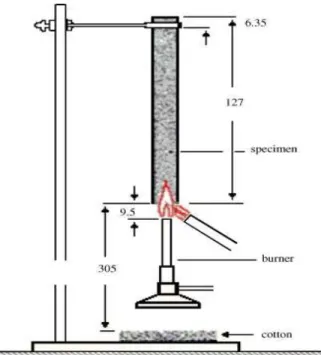
This is a simple and common test standardized as ASTM D2863 and ISO 4589. It determines the minimum oxygen concentration in an oxygen/nitrogen mixture that will just about support flaming combustion of a plastic substrate for a given amount of time or consume a certain amount of the substrate depending on the sample form.65,83 It is carried
out in a transparent glass tube chimney, which is purged with the oxygen/nitrogen gas mixture before the material is ignited (Figure 1.6). LOI is expressed in volume percent as:
𝐿𝑂𝐼 = 100 [𝑂2]
where [𝑂2] and [𝑁2] refers to the volume concentrations of oxygen and nitrogen in the mixture used.
Figure 1.6. The limiting oxygen index flammability test.
1.3.2 UL-94 Test
This test is approved by the Underwriters Laboratories to test the flammability of plastics used in devices and appliances. It is standardized in the United States as ASTM D3801. Test specimens of a prescribed dimension are clamped with the longitudinal axis vertically oriented (Figure 1.7). A blue flame with a 20 mm high central cone and a power of 50 W is applied to the test specimen for 10 s.65 The afterflame time t
1 (the time required
for the flame to extinguish) is recorded. After extinction, the flame is applied for another 10 s and the afterflame time t2 as well as the afterglow time t3 (the time required for the
fire glow to disappear) are recorded.65,84 Occurrence of material dripping and ignition of
a cotton ball placed beneath the tested specimen is noted. The test must be repeated for a total of five identical specimens. Depending on the afterflame and afterglow times and the ignition of the cotton ball by flaming drops or particles; the material may be classified as V-0, V-1 or V-2. V-2 is for a case where the cotton ball ignites.
A paper by Dupretz et al. introduced additional instrumentation to the UL-94 test to measure the weight of droplets, the weight loss of the sample as well as the temperature gradients during the fire test with the aim of better understanding the
mechanisms occurring in the material during the test.79
1.3.3 Glow-wire Ignition Test
The glow-wire test was designed to assess the susceptibility of electrical insulating materials or parts in contact with wires to ignition due to a glowing wire.85 Standardized
in the United States as ASTM D6194, it involves exposing a vertically supported standardized test specimen to electrical heating from a glow-wire set at pre-determined
temperatures.86 The glow-wire apparatus is designed to apply a force of 1 ±0.2 N to the
specimen. By increasing the applied temperature, the minimum temperature for glow-wire ignition is determined.
1.3.4 Cone Calorimeter Test
The cone calorimeter is a specialized piece of fire test equipment that is used to assess heat release data, as well as ignitability, mass loss and smoke released by burning materials.87 A schematic representation of the equipment is shown in Figure 1.8. The
cone calorimeter test is standardized in the United States as ASTM E1354 and internationally as ISO 5660. It is based on the measurement of the decreasing oxygen concentration in the combustion gases of a sample subjected to a given heat flux (in
general from 10 to 100 kW/m2).65 The gas flow; oxygen, CO and CO
2 concentrations and
smoke density are measured during the test.65
Figure 1.7. The UL-94 flammability test.65 Reprinted from Materials Science and
Engineering R, 63, Laoutid F., Bonnaud L., Alexandre M., Lopez-Cuesta J.-M., and Dubois Ph., New prospects in flame retardant polymer materials: From fundamentals to nanocomposites, 100 -125, Copyright (2008), with permission from Elsevier.
Figure 1.8. The cone calorimeter.65 The volatile combustion products, smoke and soot
are collected through the exhaust hood for analyses. Reprinted from Materials Science and Engineering R, 63, Laoutid F., Bonnaud L., Alexandre M., Lopez-Cuesta J.-M., and Dubois Ph., New prospects in flame retardant polymer materials: From fundamentals to
In this dissertation, subsurface incorporation of flame retardants by additive manufacturing was explored. Heat effects was studied by X-ray grating interferometry imaging with a modified glow-wire incorporated into the X–ray grating interferometer.
1.4 References
1. Gkoumas, S.; Wang, Z.; Abis, M.; Arboleda, C.; Tudosie, G.; Donath, T.; Brönnimann, C.; Schulze-Briese, C.; Stampanoni, M., Grating-based interferometry and hybrid photon counting detectors: Towards a new era in X-ray
medical imaging. Nuclear Instruments and Methods in Physics Research Section
A: Accelerators, Spectrometers, Detectors and Associated Equipment 2016,809, 23-30.
2. Panetta, D., Advances in X-ray detectors for clinical and preclinical Computed
Tomography. Nuclear Instruments and Methods in Physics Research Section A:
Accelerators, Spectrometers, Detectors and Associated Equipment 2016, 809, 2-12.
3. Donald, H. B.; Pascal, E.; Edgar, W., Review of third and next generation
synchrotron light sources. Journal of Physics B: Atomic, Molecular and Optical Physics 2005,38 (9), S773-S797.
4. Nakajima, K., Towards a table-top free-electron laser. Nature Physics 2008,4,
92-93.
5. Yaroshenko, A.; Hellbach, K.; Yildirim, A. Ö.; Conlon, T. M.; Fernandez, I. E.;
Bech, M.; Velroyen, A.; Meinel, F. G.; Auweter, S.; Reiser, M.; Eickelberg, O.; Pfeiffer, F., Improved In vivo Assessment of Pulmonary Fibrosis in Mice using
X-Ray Dark-Field Radiography. Scientific Reports 2015,5, No. 17492.
6. Prade, F.; Chabior, M.; Malm, F.; Grosse, C. U.; Pfeiffer, F., Observing the setting
and hardening of cementitious materials by X-ray dark-field radiography. Cement
and Concrete Research 2015,74, 19-25.
7. Sarapata, A.; Ruiz-Yaniz, M.; Zanette, I.; Rack, A.; Pfeiffer, F.; Herzen, J., Multi-contrast 3D X-ray imaging of porous and composite materials. Applied Physics Letters 2015,106 (15), 154102.
8. Trtik, P.; Dual, J.; Keunecke, D.; Mannes, D.; Niemz, P.; Stähli, P.; Kaestner, A.; Groso, A.; Stampanoni, M., 3D imaging of microstructure of spruce wood.
Journal of Structural Biology 2007, 159 (1), 46-55.
9. Malecki, A.; Eggl, E.; Schaff, F.; Potdevin, G.; Baum, T.; Garcia, E. G.; Bauer,
J. S.; Pfeiffer, F., Correlation of X-Ray Dark-Field Radiography to Mechanical
Sample Properties. Microscopy and Microanalysis 2014, 20 (05), 1528-1533.
10. Revol, V.; Hanser, C.; Krzemnicki, M., Characterization of pearls by X-ray phase
contrast imaging with a grating interferometer. Case Studies in Nondestructive Testing and Evaluation 2016,6, Part A, 1-7.
11. Brooks, A. J.; Yao, H.; Yuan, J.; Kio, O.; Lowery, C. G.; Markötter, H.; Kardjilov, N.; Guo, S.; Butler, L. G., Early detection of fracture failure in SLM AM tension
testing with Talbot-Lau neutron interferometry. Additive Manufacturing 2018, 22,
658-664.
12. Brooks, A. J.; Hussey, D. S.; Yao, H.; Haghshenas, A.; Yuan, J.; LaManna, J.
M.; Jacobson, D. L.; Lowery, C. G.; Kardjilov, N.; Guo, S.; Khonsari, M. M.; Butler, L. G., Neutron interferometry detection of early crack formation caused by
bending fatigue in additively manufactured SS316 dogbones. Materials & Design
2018,140, 420-430.
13. Brooks, A. J.; Ge, J.; Kirka, M. M.; Dehoff, R. R.; Bilheux, H. Z.; Kardjilov, N.; Manke, I.; Butler, L. G., Porosity detection in electron beam-melted Ti-6Al-4V using
high-resolution neutron imaging and grating-based interferometry. Progress in
Additive Manufacturing 2017,2 (3), 125-132.
14. Kio, O. J.; Yuan, J.; Brooks, A. J.; Knapp, G. L.; Ham, K.; Ge, J.; Van Loo, D.;
Butler, L. G., Non-destructive evaluation of additively manufactured polymer
objects using X-ray interferometry. Additive Manufacturing 2018,24, 364-372.
15. Ribeiro, F., 3d printing with metals. Computing & Control Engineering Journal
1998,9 (1), 31-38.
16. Campbell, T.; Williams, C.; Ivanova, O.; Garrett, B., Could 3D printing change the
world? Technologies, Potential, and Implications of Additive Manufacturing.
17. Conner, B. P.; Manogharan, G. P.; Martof, A. N.; Rodomsky, L. M.; Rodomsky, C. M.; Jordan, D. C.; Limperos, J. W., Making sense of 3-D printing: Creating a
map of additive manufacturing products and services. Additive Manufacturing
2014,1, 64-76.
18. Wong, K. V.; Hernandez, A., A review of additive manufacturing. ISRN Mechanical
Engineering 2012,2012, No. 208760.
19. Wendel, B.; Rietzel, D.; Kühnlein, F.; Feulner, R.; Hülder, G.; Schmachtenberg,
E., Additive processing of polymers. Macromolecular materials and engineering
2008,293 (10), 799-809.
20. Frazier, W. E., Metal Additive Manufacturing: A Review. Journal of Materials
Engineering and Performance 2014,23 (6), 1917-1928.
21. Martorelli, M.; Gerbino, S.; Giudice, M.; Ausiello, P., A comparison between customized clear and removable orthodontic appliances manufactured using RP
and CNC techniques. Dental Materials 2013,29 (2), e1-e10.
22. Inzana, J. A.; Olvera, D.; Fuller, S. M.; Kelly, J. P.; Graeve, O. A.; Schwarz, E. M.; Kates, S. L.; Awad, H. A., 3D printing of composite calcium phosphate and
collagen scaffolds for bone regeneration. Biomaterials 2014,35 (13), 4026-4034.
23. Zhou, Z.; Buchanan, F.; Mitchell, C.; Dunne, N., Printability of calcium phosphate:
Calcium sulfate powders for the application of tissue engineered bone scaffolds
using the 3D printing technique. Materials Science and Engineering: C 2014, 38,
1-10.
24. Skowyra, J.; Pietrzak, K.; Alhnan, M. A., Fabrication of extended-release
patient-tailored prednisolone tablets via fused deposition modelling (FDM) 3D printing.
European Journal of Pharmaceutical Sciences 2015,68, 11-17.
25. Walker, S. B.; Lewis, J. A., Reactive silver inks for patterning high-conductivity features at mild temperatures. Journal of the American Chemical Society 2012, 134 (3), 1419-1421.
26. Wei, T.-S.; Ahn, B. Y.; Grotto, J.; Lewis, J. A., 3D Printing of Customized Li-Ion
27. Hoerber, J.; Glasschroeder, J.; Pfeffer, M.; Schilp, J.; Zaeh, M.; Franke, J., Approaches for additive manufacturing of 3D electronic applications. Procedia CIRP 2014,17, 806-811.
28. Yokozeki, S.; Suzuki, T., Shearing Interferometer Using the Grating as the Beam
Splitter. Appl. Opt. 1971,10 (7), 1575-1580.
29. Seifi, M.; Salem, A.; Beuth, J.; Harrysson, O.; Lewandowski, J. J., Overview of
Materials Qualification Needs for Metal Additive Manufacturing. JOM 2016,68 (3),
747-764.
30. Waller, J. M.; Parker, B. H.; Hodges, K. L.; Burke, E. R.; Walker, J. L.
Nondestructive evaluation of additive manufacturing state-of-the-discipline report; Nov 2014.
31. Bourell, D.; Stucker, B.; Marchelli, G.; Prabhakar, R.; Storti, D.; Ganter, M., The
guide to glass 3D printing: developments, methods, diagnostics and results. Rapid
Prototyping Journal 2011,17 (3), 187-194.
32. Oropallo, W.; Piegl, L., Ten challenges in 3D printing. Engineering with Computers
2015, 1-14.
33. Turner, B. N.; Gold, S. A., A review of melt extrusion additive manufacturing
processes: II. Materials, dimensional accuracy, and surface roughness. Rapid
Prototyping Journal 2015,21 (3), 250-261.
34. Seppala, J. E.; Migler, K. D., Infrared thermography of welding zones produced by
polymer extrusion additive manufacturing. Additive manufacturing 2016, 12, 71-76.
35. Christ, S.; Schnabel, M.; Vorndran, E.; Groll, J.; Gbureck, U., Fiber reinforcement
during 3D printing. Materials Letters 2015,139, 165-168.
36. Shaffer, S.; Yang, K.; Vargas, J.; Di Prima, M. A.; Voit, W., On reducing anisotropy in 3D printed polymers via ionizing radiation. Polymer 2014, 55 (23), 5969-5979.
37. Ligon, S. C.; Liska, R.; Stampfl, J. r.; Gurr, M.; Mülhaupt, R., Polymers for 3D
printing and customized additive manufacturing. Chemical reviews 2017,117 (15),
10212-10290.
38. Domingo-Espin, M.; Puigoriol-Forcada, J. M.; Garcia-Granada, A.-A.; Lluma, J.;
Borros, S.; Reyes, G., Mechanical property characterization and simulation of fused deposition modeling Polycarbonate parts. Materials & Design 2015,83, 670-677.
39. Carneiro, O. S.; Silva, A. F.; Gomes, R., Fused deposition modeling with
polypropylene. Materials & Design 2015,83, 768-776.
40. Dunn, E. W.; Coates, G. W., Carbonylative Polymerization of Propylene Oxide: A
Multicatalytic Approach to the Synthesis of Poly(3-Hydroxybutyrate). Journal of the
American Chemical Society 2010,132 (33), 11412-11413.
41. Leja, K.; Lewandowicz, G., Polymer Biodegradation and Biodegradable
Polymers-a Review. Polish Journal of Environmental Studies 2010,19 (2), 256-266.
42. Přemysl, M.; Radek, P.; Ivana, S.; Veronika, M.; Soňa, K.; Silvestr, F.; Pavol,
A.; Ján, B., Effect of Selected Commercial Plasticizers on Mechanical, Thermal,
and Morphological Properties of Poly(3-hydroxybutyrate)/Poly(lactic
acid)/Plasticizer Biodegradable Blends for Three-Dimensional (3D) Print.
Materials, Vol 11, Iss 10, p 1893 (2018) 2018, (10), No. 1893.
43. Saska, S.; Pires, L. C.; Cominotte, M. A.; Mendes, L. S.; de Oliveira, M. F.; Maia, I. A.; da Silva, J. V. L.; Ribeiro, S. J. L.; Cirelli, J. A., Three-dimensional printing and in vitro evaluation of poly(3-hydroxybutyrate) scaffolds functionalized with osteogenic growth peptide for tissue engineering. Materials Science & Engineering C 2018,89, 265-273.
44. Ning, F.; Cong, W.; Qiu, J.; Wei, J.; Wang, S., Additive manufacturing of carbon
fiber reinforced thermoplastic composites using fused deposition modeling.
Composites Part B: Engineering 2015,80, 369-378.
45. Hwang, S.; Reyes, E. I.; Moon, K.-s.; Rumpf, R. C.; Kim, N. S., Thermo-mechanical Characterization of Metal/Polymer Composite Filaments and Printing Parameter Study for Fused Deposition Modeling in the 3D Printing Process.
46. Mohamed, O. A.; Masood, S. H.; Bhowmik, J. L., Optimization of fused deposition modeling process parameters: a review of current research and future prospects.
Advances in Manufacturing 2015,3 (1), 42-53.
47. Rodrı́guez, J. F.; Thomas, J. P.; Renaud, J. E., Design of Fused-Deposition ABS
Components for Stiffness and Strength. Journal of Mechanical Design 2003,125
(3), 545-551.
48. Moini, M.; Olek, J.; Magee, B.; Zavattieri, P.; Youngblood, J. In Additive Manufacturing and Characterization of Architectured Cement-Based Materials via X-ray Micro-computed Tomography, Cham, Springer International Publishing: Cham, 2018; pp 176-189.
49. Carlton, H. D.; Haboub, A.; Gallegos, G. F.; Parkinson, D. Y.; MacDowell, A. A.,
Damage evolution and failure mechanisms in additively manufactured stainless
steel. Materials Science and Engineering: A 2016,651, 406-414.
50. Thompson, A.; Maskery, I.; Leach, R. K., X-ray computed tomography for additive
manufacturing: a review. Measurement Science and Technology 2016,27 (7), No.
072001.
51. Shah, P.; Racasan, R.; Bills, P., Comparison of different additive manufacturing
methods using computed tomography. Case Studies in Nondestructive Testing
and Evaluation 2016,6, 69-78.
52. Perraud, J. B.; Obaton, A. F.; Bou-Sleiman, J.; Recur, B.; Balacey, H.; Darracq,
F.; Guillet, J. P.; Mounaix, P., Terahertz imaging and tomography as efficient
instruments for testing polymer additive manufacturing objects. Appl. Opt. 2016,
55 (13), 3462-3467.
53. Ziemian, C.; Sharma, M.; Ziemian, S., Anisotropic mechanical properties of ABS
parts fabricated by fused deposition modelling. In Mechanical engineering,
InTechOpen: 2012.
54. Evarts, B. Fire Loss in the United States During 2017; National Fire Protection Association, Quincy, MA: 2018.
55. Malucelli, G.; Carosio, F.; Alongi, J.; Fina, A.; Frache, A.; Camino, G., Materials
56. Cullis, C. F., Thermal stability and flammability of organic polymers. British polymer journal 1984,16 (4), 253-257.
57. Camino, G.; Costa, L., Performance and mechanisms of fire retardants in
polymers—A review. Polymer Degradation and Stability 1988,20 (3), 271-294.
58. Green, J., Mechanisms for flame retardancy and smoke suppression-a review.
Journal of Fire & Flammability 1996,14 (6), 426-442.
59. Beyler, C. L.; Hirschler, M. M., Thermal decomposition of polymers. SFPE
handbook of fire protection engineering 2002,2, 110-131.
60. Xu, T., Recent Developments in Different Techniques Used for the Flame
Retardancy. In Flame Retardants: Polymer Blends, Composites and
Nanocomposites, Visakh, P. M.; Arao, Y., Eds. Springer International Publishing: Cham, 2015; pp 45-77.
61. Bourbigot, S.; Fontaine, G., Flame retardancy of polylactide: an overview. Polymer
Chemistry 2010,1 (9), 1413-1422.
62. Levchik, S. V., Introduction to flame retardancy and polymer flammability. Flame
retardant polymer nanocomposites 2007, 1-29.
63. Aseeva, R. M.; Zaikov, G. E., Flammability of polymeric materials. In Key Polymers
Properties and Performance, Springer: 1985; pp 171-229.
64. Hirschler, M. M., Flame retardants and heat release: review of data on individual
polymers. Fire and Materials 2015,39 (3), 232-258.
65. Laoutid, F.; Bonnaud, L.; Alexandre, M.; Lopez-Cuesta, J. M.; Dubois, P., New
prospects in flame retardant polymer materials: From fundamentals to
nanocomposites. Materials Science and Engineering: R: Reports 2009, 63 (3),
100-125.
66. Vahabi, H.; Sonnier, R.; Ferry, L., Effects of ageing on the fire behaviour of
67. Sang, B.; Li, Z.-w.; Li, X.-h.; Yu, L.-g.; Zhang, Z.-j., Graphene-based flame
retardants: a review. Journal of materials science 2016,51 (18), 8271-8295.
68. Guerra, P.; Alaee, M.; Eljarrat, E.; Barceló, D., Introduction to Brominated Flame
Retardants: Commercially Products, Applications, and Physicochemical Properties. In Brominated Flame Retardants, Eljarrat, E.; Barceló, D., Eds. Springer Berlin Heidelberg: Berlin, Heidelberg, 2011; pp 1-17.
69. Rakotomalala, M.; Wagner, S.; Döring, M., Recent developments in halogen free
flame retardants for epoxy resins for electrical and electronic applications.
Materials 2010,3 (8), 4300-4327.
70. Mihajlović, I., Recent Development of Phosphorus Flame Retardants in
Thermoplastic Blends and Nanocomposites. In Flame Retardants: Polymer
Blends, Composites and Nanocomposites, Visakh, P. M.; Arao, Y., Eds. Springer International Publishing: Cham, 2015; pp 79-114.
71. Levchik, S. V.; Weil, E. D., A Review of Recent Progress in Phosphorus-based
Flame Retardants. Journal of Fire Sciences 2006, 24 (5), 345-364.
72. Pack, S. In A review of non-halogen flame retardants in epoxy-based composites
and nanocomposites: Flame retardancy and rheological properties, Flame Retardants, Springer: 2015; pp 115-130.
73. Wang, J.; Ren, Q.; Zheng, W.; Zhai, W., Improved flame-retardant properties of
poly (lactic acid) foams using starch as a natural charring agent. Industrial & Engineering Chemistry Research 2014,53 (4), 1422-1430.
74. Lu, S.-Y.; Hamerton, I., Recent developments in the chemistry of halogen-free
flame retardant polymers. Progress in Polymer Science 2002,27 (8), 1661-1712.
75. Köklükaya, O.; Carosio, F.; Grunlan, J. C.; Wågberg, L., Flame-Retardant Paper
from Wood Fibers Functionalized via Layer-by-Layer Assembly. ACS Applied
Materials & Interfaces 2015,7 (42), 23750-23759.
76. di Cortemiglia, M. L.; Camino, G.; Costa, L.; Roma, P.; Rossi, A., Mechanism of
action and pyrolysis of brominated fire retardants in acrylonitrile-butadiene-styrene
77. Claus, V.; Anett, M.; Dieter, L.; Frank, T., Characterization of the Burning
Behaviour of Plastics by a New Method. Open Journal of Polymer Chemistry 2012,
2, 86-90.
78. Acquasanta, F.; Berti, C.; Colonna, M.; Fiorini, M.; Karanam, S., Glow wire ignition temperature (GWIT) and comparative tracking index (CTI) of glass fibre
filled engineering polymers, blends and flame retarded formulations. Polymer
Degradation and Stability 2011,96 (12), 2098-2103.
79. Dupretz, R.; Fontaine, G.; Duquesne, S.; Bourbigot, S., Instrumentation of UL-94
test: understanding of mechanisms involved in fire retardancy of polymers.
Polymers for Advanced Technologies 2015,26 (7), 865-873.
80. Olatinwo, M. B.; Ham, K.; McCarney, J.; Marathe, S.; Ge, J.; Knapp, G.; Butler,
L. G., Analysis of flame retardancy in polymer blends by synchrotron X-ray K-edge tomography and interferometric phase contrast movies. The Journal of Physical Chemistry B 2016,120 (9), 2612-2624.
81. Olatinwo, M. B.; Ham, K.; McCarney, J.; Marathe, S.; Ge, J.; Knapp, G.; Butler,
L. G., Recent applications of X-ray grating interferometry imaging to evaluate flame
retardancy performance of brominated flame retardant. Polymer Degradation and
Stability 2017,138, 1-11.
82. Sonnier, R.; Negrell-Guirao, C.; Vahabi, H.; Otazaghine, B.; David, G.;
Lopez-Cuesta, J. M., Relationships between the molecular structure and the flammability of polymers: Study of phosphonate functions using microscale combustion
calorimeter. Polymer 2012,53 (6), 1258-1266.
83. ASTM, Standard Test Method for Measuring the Minimum Oxygen Concentration
to Support Candle-Like Combustion of Plastics (Oxygen Index). ASTM International: West Conshohocken, PA 2017; Vol. D2863 − 17a.
84. ASTM, Standard Test Method for Measuring the Comparative Burning
Characteristics of Solid Plastics in a Vertical Position. ASTM International: West Conshohocken, PA 2010; Vol. D3801 − 10.
85. Guillaume, E.; Yardin, C.; Aumaitre, S.; Rumbau, V., Uncertainty determination
of glow-wire test for ignition of materials. Journal of Fire Sciences 2011, 29 (6), 509-518.
86. ASTM, Standard Test Method for Glow-Wire Ignition of Materials. ASTM International: West Conshohocken, PA, 2014; Vol. D6194 − 14.
87. Hirschler, M. M., Flame retardants and heat release: review of traditional studies
CHAPTER 2
FROM X-RAYS TO IMAGES
Since its published existence by W. C. Röntgen in 1896, X-rays have become an indispensable tool in seeing the inside of materials that are opaque to visible light.1,2 Soon
after its discovery, ray imaging became the general technique for imaging bones.
X-rays have found wide application in medicine and materials science.3-5
X-rays originate from the deceleration of fast-moving particles (bremsstrahlung
radiation) or from the relaxation of outer-shell electrons to vacant inner-shell positions where the energy difference falls within the range for X-rays (fluorescent radiation). The common X-ray sources are X-ray tubes and synchrotrons.
This chapter focuses on the common sources of X-rays used in imaging as well as the detection and conversion of X-ray signal intensities to usable images.
2.1 X-ray Interaction with Matter
As observed with visible light, X-ray photons can be scattered or absorbed. Due to the higher energy of X-rays however, the level of interaction involved is different and the effects e.g. refraction, reflection and the photoelectric effect are not visible to the naked eye. X-rays are electromagnetic waves with energy in the range of about 0.12 keV to over
100 keV (wavelength of 103 Å to 0.124 Å, respectively).6 These energies increase the
probability of X-rays interacting more with tightly bound inner-shell electrons than with valence electrons. For instance, X-rays of energy 1.84 keV or more can remove a K-shell electron from a silicon atom. Based on the wave-particle duality concept, X-rays can be
treated as consisting of packets of energy or photons, the energy of which is calculated as,
ℇ = ℎ𝑣 = ℎ𝑐
𝜆 , [2.1]
where ℎ = 6.626 x 10⁻³⁴ J s is Planck’s constant, is the frequency of the radiation/waves,
𝑐 = 2.998 x 10⁸ m/s is the speed of light in a vacuum and is the wavelength in vacuum.
Details on the forms of X-ray interaction with matter are presented below.
2.1.1 Scattering of X-rays
X-rays travelling through a material are primarily scattered by electrons. Classically, when an X-ray beam interacts with an electron, the oscillating electric field of
the waves causes the electron to oscillate with the same frequency and direction.7,8 As
expected for a moving charged particle, this vibration is accompanied by the radiation of electromagnetic radiation. The emitted radiation has similar energy as the incident radiation thus, scattering is elastic and described as Thomson scattering.7,8 The
interaction is depicted in Figure 2.1, where 𝑘𝑖 and 𝑘𝑓 are the wavevectors of the incident and scattered waves, respectively. The vectorial difference between the incident and
Figure 2.1. Elastic scattering of X-rays. (a) No change in energy i.e. 𝑘𝑖 = 𝑘𝑓. (b) The vectorial difference, q, between the incident and scattered rays is easily determined geometrically.
b
a
scattered rays, 𝑘𝑖− 𝑘𝑓 = 𝑞, is called the scattering vector and for elastic scattering at an angle 2𝜃 it has a magnitude of 𝑞 = 4𝜋/𝜆 sin𝜃.
The ability of an electron to scatter X-rays is expressed in terms of a scattering length. For the elastic scattering of an unbound electron it is referred to as the Thomson scattering length, 𝑟0, calculated as:8
𝑟0 = ( 𝑒
2
4𝜋𝜖0𝑚𝑐2
) = 2.82 × 10⁻⁵Å. [2.2]
Where𝑒 and 𝑚 are the charge and mass of an electron, respectively. 𝜖0 is the permittivity of a vacuum valued at 8.85 x 10⁻¹² F/m. Another name for 𝑟
0 is the classical electron radius.
A quantum description of electromagnetic radiation however acknowledges the possibility of energy being transferred to the electron so that the emitted photons are of lower energy relative to the incident.7 Scattering in this case is therefore inelastic and
described as Compton scattering. The Compton scattering length, 𝜆𝑐, is calculated as:
𝜆𝑐 =
ℎ
𝑚𝑐 = 2.43 × 10
−2Å. [2.3]
The energy loss due to Compton scattering can be determined from the following equation.8 ℎ𝑣𝑖 ℎ𝑣𝑓 = 𝑘𝑖 𝑘𝑓 = 𝜆𝑓 𝜆𝑖 = 1 + 𝜆𝑐𝑘𝑖(1 − 𝑐𝑜𝑠ψ) , [2.4]
where 𝜓 is the scattering angle and subscripts𝑖 and 𝑓 refer to the incident and scattered photons, respectively.
From Equation 2.4, energy loss from Compton scattering increases with increasing incident X-ray energy and decreasing scattering angle. At X-ray energies of around 100
keV, Compton scattering is almost constant and shows less dependence on the scattering angle.9
2.1.2 Refraction and Reflection
Refraction and reflection are resultant scattering effects of X-rays interacting with the multitude of atoms that make up a material. An X-ray wavefront experiences a change in shape on passing through a sample due to variation in thickness and X-ray refractive index.10
For X-rays the refractive index, 𝑛, is less than unity and is given by,
𝑛 = 1 − 𝛿 + 𝑖𝛽 , [2.5]
where 𝛿 is the refractive index decrement and 𝛽 is the absorption index.7 𝛿 is related to
the scattering properties of the medium by
𝛿(𝑥, 𝑦, 𝑧) =𝑟0
2
2𝜋 ∑ 𝑁𝑘(𝑥, 𝑦, 𝑧)
𝑘
(𝑍𝑘+ 𝑓𝑘′), [2.6]
where 𝑁𝑘(𝑥, 𝑦, 𝑧), 𝑍𝑘, and 𝑓𝑘′ are the atomic density, atomic number and the real part for
the anomalous dispersion correction of element k, respectively.11 𝑟
0 is the earlier described classical electron radius.
The phase change, Φ, for a ray path through an object relative to vacuum is given
by,
Φ(𝑥, 𝑦) =2𝜋 ∫ 𝛿(𝑥, 𝑦, 𝑧) 𝑑𝑧 , [2.7]
where the optic axis is parallel to z.11 Thus Φ is the projection of 𝛿 across the object. The
change in phase provides a contrast basis in X-ray imaging and would be further discussed in the interferometry section.