Outlier Filtering for Identification of Gene Regulations in Microarray Time-Series
Data
Andy C. Yang, Hui-Huang Hsu, and Ming-Da Lu
Department of Computer Science and Information Engineering
Tamkang University, Taipei, Taiwan, R.O.C.
E-mail: [email protected]; [email protected]
Abstract
Microarray technology provides an opportunity for scientists to analyze thousands of gene expression profiles simultaneously. Time-series microarray data are gene expression values generated from microarray experiments within certain time intervals. Scientists can infer gene regulations in a biological system by judging whether two genes present similar gene expression values in microarray time-series data. Recently, a great many methods are widely applied on microarray time-series data to find out the similarity and the correlation degree among genes. Existing approaches including traditional Pearson coefficient correlation, Bayesian networks, clustering analysis, classification methods, and correlation analysis have individual disadvantages such as high computational complexity or they may be unsuitable for some microarray data. Traditional Pearson correlation coefficient is a numeric measuring method which gives novel effectiveness on two sets of numeric data. However, it is not suitable to be applied on microarray time-series data because of the existence of outliers among gene expression values. This paper presents a novel method of applying Pearson correlation coefficient along with an outlier filtering procedure on the widely-used microarray time-series datasets. Results show that the proposed method produces a better outcome compared with traditional Pearson correlation coefficient on the same dataset. Results show that the proposed method not only can find out certain more known regulatory gene pairs, but also keeps rational computational time.
Keywords:Microarray, Time-Series Data, Gene Expression Analysis, Gene Regulation Identification, Outlier Filtering.
1. Introduction
Recently, microarray technology has become one of the important tools in biological researches. It makes it possible to monitor mRNA levels of thousands of gene expressions in a single experiment [1]. Due to this high
throughput biological technology, numerous gene expression data are generated simultaneously. In the meanwhile, the large amounts of data provide us great challenges of analysis. Particularly, one of the major researches aims to take advantage of these data to find out the relationship between genes that gives a hint to infer how these genes interact with each other in a biological process.
Microarray time-series data [2, 3] are produced by using cDNA microarray technology to measure thousands of gene expression values that reflect the reaction of each gene after the hybridization effect across time. Each gene expression value denotes the sensitive reaction result of the corresponding gene. These quantitative values come in the format of logarithm which represents distinct intensity of expressions. This kind of data provides a possible means for the inference of transcriptional regulatory relationships among the genes on the microarray gene chip. The discovery of specific gene pairs with highly-correlated relations could provide valuable information for biologists to predict important biological reactions.
Microarray time-series data are matrix-liked collections of gene expression values across a certain of time as Table 1 shown in next page. Each row in the microarray time-series data stands for a gene ORF profile, and each column represents the specific time point. Different kinds of microarray time-series data may come in different time slots due to distinct gene sampling time and frequency. Gene expression values in the microarray time-series data may be positive or negative numbers. The task is to analyze these gene expression values in different time slots and find the correlations between genes for the inferring of gene-gene interactions. The commonest way of the analysis on this kind of data is to measure pairwise correlation of each pair of any two genes.
In the gene cell cycle or in a biological process, the expression level of one gene is usually regulated by other genes. There might be one-to-one or many-to-one regulatory relations. If one gene regulates other genes, it is called an input gene. On the contrary, if one gene is a regulated target, it is called an output gene [4]. For transcriptional regulations among all genes, there are two sorts of situations, activation and inhibition. In activation regulations, the expression of International Conference on Complex, Intelligent and Software Intensive Systems
the output gene is increased with the presence of the input gene, and vice versa. In other words, an activator gene regulates the activatee gene in the biological process so that the gene expression level of the two genes forms the trend of positive correlations. On the contrary, a trend of negative correlations results from the inhibition regulations.
Table 1. Microarray Time-series Data
Gene Time Slot 1 Time Slot 2 … Time Slot n
Gene #1 0.56 0.80 0.90
Gene #2 -0.24 -0.1 0.60
Gene #3 0.12 0.24 0.50
… … … …
Gene #n 0.78 -0.14 -0.56
As a result, the aim of the analysis on microarray time-series data is to observe and find out whether there exists any pair of genes that have highly-correlated relations. Researches on this issue have been worked for these years, and a variety of approaches are proposed. Common proposed solutions include clustering analysis [5, 6, 7, 8], spectral analysis [9, 10], similarity analysis [11, 12], and Bayesian networks [13, 14]. These approaches are widely applied on the inference and prediction of gene-gene relations in microarray time-series data. Although some of these proposed approaches may have a success for the analysis of the microarray time-series data, they may not work for particular datasets or even need an exhausted computational time. Pearson correlation coefficient is a commonly-used statistical and mathematical method to measure the correlation for the two sets of data. It has been successfully applied in many fields but it is not suitable for the analysis of microarray time-series data due to some limitations such as the existence of outliers. Moreover, local similarity plays an important role rather than the consideration for the whole gene expression levels in microarray time-series data. This brings the disadvantage for the application of traditional Pearson correlation coefficient.
The paper presents a method based on Pearson correlation coefficient to measure the gene-gene correlation relations by filtering gene expression values at particular time slots in microarray time-series data. With the proposed method, significant outliers of raw data are removed so that more known gene regulations can be identified. Implementation of this method on the commonly-used dataset is performed, and the results show that the proposed method can search out more known gene regulations compared with original Pearson correlation coefficient. Additionally, the proposed method is very simple and it does not require too much computational time.
Remaining of this paper is organized as follows. In Section 2, we give a brief description about the involved
microarray time-series dataset. Our proposed method is shown in details in Section 3. Analysis and discussions for the experimental results are presented in Section 4. The concluding remarks are made in Section 5 with future work.
2. Datasets
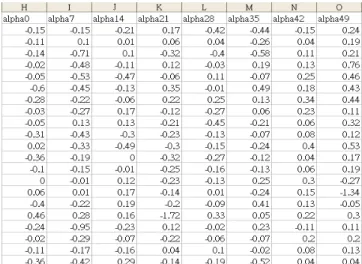
This section draws the description of the dataset involved in our evaluations. Spellman et al. and Cho et al. provided the yeast microarray dataset (http://genome-www.stanford.edu/cellcycle) [3, 7]. The data was obtained for genes of Yeast Saccharomyces cerevisiae cells that were collected with four synchronization methods: alpha-factor, cdc15, cdc28, and elutriation [15]. These four subsets of the dataset contain totally 6178 gene ORF profiles with their expression values across individual amounts of time slots. For example, the alpha subset contains 18 time points with seven minutes as the time interval, while the cdc28 contains 17 time points with ten minutes as the time interval. These four kinds of subsets record the gene expression reactions during different phases in cell cycle. However, some of the 6178 gene ORF profiles are incomplete with missing values at certain time slots. The Spellman’s dataset is as shown in Figure 1.
Figure 1. Spellman’s Yeast Dataset
Filkov et al. reviewed related literatures and collected all known gene regulations of alpha and cdc28 subsets in Spellman’s yeast cell dataset [16]. A database for recording all these known gene regulations was also constructed. In our evaluation, the known gene regulations recorded in Filkov’s database are taken as the validation datasets. In the database, number of recorded gene activations and inhibitions for alpha subset is 343 and 96 respectively, while for cdc28 subset is 469 and 155. All these regulations come in the format of A (+) B which denotes gene A is an activator that activates gene B. Similarly, C (-) D represents an inhibitor gene C inhibits gene D. For example, ABF1 (+)
ACS1 is an activation regulation with gene ABF1 as the activator. However, among these regulations recorded in the database, there might be a widespread situation that one gene could be the activator or inhibitor for more than one genes. For instance, gene ABF1 stands for the activator for totally eight different genes in cdc28 subset. Therefore, the pre-processing of the raw data is necessary. Firstly, we parse all regulations of alpha and cdc28 subsets in Filkov’s database and retrieve unrepeatable involved genes. The result of the parsing by our program is shown in Table 2.
Table 2. Parsing Result for Gene Regulations Dataset No. of Genes Activations No. of Inhibitions No. of Total
alpha 295 343 96 439
cdc28 357 466 155 621
After the involved genes are parsed out, the next step is to map these hundreds of genes to the raw Spellman’s datasets to match the corresponding gene expression values. Nevertheless, gene names in Filkov’s database are denoted as the gene standard name, while the gene systematic names are used in Spellman’s dataset. As a result, a mapping procedure between gene standard name and systematic name is required.
For this purpose, we designed another program to perform this operation. The reference database for this phase is the Saccharomyces Genome Database (http://www.yeastgenome.org/) [17]. The SGD database acts as a platform for biologists to refer and query yeast gene information including the gene standard name and systematic name. During the process of gene name mapping, we found that some of the gene standard name in Filkov’s database cannot be found in Spellman’s dataset due to the different naming conventions. For example, the mapping gene systematic name for gene with standard name STA1 cannot be found in the SGD database. Consequently, regulations with gene STA1 are filtered that causes the decrease of gene activations in cdc28 subset from 469 to 466.
So far, we have purified the involved gene expression values and the corresponding gene standard name as the implementation dataset for our proposed method. For alpha subset, total amount of pairwise gene combinations is C(295,2) equals to 43365, and for cdc28 subset is C(357,2) equals to 63546. Eventually, some missing regulations are replenished and the final amount of pairwise gene combinations for alpha and cdc28 subsets is 43366 and 63548. Known regulations in Filkov’s database are marked as the validation measurement to estimate the correctness of the proposed method.
3. Correlation with Outlier Filtering
In Filkov’s database, diagrams of curves of the pairwise genes in alpha and cdc28 dataset are depicted. According to these graphs, we can find that most of the pairwise genes come along with several local maximum or minimum values, which are so-called outliers. To filter these crucial outliers, our proposed method aims to refine the insufficiency of applying traditional Pearson correlation coefficient to this question and make it possible for measuring the gene-gene relations of the microarray time-series data. Pearson correlation coefficient (PCC) is a widely-used correlation-based method to measure the correlation intensity of the given two close dataset. It is shown as the following equation (1).
(
)
(
)
∑
(
∑
)
∑
∑
∑
∑ ∑
− − − = n Y Y n X X n Y X Y X i i i i i i i i XY 2 2 2 2 γ(1)
Despite the convenience and practicality of Pearson correlation coefficient, there are still limitations if applied on the analysis of microarray time-series data. The critical problem is that outliers in the datasets influence the Pearson correlation coefficient measuring results very much. The gene expression values in microarray time-series data range a lot. Moreover, even two genes own a highly-correlated degree of Pearson correlation coefficient (usually > 0.7), it is not definitely to say that these two genes are with regulatory relationship. The reason is that sometimes measuring correlations of gene expression values under certain of time slots are much more important than the correlations of whole gene expression values. This phenomenon results from the intermittent gene regulation reactions during all time slots so that the local maximum correlations attract more attentions than correlations of whole gene expression values.
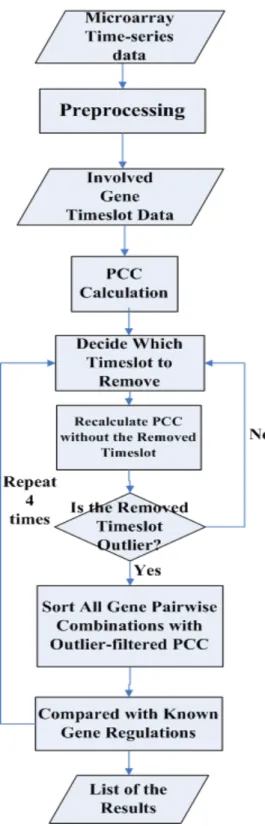
To overcome this problem, our method first measures the Pearson correlation coefficient of each pair of gene expression values across all time slots as a controlled sample. Subsequently, recalculate the Pearson correlation coefficient with filtering time slots from the first one to the last one. For each time slot point, if filtering the gene expression value at it can increase the absolute value of the correlation most, the gene expression value at this time slot is taken as the outlier for the gene pair. This time slot point is then removed. This operation is performed for five times, and the calculating results are recorded for all pairwise gene combinations. That is, Pearson correlation coefficient of all time slot, one-outlier filtering, two-outlier filtering, three-outlier filtering, four-three-outlier filtering to five-three-outlier filtering of all gene pairwise combinations are generated. Finally, we compare the results in six different kinds of situations with known gene regulations in Filkov’s database and count the
number of hitting regulations for each situation. The flowchart of the proposed method is shown in Figure 2.
Figure 2. Flowchart of the Proposed Method
The detail algorithm of the proposed method is described as follows.
Algorithm for the proposed method:
I. First calculate the PCC with all time slot points, we get PCCall
II. For involved time slot points (originally 1, 2, 3 … N) in each pair of genes, remove one time slot point from time slot number one to number N, recalculate PCC for each filter phase. Suppose PCC generated are PCC1, PCC2, PCC3 ,…, PCCn
III. Calculate the difference (absolute value) of (PCC1,
PCCall), (PCC2, PCCall), (PCC3, PCCall) … (PCCn,
PCCall), we get Difference1, Difference2, Difference3 ,…, DifferenceN
IV. Choose the Maximum value Difference_i which increases with filtering time slot point i from Difference1 to DifferenceN
V. Set time slot point i as the outlier and remove time slot point i from the involved time slot points
VI. Repeat step II to step V for four times without filtered time slot point. Record all the correlation coefficients for each time
4. Experimental Results and Discussion
After the generation of calculating results for each outlier filtering, the number of known regulations on the results with marked symbols is gathered. The calculating results are shown in Figure 3.
Figure 3. Output Sample
As shown in Figure 3, each row represents one of the pairwise combinational pairs. Rows with (+) or (-) and number marks are known activations and inhibitions. All the marked combinations are referred to Filkov’s known gene transcriptional regulations. We then sort this data with Pearson correlation coefficient on all time slot points and Pearson correlation coefficient on time slot points without filtered outliers for each time. Subsequently, we select significant gene combinations with highly-correlated Pearson correlation coefficient. Here we set the threshold value with 0.7 because Pearson correlation coefficient is usually said as characteristic when its absolute value is
larger than 0.7. Finally, we compare these highly-correlated combinations with marked known gene regulations and count the number of matching ones. The induced results are shown in Table 3 in next page.
Table 3. Number of Identified Gene Regulations with |PCC| >0.7 # of outliers Dataset 0 1 2 3 4 5
alpha (+)
13 18 21 19 15 5alpha (-)
0 1 1 1 2 0cdc28 (+)
28 36 36 33 22 3cdc28 (-)
7 11 12 13 7 0 Table 3 denotes number of identified gene regulations by the proposed method with Pearson correlation coefficient threshold set to 0.7. Individual results compared with known gene regulations in two subsets: alpha, cdc28 with activations (+) and inhibitions (-) in the subset are shown in the table respectively. In Table 3, the four rows stand for four kinds of regulations in the subsets, while the six columns denote the number of filtered outliers. In our evaluation, the number of outliers to be filtered is limited to at most five because filtering too many time slots in original microarray time-series data is meaningless. According to Table 3, we can see that the proposed method can effectively identify more known gene regulations compared with calculating Pearson correlation coefficient on all time slots without outlier filtering in the microarray time-series dataset.For example, in alpha subset, performing traditional Pearson correlation coefficient gives the ability to identify 13 known gene activation regulations and no known gene inhibition regulations if the threshold is set to 0.7. With our method, 18 known gene activations and one known gene inhibitions are found with one outlier filtering. Furthermore, in cdc28 subset with one or two outlier filtering, eight more known gene activations and five more known gene inhibitions are indentified compared with zero-outlier-filtering situations. Table 4 lists the extra gene regulations found by our method but not appear in zero-outlier-filtering situations.
In Table 4, extra known gene regulations compared with performing Pearson correlation coefficient on gene expression values at all timeslots are listed. The two rows stand for two kinds of subset involved, while the two columns list number of filtered outliers. Regulations listed in the table with (+) symbols are activations and those with (-) represent inhibitions. For example, one of the six regulations in the first field “HSF(+)KAR2” can be explained as gene HSF activates gene KAR2. Similarly, “TUP1(-)HXT4” tells that gene TUP1 inhibits gene HXT4. From the table, it is shown that six and 12 more known gene regulations are identified by the proposed method with one filtered outlier in alpha and cdc28 subsets respectively
compared with performing Pearson correlation coefficient on all timeslots without filtering outliers. Obviously, the proposed method does a successful work for identifying known gene regulations among microarray time-series data.
Table 4. Extra Gene Regulations Found by the Proposed Method # of outliers Dataset
One Filtered
Outlier
Two Filtered
Outliers
alpha
subset
HSF1(+)KAR2 RIM11(+)IME1 IME1(+)RIM11 SEC11(+)KAR2 CLN3(+)CLN2 TUP1(-)HXT4 HSF1(+)KAR2 RIM11(+)IME1 IME1(+)RIM11 SEC11(+)KAR2 CLN3(+)CLN2 UME6(+)OPI3 CDC19(+)RAP1 HAP2(+)QCR8 TUP1(-)HXT4cdc28
subset
CYC7(+)COX5A RCS1(+)FET3 GCY1(+)GAL4 PET9(+)HAP4 LYS14(+)LYS1 SPT16(+)CLN1 PMA1(+)RAP1 HAP1(+)ROX1 HEM13(-)ROX1 STE3(-)SIN3 NGG1(-)PDR1 MTH1(-)HXT3 CYC7(+)COX5A RCS1(+)FET3 GCY1(+)GAL4 PET9(+)HAP4 SPT16(+)CLN1 PMA1(+)RAP1 HAP1(+)ROX1 GAL10(+)GAL4 NGG1(-)PDR1 MTH1(-)HXT3 SSA1(-)SSN8 UME6(-)IME1 STE3(-)SIN3 Some issues about the experimental results must be discussed here. First, we find that our method has the best effect if the number of outliers to be filtered is set to two in alpha subset and cdc28 subset. The explanation for this result is that there are about two crucial outlier values in alpha and cdc28 subsets. Results show that performing the proposed method with two filtered outliers can identify the most regulatory genes. In other words, there are significantly about two outliers for genes in alpha and cdc28 dataset, and the gene regulation prediction can thus be very easy with the proposed method. So far, a biological meaning of the reason why there are approximately two outliers in the dataset is still being surveyed. We are also working on indentifying the relations between the number of outliers and the individual microarray time-series dataset themselves. Secondly, the proposed method requires not much computational time. For deciding which outlier to be removed each time in the loop, the program only calculatesPearson correlation coefficient for the same times as the number of timeslots in the subsets. If there are N genes and M time slots, the total running time will be O(N2*M).
Despite the time complexity for the proposed algorithm cannot be taken as linear, there are only 17 or 18 time slots and 6178 genes in the involved microarray time-series data. All operations can be performed in an expectable computational time. As a result, the proposed method is effective and not time-consuming.
5. Conclusion and Future Work
This paper presents a method of refining traditional Pearson correlation coefficient with outlier filtering. Experiments are performed on the alpha and cdc28 microarray time-series datasets. Compared with traditional Pearson correlation coefficient, the proposed method brings out better results. It can also validate the assumption that outliers do exist in the involved microarray time series-data. The results show that the proposed method can not only find out certain more known gene regulations, but also keeps rational computational time. This aids the prediction of gene regulatory relationship in microarray time-series datasets.
As for the future work, we will survey the number of outliers of distinct microarray time-series data and its biological meaning. Moreover, we will take the missing value imputation into consideration. In this paper, missing values are imputed with a primary trick which is not so robust. We will develop a better missing value imputation technique so that the gene regulation prediction can be more accurate and effective.
References
[1] Vincent S. Tseng, Lien-Chin Chen, and Jian-Jie Chen, “Gene relation discovery by mining similar subsequences in
time-series microarray data.” Proceedings of the 2007 IEEE
Symposium on Computational Intelligence in Bioinformatics and Computational Biology (CIBCB2007), pp.106-112. [2] J. DeRisi, R. Iyer, and Brown P, “Exploring the metabolic and
genetic control of gene expression on a genomic scale.”
Science 278, pp.680-686, 1997.
[3] Paul T. Spellman, Gavin Sherlock, Michael Q. Zhang,
Vishwanath R. Iyer, Kirk Anders, Michael B. Eisen, Patrick O. Brown, David Botstein, and Bruce Futcher, “Comprehensive identification of cell cycle-regulated genes of the yeast saccharomyces cerevisiae by microarray hybridization.” Mol. Biol. Cell, Vol.9, pp.3273-3297, 1998.
[4] Juan Liu, Bin Ni, Chao Dai, and Ning Wang, “A simple
method of inferring pairwise gene interactions from microarray time series data.” Proceedings of the Fourth International Conference on Machine Learning and Cybernetics, pp.3346-3351, 2005.
[5] Y. Huang, and P.S. Yu, “Adaptive query processing for time-series data.” Proceedings of the 5th International Conference
on Knowledge Discovery and Data Mining, pp.15-18, 1999. [6] K. Kalpakis, D. Gada, and V. Puttagunta, “Distance measures
for effective clustering of ARIMA time-series.” Proceedings
of the IEEE International Conference on Data Mining, pp.273-280, 2001.
[7] R. Cho, M. Campbell, E. Winzeler, L. Steinmetz, A. Conway, L. Wodicka, T. Wolfsberg, A. Gabrielian, D. Landsman, and D. Lockhart, “A genome-wide transcriptional analysis of the mitotic cell cycle.” Molecular Cell, Vol. 2, pp.65-73, 1998. [8] M.B. Eisen, P.T. Spellman, P.O. Brown, and D. Botstein,
“Cluster analysis and display of genome-wide expression patterns.” Proceedings of the National Academy of Science, Vol. 95, pp.14863-14868, 1998.
[9] M.K. Choong, K.C. Lye, David Levy, and H. Yang,
“Periodicity identification of microarray time series data based on spectral analysis.” Proceedings of the 2006 IEEE International Conference on Systems, Man, and Cybernetics, pp.1281-1285, 2006.
[10] L.K. Yeung, H. Yan, Alan W.C. Liew, L.K. Szeto, Michael Yang, and Richard Kong, “Measuring correlation between microarray time series data using dominant spectral component.” The 2nd Asia-Pacific Bioinformatics Conference
(APBC2004), Vol. 29, pp.309-314, 2004.
[11] M. Vlachos, G. Kollios, and G. Gunopulos, “Discovering similar multidimensional trajectories.” Proceedings of the 18th
International Conference on Data Engineering, pp.673-684, 2002.
[12] M.S. Lee, L.Y. Liu, and M.Y. Chen, “Similarity analysis of time series gene expression using dual-tree wavelet transform.” Proceedings of the 2007 IEEE International Conference on Acoustics, Speech, and Signal Processing (ICASSP 2007), pp.I-413 – I-416, 2007.
[13] S. Kim, S. Imoto, and S. Miyano, “Dynamic Bayesian network and nonparametric regression for nonlinear modeling of gene networks from time series gene expression data.”
Biosystems, Vol. 75, pp.57-65, 2004.
[14] N. Friedman, M. Linial, I. Nachman, and DanaPe’er, “Using Bayesian network to analyze expression data.” Proceedings of the 4th Annual International Conference on Computational
Molecular Biology, pp.601-620, 2000.
[15] The Yeast Cell Cycle website by Spellman et al.
URL: http://genome-www.stanford.edu/cellcycle/, last
accessed on October 1, 2008.
[16] V. Filkov, S. Skiena, and J. Zhi, “Analysis techniques for microarray time-series data.” Proceedings of The Fifth Annual International Conference on Computational Molecular Biology, pp.124-131, 2001.
[17] The Saccharomyces Genome Database (SGD), URL: http://www.yeastgenome.org/, last accessed on October 1, 2008.