Modeling and Simulation of a Free Floating PIG for Different Inclination Angle using CFD
By
MUHAMMAD HAZIM BIN MOHD HALIMI
14843
Dissertation submitted in partial fulfillment of the requirement for the
Bachelor of Engineering (Hons.) (Mechanical)
JANUARY 2015
Universiti Teknologi PETRONAS, 32610 Bandar Seri Iskandar, Perak Darul Ridzuan
CERTIFICATION OF APPROVAL
Modeling and Simulation of a Free Floating PIG for Different Inclination Angle using CFD
by
Muhammad Hazim bin Mohd Halimi 14843
A project dissertation submitted to the Mechanical Engineering Programme
Universiti Teknologi PETRONAS in partial fulfilment of the requirement for the
BACHELOR OF ENGINEERING (Hons) (MECHANICAL ENGINEERING)
Approved by,
___________________
Dr Derej Engida Woldemichael
UNIVERSITI TEKNOLOGI PETRONAS
BANDAR SERI ISKANDAR, PERAK JANUARY 2015
CERTIFICATION OF ORIGINALITY
This is to certify that I am responsible for the work submitted in this project, that the original work is my own except as specified in the references and acknowledgements, and the original work contained herein have not been undertaken or done by unspecified sources or person.
______________________________________ (MUHAMMAD HAZIM BIN MOHD HALIMI)
ACKNOWLEDGEMENT
First and foremost, I would like to express my highest praise and gratitude to Allah SWT for His mercy, permission and guidance to myself, His humble slave throughout the Final Year Project phase by Universiti Teknologi PETRONAS. I would like to express my biggest gratitude to all the people around me that have helped me in every single way they could possibly do. First and foremost, I would like to thank my supervisor, Dr. Dereje Engida Woldemichael, for his persistent determination to guide me, his commitment to support me and also his words of wisdom that give me strength to continue develop this project and hit the goals that we have set to achieved. Same goes to my co-supervisor, Dr. Tamiru Alemu Lemma, for his continuous support to lend myself a helping hand at any time. On top of that, they consistently give constructive comments and allow me to work in my own way to develop the project and ensure it is a success.
It would also not have been possible to execute the project without the support given from Universiti Teknologi PETRONAS and its dedicated staff, especially to Mr. Kamarul, and also faculty members of Mechanical Engineering Department for providing the necessary tools for me to proceed with the development of the project. I would like to express my biggest thank you for giving myself the opportunity to learn and develop my skills in so many ways during my 5 years of study and I would not be who I am today without this opportunity. On the other hand, I would also like to thank the Head of Mechanical Engineering Department, A.P Ir. Dr. Masri bin Baharom and all the lecturers for their guidance, vast knowledge shared and also persistently give their effort to bring the very best out of me and other students.
Last but not least, I would like to express my heartfelt gratefulness to my family who gave me continuous support in every aspect of my life, whether it is mentally, monetary, spirit and so much more. Not to forget my fellow friends, especially to Aiman Tajuddin. They have thought me a lot of knowledge that they acquired and they also played important roles in completing this project, especially for reminding me about the dateline of any parts of the project and also giving advice in improving things. Their willingness and support had made my work easier and less burden.
i Abstract
The oil and gas industry is constantly and rapidly growing with new technologies and method to mitigate problems occurred, whether at downstream or upstream. Pipeline leakage is one of major issue faced by the industry today. Leak can be disastrous if not detected in early stage. One of the most popular method used to detect leakage is Pipeline Inspection Gauge, PIG. One of the biggest challenges in using PIG as leak detection is the movement of the PIG in pipeline. Pipeline configuration can be very complex with bends and also inclination along the way. A conventional PIG might face a problem called “stalled PIG”. To overcome this, a free floating PIG can be used. A free floating PIG is a type of PIG which is spherical in shape and that does not occupy the whole space in the pipe. The main objective of this study is to identify the flow parameters needed by the free floating PIG to be able to travel throughout the pipeline with different inclination angle. To achieve this objectives, Computational Fluid Dynamics approach will be used. ANSYS Fluent is used as the main method to study the parameters of PIG flow. The fluid flow model will be created using the k-epsilon model and all the calculation and iteration will be calculated using second order upwind. The key inputs will be the fluid type, diameter, mass and density of the free floating PIG, and the inlet velocity. Thus, for each inclination angle, the key outputs which are the minimum fluid velocity to propel the free floating PIG, fluid pressure, trajectory of PIG and also the velocity of PIG have been identified. The results is discussed as to understand how the free floating PIG behave in the pipeline and what is the minimum velocity needed to propel the free floating PIG through the inclination angle. To verify the simulation result, a flow loop is required. The layout of the flow loop have been designed and must be constructed. Due to limitation of time and resource, the flow loop construction cannot be done within the period of this project. Another limitation on this project is the flow assurance matters. ANSYS Fluent does not have such features to take into account the matters in the simulation. For the future work of this project, the flow loop must be constructed and experimented to further justify the results gained from the simulation.
ii Table of Contents 1.0 Introduction ... 1 1.1 Background. ... 1 1.2 Problem statement ... 1 1.3 Objectives ... 2 1.4 Scope of Study ... 2 1.5 Outline of Dissertation ... 3 2.0 Literature Review ... 4
2.1 PIG and the history of pigging ... 4
2.2 Usage and importance of pigging ... 5
2.3 Simulation of PIG ... 6
2.4 Fundamentals of CFD model for fully-developed flow in a pipe ... 8
2.5 Flow assurance issues: Wax deposition ... 10
2.6 Free floating PIG ... 11
2.7 Overview of SmartBall ... 11
2.8 Modes of deployment and retrieval ... 12
2.9 Tracking the SmartBall ... 13
2.10 Data interpretation of SmartBall ... 15
2.11 SmartBall specification ... 16
2.11 Stuck PIG incident ... 17
3.0 Methodology ... 19
3.1 Project methodology ... 19
3.2 Simulation Methodology ... 21
3.3 Gantt chart ... 25
4.0 Results and Discussion ... 27
4.1 Modelling fluid in ANSYS Fluent ... 27
4.1.1 Geometries of model ... 27
4.1.2 Meshing ... 27
4.2 Setup for model ... 29
4.2.1 Fluid materials ... 29
iii
4.3 Forces acting upon the free floating PIG ... 30
4.4 Simulation results ... 31
4.4.1 Oil velocity ... 31
4.4.2 Oil pressure ... 32
4.4.3 Oil velocity to propel free floating PIG through inclination plane ... 33
4.5 Piping layout for flow loop ... 41
4.5.1 Design ... 42
5.0 Conclusion and Recommendation ... 43
5.1 Conclusion ... 43 5.2 Limitations ... 43 5.3 Recommendation ... 44 References ... 45 Appendices ... 48 Appendix I ... 48 Appendix II ... 51 Appendix III ... 54 Appendix IV ... 57
iv Table of Figures
Figure 2.1: Pipeline failure causes [5]. ... 5
Figure 2.2: Geometry of fully-developed flow in a pipe [12] ... 8
Figure 2.3: Dissection of a SmartBall [14]. ... 12
Figure 2.4: SmartBall tool with foam overshell [15]. ... 13
Figure 2.5: SmartBall coated with polyurethane [15]. ... 13
Figure 2.6: Accelerometer signal [15] ... 14
Figure 2.7: SBR and Acoustic Sensor adhered to pipeline [15] ... 15
Figure 2.8: Leak detected in Analysis Software [15] ... 16
Figure 3.1: Project flow chart ... 21
Figure 3.5: Pipe geometry with 45° inclination angle ... 22
Figure 3.9: Simulation process ... 24
Figure 4.1: Aspect ratio for 15° pipe geometry ... 28
Figure 4.2: Element quality for 15° pipe geometry ... 28
Figure 4.3: Forces acting on free floating PIG ... 30
Figure 4.6: Oil velocity contour for 30° pipe geometry ... 32
Figure 4.13: Oil pressure contour for 30° pipe geometry ... 33
Figure 4.18: Free Floating PIG velocity contour for 0° pipe geometry ... 34
Figure 4.19: Free Floating PIG velocity contour for 15° pipe geometry ... 35
Figure 4.20: Free Floating PIG velocity contour for 30° pipe geometry ... 36
Figure 4.21: Free Floating PIG velocity contour for 45° pipe geometry ... 37
Figure 4.22: Free Floating PIG velocity contour for 60° pipe geometry ... 38
Figure 4.23: Free Floating PIG velocity contour for 75° pipe geometry ... 39
Figure 4.24: Free Floating PIG velocity contour for 90° pipe geometry ... 40
Figure 4.25: ISO View of Experimental Layout ... 42
Figure 3.2: Pipe geometry with 0° inclination angle ... 48
Figure 3.3: Pipe geometry with 15° inclination angle ... 48
Figure 3.4: Pipe geometry with 30° inclination angle ... 49
Figure 3.6: Pipe geometry with 60° inclination angle ... 49
Figure 3.7: Pipe geometry with 75° inclination angle ... 50
Figure 3.8: Pipe geometry with 90° inclination angle ... 50
Figure 4.4: Oil velocity contour for 0° pipe geometry ... 51
Figure 4.5: Oil velocity contour for 15° pipe geometry ... 51
Figure 4.7: Oil velocity contour for 45° pipe geometry ... 52
Figure 4.8: Oil velocity contour for 60° pipe geometry ... 52
Figure 4.9: Oil velocity contour for 75° pipe geometry ... 53
Figure 4.10: Oil velocity contour for 90° pipe geometry ... 53
Figure 4.11: Oil pressure contour for 0° pipe geometry ... 54
Figure 4.12: Oil pressure contour for 15° pipe geometry ... 54
v
Figure 4.15: Oil pressure contour for 60° pipe geometry ... 55
Figure 4.16: Oil pressure contour for 75° pipe geometry ... 56
Figure 4.17: Oil pressure contour for 90° pipe geometry ... 56
Figure 4.26: Top View of Experimental Layout ... 57
Figure 4.27: Front View of Experimental Layout ... 57
vi List of Tables
Table 1: Pipeline parameters [9]. ... 7
Table 2: Tool characteristics [16] ... 16
Table 3: Operating environment [16] ... 17
Table 4: Detection capabilities [16] ... 17
Table 5: Mesh statistics ... 29
Table 6: Summary of Results ... 41
1
CHAPTER 1
1.0 Introduction 1.1 Background.
Leak in pipelines are serious matter and should not be treated as minors. A single leak in a pipeline can contaminate large area within a day. Taking a tragedy on July 2011, the article provided by Reuters, Exxon Mobil’s Silvertip pipeline leaked 1500 barrels of crude into the Yellowstone River on a single event [1]. According to a solution provider company, KHRONE, a leak of 1% in a 20 inch line can cost 450000 barrels and contaminate 10 square meters within 24 hours [2]. Due to these two facts, it is important to put extra attention on pipeline leakage problem.
Pipeline Inspection Gauge, PIG is a device that has been widely used in the oil and gas industry nowadays. This device is use mainly to assist several aspects regarding on pipeline. Free floating PIG is a type of free floating device that is spherical in shaped and does not occupy all the spaces of diameter of the pipeline and the movement is highly dependent on many aspects such as pressure, inclination angle, temperature and type of fluid.
Therefore, a thorough study needed to be conducted on the importance parameters for the PIG to enable it to travel and this is where simulation comes in hand. The method that is adopted is the Computational Fluid Dynamics (CFD) program by using ANSYS Fluent software to study the flow of the PIG with different inclination angle of pipeline.
1.2 Problem statement
The movement of the free floating PIG in the pipeline can be very challenging. One of the reasons is because pipeline designs and configuration is highly complex. Pipelines will have changes of inclination angle and the variation of the angle flow will lead to changes is many parameters, especially the pressure and velocity. This will limit the free floating PIG to propel through the inclination. Similar problems are being encountered, other than varying degree, are pipeline size, location and also type of crude product being transport in the pipeline. Failure in determining the parameters will create “stalled” PIG
2
[3], which is a problem normally faced by a conventional PIG that occupied the whole space in the pipe.
Since leak is a persistent issue, thorough research needed to be done on free floating PIG, in this case the movement of free floating PIG on variation of inclination angle. One of the challenges faced in this project is to determine the exact parameters and also simulating to the nearest actual situation as possible.
1.3 Objectives
The objectives of this project were:
To determine the minimum velocity to ensure the free floating PIG will be able to travel through the variations of inclination angle.
To simulate the movement of the free floating PIG with the parameters identified by using ANSYS Fluent software in the pipeline.
To design the layout of the flow loop and construct the layout to experiment the free floating PIG in pipeline.
1.4 Scope of Study
The main scope for this project was the minimum velocity needed to propel the free floating PIG through the various inclination angle along a pipeline. In order to achieve it, the project focused on:
Necessary parameters that will affect the flow and movement of the PIG along the pipeline.
A simulation that can convey the movement of the free floating PIG along the pipeline and determined the minimum velocity to propel the free floating PIG through the variation of inclination angle.
Layout design and construction of a laboratory scale experiment based on the simulation done.
3 1.5 Outline of Dissertation
In this dissertation, Chapter 2 talked about the literature studies that have taken place in this project. In Chapter 3, further discussion on the methodology used in achieving the objectives. From the methodology, Chapter 4 focused on the results and discussions involved. Chapter 5 is the conclusions, limitations and recommendations made from the output of the entire project.
4
CHAPTER 2
2.0 Literature Review
The main study for this proposal is about modeling and simulating a free floating PIG for different inclination angle using CFD. It is very motivating to be in the dynamic team to study about the mentioned subject as the whole team is focusing on the system for pipeline leak detection. The team consists of two major parts which is experimenting on the mechanism for leak detection and also the movement of the PIG in the pipeline. Thorough study needs to be done in order to gain more knowledge on the PIG flow to make the team a success both theoretically and practically.
In this section, there are several literatures from all sorts of materials to assist in developing the study and to gain a precise result in order to achieve the goal and objectives set before.
2.1 PIG and the history of pigging
PIGs are devices that are inserted into, and travel throughout a pipeline, driven by a product flow. Normally, PIGs fall into two categories namely ‘utility PIGs, which performs functions such as cleaning, separating or dewatering the pipeline, and in-line inspection. The other category is ‘ILI tools’ or some might call it ‘intelligent PIGs’ or ‘smart PIGs’, which performs functions such as providing the information on the condition of the pipeline as well as the extend and also the location of the problems. The history about pigging is still lacking of full truth, but many reference come out with a conclusion that the first pigging operation took place around the year of 1870, a few years after Colonel Drake discovered oil in Titusville, Pennsylvania. Another story regarding the history of pigging was dated back in 1940 when a 4 inch steel gas line was installed in Montana. PIG got its name when a pipeline cleaner at that time heard the “pig squeal” noise [4].
At that time, the functions of PIGs are very limited to cleaning. Nowadays, the demands of intelligent pigging are very high since this is one of the best alternatives to perform
5
various operations in the pipeline. Engineers are doing many researches to enhance the functions of PIGs.
As the technology of pigging grows, it has evolved from measuring and record information used to assist pipeline integrity and also the defects to a more sophisticated technology. Some of the examples are corrosion, weld defects and cracks detection, location verification, commissioning and also leak detection.
2.2 Usage and importance of pigging
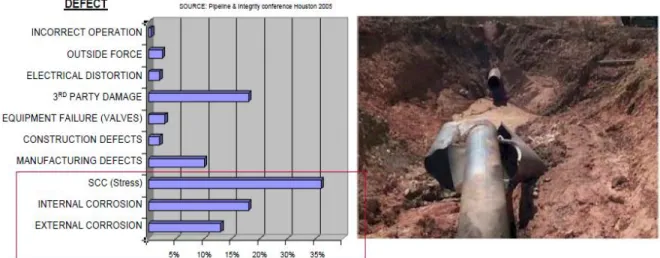
Since pigging can perform many functions on pipeline, it is vital for us to know the importance of pigging. Time, deterioration and corrosion of any ageing pipeline infrastructure will significantly increase the probability of pipeline failures, according to industry trends. A data was presented at the Pipeline and Integrity Conference in Houston, USA in 2005 regarding this topic. It was said to be 65% of all pipeline failures are caused by corrosion. The consequences include environmental impact, worker and public safety issues, clean-up cost, unscheduled downtime due to repairs and maintenance cost [5]. Figure 2.1 below shows the pipeline failure causes.
Figure 2.1: Pipeline failure causes [5] .
Since it is important to keep the pipeline clean, the PIGs can also act as cleaning device to clean up the pipeline to avoid further damage such as corrosion and leakage. In oil pipelines, they are used to manage the build-up of deposits such as wax. On the other hand, in gas pipelines, they are used to control liquid inventories [6]. The operation will
6
take place depending on severity of the application. It can vary from hours, weekly or monthly.
Some of the known capabilities are position fixing, component identification, pipeline mapping, dent detection, wax detection, condition assessment and trend monitoring. It can benefit the company in many ways. Furthermore, based on [7], Pigging helps keep the pipeline free of liquid, reduce the overall pressure drop and increase the pipeline flow efficiency.
In practice, PIG velocity is dictated by pipeline flowrates and the process condition, making the operator have little control on this. According to [18] also, the drop in PIG velocity can cause several problems such as:
Sub-optimal removal of free water and debris Increased risk of “stalled PIG”
Significant increase in PIG run time Increased in potential of “mis-launch” Increased difficulty in PIG receipt
Therefore, it is critical to design the operation of the PIG in the pipeline carefully to prevent the above matters. One more factor often overlooked is the calculation of “PIG bypass”. This PIG Bypass is one of the most important factor to be consider with regard to velocity of the PIG and maintaining the optimal differential pressure across the PIG. Pipelines need to be design with a number of bypass so that the operator have the facility to alter the PIG configuration thus affecting the PIG velocity significantly. 2.3 Simulation of PIG
In order to be able to detect leak, the PIG must be able to move from one point to another. Unfortunately, pipelines are complex configuration and it involves a lot of obstacles such as different in inclination angle. In this situation, simulation of PIGs played vital role in order to know the correct parameters of flow so that the PIG can travel from the launcher to the receiver.
7
Pigging simulation study has already been carried out from the 1950s [8]. By this time, a more complex study on simulation has been made to improve PIG technology. There are many reasons why simulation of PIG is very important. One of it would be the implication of improper pigging operation can seriously affect the normal operation. Therefore, detailed pigging simulation is very important. Because of the complication of flow mechanics of pigging operation, no standards or codes are available for pigging operation parameters selection [9]. Below is a sample of table of pipeline parameters.
Table 1: Pipeline parameters [9].
Parameter Unit 22-in Pipeline
Total Pipeline Length km 79
Riser Height M 45
Nominal Diameter in 22
Wall Thickness in 1.0
Internal Wall Roughness in 0.0018
According to [10], in regards with the flow direction, pipelines can be roughly classified into two types: unidirectional (non-reversible) and bidirectional (reversible) lines. Non-reversible pipelines are the commonly used in the oil supply chain. Lots of crude oil is transported from oil fields to refineries, while refined product batches flow from refineries to distribution centers near dense population area. Sometimes, however, refined products pipelines are used to exchange products between refineries, distribution centers or harbors in both directions. In those cases, the construction of a pair of unidirectional lines working in opposite directions is economically unjustified due to the high investment cost, and reversible pipelines appear as a less expensive alternative.
CFD simulation can also give many advantages. First of all, there is no physical experiment needed in order to justify the parameters that were tested for the PIG movement in the pipeline. Also, numerical simulation can provide detailed information on the hydrodynamic of oil flow, which is not easily obtained by physical experiments [11].
8
2.4 Fundamentals of CFD model for fully-developed flow in a pipe
To understand the propulsion created from the fully-developed flow by the fluid in a pipe, the fundamental principle must be understood first. According to [12], the governing equation for fully-developed flow in a pipe is:
𝜇 𝑟 𝑑 𝑑𝑟(𝑟 𝑑𝑢 𝑑𝑟) − 𝑑𝑝 𝑑𝑥= 0 (Equation 2.1)
Where u is the velocity components along the pipe axis in x direction, 𝜇 is the dynamic viscosity and 𝑝 is the pressure.
For the boundary condition, the equation is:
𝑑𝑢
𝑑𝑟|𝑟=0= 0 (𝑠𝑦𝑚𝑚𝑒𝑡𝑟𝑦) (Equation 2.2)
𝑢(𝑅) = 0 (𝑛𝑜 𝑠𝑙𝑖𝑝) (Equation 2.3)
Figure 2.2 shows a simple geometry of a round pipe with radius R.
Figure 2.2: Geometry of fully-developed flow in a pipe [12] Equation 2.1 is subjected to the boundary condition which is:
9 𝑢(𝑟) = 𝑅2 4𝜇(− 𝜕𝑝 𝜕𝑥) [1 − ( 𝑟 𝑅) 2 ] (Equation 2.4)
From Figure 2.2 also, the maximum velocity in the pipe is located at its centerline. The preceding formula for 𝑟 = 0 is evaluated and gives:
𝜇𝑚𝑎𝑥 =
𝑅2 4𝜇(−
𝜕𝑝
𝜕𝑥) (Equation 2.5)
When the flow is moving in positive x direction, 𝜕𝑝
𝜕𝑥 < 0. To gain a more compact
expression for the velocity profile, Equation 2.4 and Equation 2.5 is combined giving:
𝜇(𝑟) = 𝜇𝑚𝑎𝑥[1 − (
𝑟 𝑅)
2
] (Equation 2.6)
Therefore, the average velocity in the pipe is
𝜇𝑎𝑣𝑒 = 1 𝐴∫ 𝑢 𝑑𝐴𝐴 = 1 𝜋𝑅2∫ 𝑢 2𝜋 𝑟 𝑑𝑟 𝑅 0 (Equation 2.7) =𝑢𝑚𝑎𝑥 𝑅2 ∫ [1 − ( 𝑟 𝑅) 2 ] 𝑟 𝑑𝑟 𝑅 0 = 𝑢𝑚𝑎𝑥 2 (Equation 2.8)
The shear stress at the wall is given as:
𝜏𝑤 = 𝜇 |(
𝑑𝑢
𝑑𝑟)𝑟=𝑅| (Equation 2.9)
For equation 2.9, it is necessary to put the absolute sign since 𝑑𝑢
𝑑𝑟 is negative at wall. Using
Equation 2.6 and Equation 2.9 gives:
𝜏𝑤 = 𝜇 |− (
2𝑢𝑚𝑎𝑥
𝑅 )𝑟=𝑅| = 4𝜇𝑢𝑎𝑣𝑒
𝑅 (Equation 2.10)
By using the definition of Darcy Friction factor which is:
𝑓 = 8𝜏𝑤
𝜌𝑢𝑎𝑣𝑒2 (Equation 2.11)
Equation 2.10 is substituted in Equation 2.11 which gives:
𝑓𝑝𝑖𝑝𝑒= 32𝜇 𝜌𝑢𝑎𝑣𝑒𝑅 = 64 𝑅𝑒 (Equation 2.12) 𝑅𝑒 =𝜌𝑢𝑎𝑣𝑒𝐷 𝜇 (Equation 2.13)
10 Where Equation 2.13 is the Reynolds number.
The calculation involved are the fundamentals affects that acting on the fluid that is fully-developed flow in a pipe. Forces such as velocity, shear stress and also friction played a role in determining the flow of the fluid in a pipe. Boundary wall is the where the minimum velocity occurred.
2.5 Flow assurance issues: Wax deposition
One of the main issues that will affect the fluid flow and the movement of the free floating PIG is flow assurance related issues. A journal from [19] have an experimental results on wax deposition study from the establishment of an experiment loop. It is a method to determine the thickness of the wax deposition. The experiment take into account the impact of immediate decrement of temperature at the wall section which eventually leads to two problems which are increasing of the viscosity of the crude oil near the pipe wall and the distortion of the flow field in the pipe.
As time goes by, the wax deposition of the crude oil will eventually makes the flow area smaller and smaller. This will influence the transportation capacity within the pipeline. There are two main roles of the wax sedimentary layer during transportation. First, the wax sedimentary later will cause the thermal resistant to be higher, thus decreases the heat loss of the crude in the pipeline when flowing. Second, the wax sedimentary layer will make the flow area smaller as time goes by, thus increases the flow resistance that will cause the transportation pressure to increase. Sometimes, the wax sedimentary layer can become too think that will eventually lead to “paraffin blockage” during conventional pigging. This can also affect the flow of the free floating PIG if the wax sedimentary layer is too thick.
From journal [20], the removal of deposited wax is required to solve the problem regarding the reduction in flow rate within the pipeline. Once the crude oil within the pipeline is below the Wax Appearance Temperature (WAT), it can lead to gelling and inhibits the flow by causing significant non-Newtonian behavior and increase the effective viscosities as the temperature of a waxy crude oil approaches its Pour Point [21].
11 2.6 Free floating PIG
From a published manuscript by [13], a free floater is considered as the latest technology used in leak detection for water and oil pipeline as it can maneuver through an unpiggable pipeline. A pipeline is considered as unpiggable for number of reasons. Some of the reasons are diameter changes, small radius bends, product type, tees joints and branch line. Each of the limitation present a unique challenges for inspection process.
Free floaters is a device that primarily detects leaks and appurtenance. The mechanism of tracking is within the pipeline. It basically using external receivers and an internal tri-axial accelerometer.
The free floater is bidirectional which allow the product in the pipeline or other media to propel forward to the receiver or backward and return to its launch area. A better understanding can be achieve in understanding the single or multiphase threats that can help to assess the integrity of the pipeline system.
2.7 Overview of SmartBall
SmartBall is a type of free floating PIG and a type of inline inspection technology based on acoustics. Pressurised pipelines with leaks will produce a distinct anomalous acoustic that can be detected by SmartBall [14]. During the journey of the SmartBall along the pipelines, it will record the acoustic activities that can be analyzed once the SmartBall is retrieved.
SmartBall usually consist of two main parts, which are first, the aluminum alloy core that contained a power supply, electronic components and instrumentations such as an acoustic sensor, tri-axial accelerometer, tri-axial magnetometer, GPS synchronized ultrasonic transmitter and temperature and pressure sensor. Another main part of SmartBall is the outer shell that act as the protective cover for the components and it is usually made out of polyurethane. The outer shell also will act as noise reducing agent that the movement of the SmartBall produce. It can also help in the movement of the SmartBall in the pipeline.
SmartBall is designed to be smaller than the diameter of the pipeline it travels because this free floater PIG depend highly on the propulsion and the fluid flow in the pipeline,
12
unlike any other normal PIGs that sometimes have their own driving force [14]. Figure 2.3 shows the cross sectional of a free floating PIG.
Figure 2.3: Dissection of a SmartBall [14] . 2.8 Modes of deployment and retrieval
Typically, for a pipeline with diameter of 16 inch or larger, the method used to deploy is by using the PIG launcher. The protective outer foam shell encapsulate the aluminum core thus creating a larger surface area for product flow to make contact and to enable the device to propel throughout the pipeline. For pipelines ranging from 4 inch to 14 inch in diameter, the method used to deploy is by using the receive fittings. The aluminum core is encapsulated in polyurethane coating. The polyurethane coating and outer foam shell are both act as an assistance to reduce low frequency ambient noise that is typically present in the pipeline. Figure 2.4 and Figure 2.5 shows the SmartBall coated with foam and polyurethane.
After the SmartBall have been deployed into the pipeline, it will be then captured at downstream. The location of the SmartBall is tracked at known bench marked location during inspection along the pipeline. This is to correlate the inspection data with position along the pipeline.
13
Figure 2.4: SmartBall tool with foam overshell [ 15] .
Figure 2.5: SmartBall coated with polyurethane [ 15] . 2.9 Tracking the SmartBall
This is one of the most critical aspect of the SmartBall. Important acoustic anomalies such as leaks can be located by tracking the position of the SmartBall. The rotation of the SmartBall is recorded by the on-board accelerometer, which is used to determine the angular velocity of the SmartBall. As the device travel through the entire pipeline, the angular velocity is then used to determine the velocity profile of the device. Figure 2.6 below shows the accelerometer signal showing the rotation of SmartBall.
14
Figure 2.6: Accelerometer signal [15]
The data can give a precise location of any recorded anomaly as it is aligned with the acoustic recordings. Establishing the reference point can significantly improve the precision of leak detection. The reference point mentioned is in a form of markers that are installed along the pipelines. Below is the 2 devices that are commonly used as markers:
SmartBall Receivers (SBRs):
This device is placed at number of places along the pipeline. It main function is to detect ultrasonic pulses emitted from SmartBall. The SBR calculated the approximate location of the ball by measuring the time it takes for the pulse to travel from SmartBall to SBR. As SmartBall passes SBR, a discrete point will be provided where, at the moment, the location of the ball is known. This correlated to the acoustic data and used in locating the leaks. Figure 2.7 shows SBR and acoustic sensor being adhered to a pipeline.
15
Figure 2.7: SBR and Acoustic Sensor adhered to pipeline [ 15] Above Ground Markers (AGM):
Any commercially 22Hz benchmarking device can be used as a tool to inspect. Directly above the pipeline lays the AGM so that the Global Positioning System (GPS) of the SmartBall will measure the 22Hz signal emitted by the SmartBall that can able it to log the passage time. AGM provide a checkpoints to be used in the data analysis and also help in locating leaks or other anomalous signals.
2.10 Data interpretation of SmartBall
An acoustic signal will be produced by a leak in a pressurized pipeline as the pressurized product contained in the pipeline escaped into the lower pressure atmosphere outside the pipeline [14]. SmartBall will continuously record the acoustic data as it transverse throughout the pipeline. The data will then be analyzed after tool extraction to enable any leak associated activity to be identified along the pipeline.
In the leak analysis software, the acoustic signal will be at the very peak when the SmartBall passes the original point of leak. It will then be gradually reduce once the SmartBall continues to travel away from the leak. A typical acoustic signature resulting from a leak is shown in Figure 2.8.
16
Figure 2.8: Leak detected in Analysis Software [ 15] 2.11 SmartBall specification
In order to simulate the real life situation of the flow, the SmartBall sizing and specification from Pure Technologies SmartBall catalogue is adopted. The specifications are as below:
Table 2: Tool characteristics [16] SmartBall® Diameter 4” 6” 8” 10” 12” Outer Diameter of Tool 3.15” (80 mm) 5.3” (135 mm) 7.125” (180 mm) 8.75” (220 mm) 10.75” (275 mm) Suitable pipe diameter 4” (100 mm) 6” (150 mm) 8” (200 mm) 10” (>250 mm) 12” (>300mm)
Power Source Lithium
primary Lithium rechargeable
Maximum Run
Time 29.5 hours 55 hours 115 hours 115 hours 400 hours
Memory
17
To suits the needs of the competitive market out there, SmartBall can operate in many conditions. The operating environment pressure can reach up to maximum of 138 bar and the range in temperature is high. Other than that, SmartBall can also operates in various pipeline product such as crude oil, synthetic crude, refined products, natural gas and many more. Below is the table showing the operating environment of the SmartBall.
Table 3: Operating environment [16]
Maximum Pressure 138 bar (2000 PSI)
Temperature Range -10 C to 70 C
Pipeline Product Crude Oil, Synthetic Crude, Refined Products, Natural Gas, NGL’s and DilBit
In order for SmartBall to detect leak efficiently, it will need a high level of detail to perform even on a small leak. The battery lifespan must also be large to withstand the long pipeline throughout the inspection. Below is the detail capabilities of the SmartBall.
Table 4: Detection capabilities [16]
Level of Detail Locates leaks as small as 0.016 GPM (0.06
LPM)
Duration Can be deploy up to 400 hours
2.11 Stuck PIG incident
A various number of lessons can be taken from the tragedy of stuck PIG in the BP deepwater Gulf of Mexico Marlin Tension Leg Platform (TLP) oil export pipeline on June 11, 2004. The fact that a shutdown must be perform to retrieve a stuck PIG can give a negative impact and also a huge lost to the company. The PIG was said to be stuck 9 miles from Marlin TLP in 1200 fleet of water depth and from the report, the PIG was successfully retrieved 10 days later [17].
18
There are various factors contributing to the stuck PIG event. From the technical paper [17], it was stated that the heat was lost to surrounding seawater. This causes the fluid temperature to drop below its WAT. The pipe wall has the lowest temperature along the pipeline, thus making the heavy molecular weight paraffinic hydrocarbons to begun solidifying and deposited on the pipe wall. Over time, it gives an exponential pressure drop due to reduction in the flow diameter and this also will increase the roughness of the pipe. It will also cause the increment of backpressure and low flow rate.
There are many lessons that can be learnt from this particular event. From the paper [17], it is stated that even though there was active communication amongst the team, there was no Management of Change (MOC) written after the suspending pigging operation was decided to delay before shut down. On top of that, an alternative strategy or protocol should have been ready for such case as PIGs could not run for any reason. The team should also come out with a better design of PIG launcher and receiver valve since it is one of the critical components to the operability of an offshore facility and usually required a complete platform shutdown in order to replace the valve.
To summarize, the findings from the literature studies such as the fundamental of fully developed flow in a pipe, wax deposits in flow assurance matter, free floating PIG and also the all about the SmartBall gives a rough understanding to pursue the objectives. This also allows the project to proceed to the methodology in Chapter 3 and then helped in the results and discussions in Chapter 4.
19
CHAPTER 3
3.0 Methodology
A sequence of methodology have been set to achieve the objective of this project. The methodology compromises of two parts which are the project methodology as a whole and the methodology of the simulation.
3.1 Project methodology
The following are the methodology constructed. 1. Identifying the problems.
a. In order to initiate the research, the problems need to be identified. Identifying the right problem will direct the research to a more accurate target rather than going blindly. For this paper, there are some problems identified. The main concern of this research is on the movement of the free floating PIG in a pipeline with different inclination angle. This can enhance the pipeline leak detection work and avoid stalled PIG in the middle of the pipeline.
2. Identifying the objectives and scope of study.
a. A specific objectives need to be underlined that will link to the problem stated so that a proper goal can be achieved. Also, the scope of study needs to be set in order to specify the research.
b. In this case, a sets of objectives and scope of study for this project is identified. One of the objectives would be identifying the parameters that will affect the movement of the PIG in the pipeline with different inclination angle. The study would be focused on the PIG and also the pipeline.
3. Gathering information
a. Once the objectives have been set, the information must be gathered as much as possible before undergoing the simulation. The source of research would mostly be from material related to the field such as articles,
20
journals, research papers, conference papers and books. This can ensure that this project will portrait as much knowledge as possible.
b. For the parameters related to the flow, the studies will be consulted by engineers from the industry. The information and data are gained from the real life situation pipeline.
4. Designing and simulating the movement of PIG
a. From the previous data obtained, the parameters need to be ensured as genuine and the PIG will be able to move in different inclination angle of pipeline. This can be seen from the simulation of the PIG using CFD program, specifically ANSYS Fluent.
5. Interpreting data
a. Once the simulation is done, the data gained will be interpreted. This is important to determine the output of the simulation.
6. Design layout for laboratory scale experiment and construct experiment on the movement of PIG with different inclination angle
a. The data gained from the simulation will be used for the experiment. A layout will be designed and also constructed. A pipeline will be replicated and also the parameters of the PIG will be set to enable the experiment on the movement of the PIG to be done, theoretically and actually.
7. Conclusion and Recommendations
a. Based on the output of the simulation and also the experiment, a conclusion will be produced to conclude the research done on the movement of free floating PIG in a pipeline with different inclination angle. The decision will be made whether the output has met the objectives of this study.
21
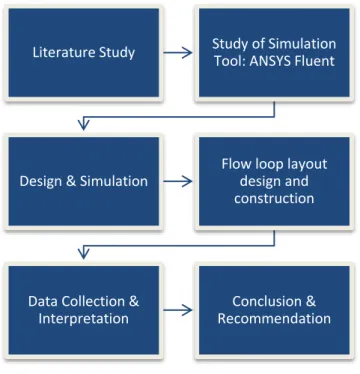
Figure 3.1: Project flow chart
3.2 Simulation Methodology
The simulation tool that have been chosen to use in this project is ANSYS Fluent. In this section, the steps to simulate the flow of the fluid in the system will be explained. One of the main objective is to know the minimum velocity needed to propel the free floating PIG through the inclination angle and also the trajectory of the fluid and free floating PIG. The fluid used would be oil flowing along the pipeline. The flow in this simulation is expected to be fully developed and Lagrangian reference frame is used to analyze the model.
Step 1: Modeling geometries
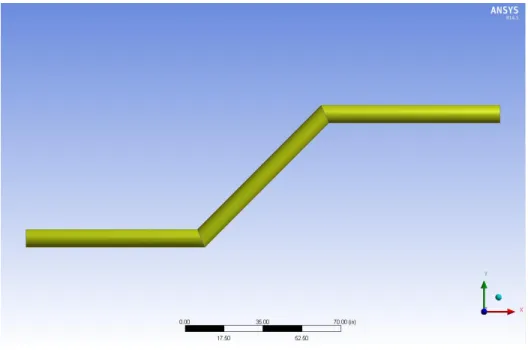
There are 7 inclination angles chosen which are 0°, 15°, 30°, 45°, 60°, 75°, and 90°. The pipe diameter is set to be 4 inch and the length of the pipe is 1 meter at each section of the pipe. The model of geometry for 45° angle is shown in Figure 3.5. Refer Appendix I for figures of other angles.
Literature Study Study of Simulation Tool: ANSYS Fluent
Design & Simulation
Flow loop layout design and construction
Data Collection & Interpretation
Conclusion & Recommendation
22
Figure 3.5: Pipe geometry with 45° inclination angle
Step 2: Meshing the geometry
Meshing is one of the most important aspect of the simulation as it will determent the accuracy of the simulation. The more numbers of cell created on the geometry, the more accurate it will be. Nonetheless, it will take a longer time to get the simulation done if the meshing is very fine and high quality.
For the setup of meshing, the option chosen is to turn on the Advance Size Function to Proximity and Curvature as all of the geometries used in the geometry that have a curvature and a degree of inclination. This will mean that at the curve, the meshing will be more accurate and creating the cells with angles.
For the method of meshing, the option chosen is to use Cut Cell method to increase the percentage of accuracy by creating hexahedral cells. The inflation zone is also added that will create a better meshing at fluid with are near the pipe wall.
In order to know the accuracy and the quality of the meshing, two main criteria that need to take into account is the Aspect Ratio and also the Element quality. These two aspects will be explain further at Chapter 4 of this report.
23 Step 3: Setup of the parameters and solution
After the meshing has been done, the parameters need to be inserted. The gravity is set to be -9.81 m/s as it is the most important aspect of the simulation. The fluid will now be affected by the gravity. The density of oil is chosen in the oil database contained in Fluent where the oil have a density of 830 kg/m3 and has a constant viscosity of 0.00332 kg/ms. The method used to solve the problem of free floating PIG propelling through an inclination angle will be discussed further in chapter 4.
The main thing that have been manipulated in this simulation is the initial velocity of the oil at the inlet. The simulation will start from 0.5 m/s for the initial velocity and if the free floating PIG was unable to propel through the inclination, the setup for the fluid velocity will be increased with an increment of 0.1 m/s. The steps will be repeated until the ideal initial velocity have been achieved.
Step 4: Results of simulation
The four main output from the fluid simulation are the minimum fluid velocity to propel the free floating PIG, fluid pressure, trajectory of PIG and also the velocity of PIG. From these key output, the objective of this project was achieved.
24
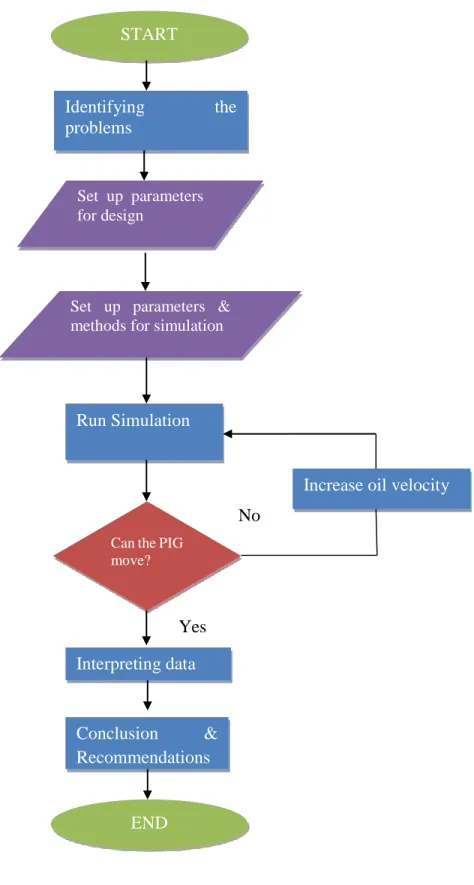
Figure 3.9: Simulation process START Identifying the problems Set up parameters for design Run Simulation
Can the PIG move?
Increase oil velocity
Interpreting data Conclusion & Recommendations END Yes No Set up parameters & methods for simulation
25 3.3 Gantt chart
Project timeline (FYP 1: Sept 2014 – Jan 2015)
NO TASK WEEK
1 2 3 4 5 6 7 8 9 10 11 12 13 14
1.0 Project study
1.1 FYP title selection 1.2 Introduction 1.3 Methodology 1.4 Research work
1.5 Submission of extended proposal *
2.0 Project preliminary
2.1 Confirmation of tools and parameters 2.2 Study on modeling and simulation software (ANSYS)
2.3 Background study on inclination angle effects on PIG
2.4 Identify parameters to achieve objectives *
3.0 Project execution
3.1 Design the PIG and the pipeline *
3.2 Run simulation *
4.0 Project analysis
4.1 Data collection from simulation
26 Progress Milestone *
Project timeline (FYP 2: Jan 2015 – May 2015)
NO TASK WEEK
1 2 3 4 5 6 7 8 9 10 11 12 13 14
5.0 Project experiment
5.1 Flow loop layout design *
5.2 Bill of material and assembly drawings
*
5.3 Vendor dealing *
6.0 Project finalization
6.1 Conclusion and recommendation *
27
CHAPTER 4
4.0 Results and Discussion
4.1 Modelling fluid in ANSYS Fluent 4.1.1 Geometries of model
In order to determine whether the free floating PIG can travel from one end to another, the project used 7 different inclination angles which are 0°, 15°, 30°, 45°, 60°, 75° and 90° of the 4 inch diameter pipe. The values chosen is because the path of the pipeline will be complicated and it is important to know at which velocity the free floating PIG should travel in order to pass through the inclination angles mentioned.
4.1.2 Meshing
Meshing will determine the accuracy of the simulation. The smaller the cell, the more number of cell will be produce on the geometry thus creating a more detailed simulation. Two key factors that need to be considered during meshing are:
1. Aspect ratio 2. Element quality
Aspect ratio:
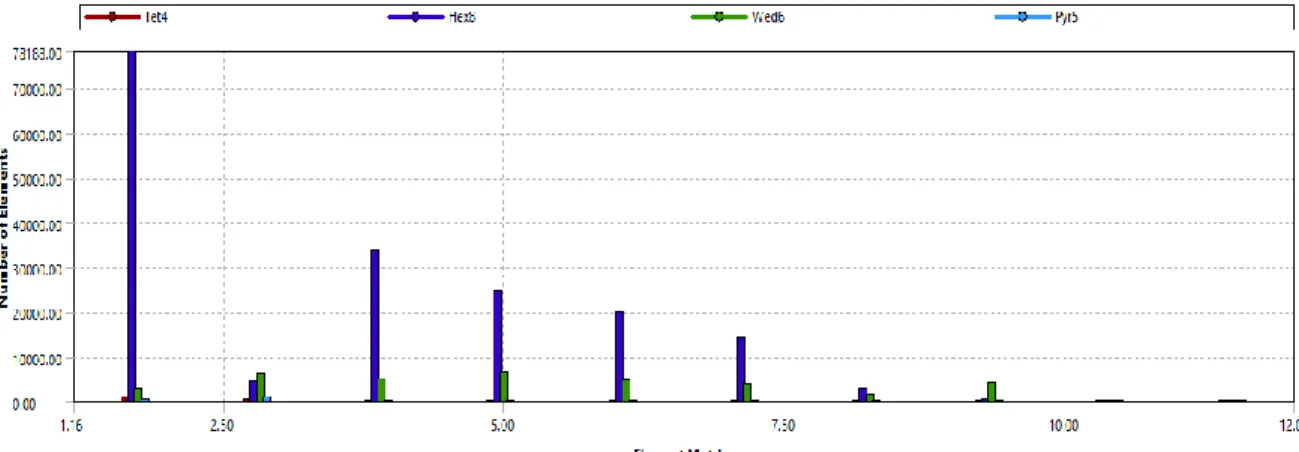
Defined as the ratio between the longest dimensions to the shortest dimension of the quadrilateral element in the mesh. It can be a form of judgment on the quality of the mesh whether the mesh contained many errors or not. If the value of the aspect ratio is big, the simulation is said to be less accurate. Based on Figure 4.1, most of the aspect ratios gained for 15° geometry are in between 1.16 and 2.5. This shows that the simulation done is within the acceptable range of accuracy. It must be kept less than 5 [22]. This also applied to all of the geometry.
28
Figure 4.1: Aspect ratio for 15° pipe geometry
Element quality:
Element quality can also be a form of judgment on the quality of mesh. Element quality basically determine the quality of the mesh. A high percentage of element quality will yield a better accuracy thus producing a reliable result. Based on the Figure 4.2, it is shown that most of the element in the geometry have more than 88% quality which shows that the simulation is at the acceptable range. This also applied to all of the geometry.
29
Table 5: Mesh statistics
Inclination Angle (degree, °)
Number of nodes Number of elements Average element quality Aspect ratio 0 123000 118558 0.6273 3.5470 15 1420288 1450626 0.7620 2.6734 30 159259 170384 0.6253 3.6455 45 226334 242574 0.6453 3.4839 60 433645 455227 0.6551 3.4401 75 486707 490363 0.6705 3.3309 90 2051650 1932039 0.7188 2.9422
4.2 Setup for model 4.2.1 Fluid materials
The fluid type chosen for the simulation is oil. ANSYS Fluent have a preset fluid type which denoted as gas oil liquid. The fluid is set to be 830 kg/m3 in density and has a constant viscosity of 0.00332 kg/ms.
4.2.2 Simulation solution method, calculations and assumptions.
Solution method is the setup for the user to choose to instruct ANSYS on which solution must it use to solve the problem. In this case, the most common scheme used which is the “SIMPLE” scheme as it is suitable for incompressible fluid flow is chosen. For the gradient, “Least Square Cell Based” is chosen as the simulation is about incompressible and single phase flow.
To simulate the movement of a ball-like PIG, Discrete Particle Method (DPM) is chosen, a solution that is designed to track the trajectory of the particle in a fluid flowing motion. DPM uses Lagrangian reference frame as the main reference. Lagrangian point of view of fluid flow is that the position and also velocity of individual particle is tracked independently. This can be interpreted as each particle have its own x, y and z coordinate. In this simulation, the flow is assumed to be fully developed. DPM uses equation 4.1 to calculate the movement of the free floating PIG.
30 𝑑𝑢𝑖𝑝 𝑑𝑡
= 𝐹
𝐷(𝑢
𝑖− 𝑢
𝑝) +
𝑔𝑖(𝜌𝑝− 𝜌) 𝜌𝑝+
𝐹𝑖 𝜌𝑝 (Equation 4.1)Equation 4.1 is the particle force balance equation, which is the main part of DPM theory whereby the trajectory is being calculated by integrating the equation.
Particle parameters have been set according to the parameters of the free floating PIG such as the diameter of the PIG, the density of the PIG and also the flow rate it is travelling to simulate the situation as close as possible. The numerical solution in DPM is set to be Trapezoidal, which is one of the higher method and higher accuracy to simulate the trajectory of the PIG.
4.3 Forces acting upon the free floating PIG
In order to understand the contours produced by the velocity of oil and also the velocity of the trajectory of free floating PIG, we must first understand what are the forces acting on the free floating PIG. Figure 4.3 below illustrates the forces that are acting on free floating PIG during the flow in the pipeline.
Figure 4.3: Forces acting on free floating PIG
First and foremost, the common gravity and buoyancy force acting on the free floating PIG are constant. As depth increases, the pressure will increase. Therefore, buoyancy
31
force is created due to the difference in pressure of the top side of the free floating PIG and the bottom side of the free floating PIG thus creating the upward thrust for the free floating PIG.
In contrast, the flow condition will affect the lift and drag force of the free floating PIG. Lift force is the force acting perpendicularly upward on the free floating PIG, relative to the motion of the fluid flowing. The cause of occurrence is due to the difference in pressure from the opposite side of the free floating PIG due to fluid flow past the object. On the other hand, drag force is a force created due to the resistivity acting on the free floating PIG moving through the fluids.
By increasing the velocity, the upward forces will be increase thus overcoming the downward force which will enable the free floating PIG to propel through the inclination. 4.4 Simulation results
Below is the list of results obtained. The three types of results are: 1. The oil velocity contours
2. The oil pressure contours
3. The oil velocity to move free floating PIG through pipe inclination 4.4.1 Oil velocity
Based on the simulation that have been done, there are separation region at the bend for every geometry that have been simulated. This is because when fluid flows to pipe bends, there will be a radial force acting inward on the flow. This may cause centripetal acceleration and inertia thus producing a turbulent flow at most of the bends. The inertial affects also causes the oil flow to move faster. Figure 4.6 shows the oil velocity contour for 30° pipe geometries. Refer Appendix II for the oil velocity contours for other inclination angles.
32
Figure 4.6: Oil velocity contour for 30° pipe geometry
As viewed in Figure 4.6, it is seen that the high velocity region is in the middle of the pipe and the fluid region near the wall have a lower velocity. This is due to the friction loss between the oil and the wall. Figure 4.6 also shows that the separation region occurred at the pipe bends. This also applied to other inclination angle. From the observation made, when the inclination angle is higher, the separation region is bigger.
4.4.2 Oil pressure
Based on the simulation that have been done, it seems like there is a significant change in pressure from the inlet to the outlet. Another observation made is that the high pressure region always occurred at the pipe bends. A sudden change in direction have caused inertial effect thus causing a high impact collision between the oil and the wall of the pipe bends. Figure 4.13 shows the pressure velocity contour for 30° pipe geometries. Refer Appendix III for the oil velocity contours for other inclination angles.
33
Figure 4.13: Oil pressure contour for 30° pipe geometry
From the observation in Figure 4.13, the inlet pressure is higher than the outlet pressure. This is due to the inclination and also the distance that the fluid have travelled. The bends experienced most of the pressure. The higher the inclination angle, the higher pressure experienced at the bends.
4.4.3 Oil velocity to propel free floating PIG through inclination plane
In this section, the minimum oil velocity to impulse the free floating PIG so that it can move through the inclination have been identified. Free floating PIG differs from other conventional PIG because it does not occupy the whole inner diameter of the pipe. It also does not rely on pressure to move along the pipeline. For this simulation, the initial speed of the free floating PIG is set to be 0 m/s to illustrate the actual situation of free floating PIG which rely exclusively on the propulsion of oil.
34
Figure 4.18: Free Floating PIG velocity contour for 0° pipe geometry
Figure 4.18 illustrates the trajectory of the free floating PIG at a 0° inclination propelled by the flow of oil. The inlet velocity of oil in this simulation is 0.5 m/s and as it can be seen from the result, the free floating PIG is able to move from the inlet to the outlet of the pipe. Based on Figure 4.18 also, we can see that the average speed for free floating PIG is ranging from 0.25 m/s to 0.35 m/s, which mainly in the green region of the velocity. Since the free floating PIG is denser and heavier than the oil, the velocity of the free floating PIG is slightly lower than the velocity of oil.
35
Figure 4.19: Free Floating PIG velocity contour for 15° pipe geometry Figure 4.19 illustrates the trajectory of the free floating PIG at a 15° inclination propelled by the flow of oil. The inlet velocity of oil in this simulation is 1.8 m/s and as it can be seen from the result, the free floating PIG is able through the inclination and also from the inlet to the outlet of the pipe. Based on Figure 4.19 also, we can see that the average speed for free floating PIG is ranging from 1.45 m/s to 2.0 m/s, which mainly in the orange and red region of the velocity. By referring to the oil velocity contour in Figure 4.5 in Appendix II, the velocity of oil especially at the inclination part is very high, ranging from 6.8 m/s to 7.2 m/s. This resulted in the high velocity of free floating PIG trajectory at the inclination point. Nevertheless, the velocity of free floating PIG is still lower than the current oil velocity because of higher density as compared to density of oil.
36
Figure 4.20: Free Floating PIG velocity contour for 30° pipe geometry Figure 4.20 illustrates the trajectory of the free floating PIG at a 30° inclination propelled by the flow of oil. The inlet velocity of oil in this simulation is 2.1 m/s and as it can be seen from the result, the free floating PIG is able through the inclination and also from the inlet to the outlet of the pipe. Based on Figure 4.20 also, we can see that the average speed for free floating PIG is ranging from 1.41 m/s to 2.1 m/s, which mainly in the green and yellow region of the velocity. Since the free floating PIG is denser and heavier than the oil, the velocity of the free floating PIG is slightly lower than the velocity of oil.
37
Figure 4.21: Free Floating PIG velocity contour for 45° pipe geometry Figure 4.21 illustrates the trajectory of the free floating PIG at a 45° inclination propelled by the flow of oil. The inlet velocity of oil in this simulation is 2.3 m/s and as it can be seen from the result, the free floating PIG is able through the inclination and also from the inlet to the outlet of the pipe. Based on Figure 4.21 also, we can see that the average speed for free floating PIG is ranging from 1.73 m/s to 2.8 m/s, which mainly in the green and yellow region of the velocity. It can be observed that the velocity is high at the inclination of the pipe. By referring to Figure 4.7 in Appendix II, this is due to the turbulence created after the oil flown pass the elbow. Since the free floating PIG is denser and heavier than the oil, the velocity of the free floating PIG is slightly lower than the velocity of oil.
38
Figure 4.22: Free Floating PIG velocity contour for 60° pipe geometry Figure 4.22 illustrates the trajectory of the free floating PIG at a 60° inclination propelled by the flow of oil. The inlet velocity of oil in this simulation is 2.4 m/s and as it can be seen from the result, the free floating PIG is able through the inclination and also from the inlet to the outlet of the pipe. Based on Figure 4.22 also, we can see that the average speed for free floating PIG is ranging from 2.04 m/s to 3.06 m/s, which mainly in the green and yellow region of the velocity. It can be observed that the velocity is high at the inclination of the pipe. By referring to Figure 4.8 in Appendix II, this is due to the turbulence created after the oil flown pass the elbow. Since the free floating PIG is denser and heavier than the oil, the velocity of the free floating PIG is slightly lower than the velocity of oil.
39
Figure 4.23: Free Floating PIG velocity contour for 75° pipe geometry Figure 4.23 illustrates the trajectory of the free floating PIG at a 75° inclination propelled by the flow of oil. The inlet velocity of oil in this simulation is 2.4 m/s and as it can be seen from the result, the free floating PIG is able through the inclination and also from the inlet to the outlet of the pipe. Based on Figure 4.23 also, we can see that the average speed for free floating PIG is ranging from 2.05 m/s to 3.1 m/s, which mainly in the green and yellow region of the velocity. It can be observed that the velocity is high at the inclination of the pipe. By referring to Figure 4.9 in Appendix II, this is due to the turbulence created after the oil flown pass the elbow. Since the free floating PIG is denser and heavier than the oil, the velocity of the free floating PIG is slightly lower than the velocity of oil.
40
Figure 4.24: Free Floating PIG velocity contour for 90° pipe geometry Figure 4.24 illustrates the trajectory of the free floating PIG at a 90° inclination propelled by the flow of oil. The inlet velocity of oil in this simulation is 5.4 m/s and as it can be seen from the result, the free floating PIG is able through the inclination and also from the inlet to the outlet of the pipe. Based on Figure 4.24 also, we can see that the average speed for free floating PIG is ranging from 5.3 m/s to 8.4 m/s, which mainly in the green and yellow region of the velocity. It can be observed that the velocity is high at the inclination of the pipe. By referring to Figure 4.10 in Appendix II, this is due to the turbulence created after the oil flown pass the elbow. Since the free floating PIG is denser and heavier than the oil, the velocity of the free floating PIG is slightly lower than the velocity of oil.
41
Table 6 below shows the summary of the result obtained from the simulation of the free floating PIG. From the result obtained, it can observed that with the increase in inclination angle of the pipe, the higher the velocity needed to push the free floating PIG upward. We can also observed that the average velocity of the free floating PIG is lower than the average velocity of oil flowing in the pipe.
Table 6: Summary of Results Inclination Angle
(degree, °)
Inlet Velocity of Oil (m/s) Average Velocity of free floating PIG (m/s) 0 0.5 0.25 – 0.35 15 1.8 1.45 – 2.00 30 2.1 1.41 – 2.10 45 2.3 1.73 – 2.80 60 2.4 2.04 – 3.06 75 2.4 2.05 – 3.10 90 5.4 5.30 – 8.40
Based on the trajectory shown in 4.4.3, it can be observed that higher inclination angle will result in more random trajectory of free floating PIG in the pipe. It also causes the free floating PIG to wobble so much due to the turbulent flow that often occur at the elbow of pipe. This will cause the free floating PIG to hit the wall often which will create noise and interrupt the acoustic sensor within the free floating PIG.
The range of speed gained from this simulation is acceptable based on the paper by [18] where it is stated that the recommended speeds for cleaning PIG are in the region of 1 to 5 m/s, slightly different from this project which uses the free floating PIG.
4.5 Piping layout for flow loop
The laboratory scale experiment will be conducted once the fabrication of the layout of flow loop have been done. The flow loop layout will have the key features such as the variation of inclination angle and pipe leaks to run the experiment as real as possible. The data from the simulation will be use in running the experiment.
42 4.5.1 Design
The piping layout for the flow loop have been designed. The design will have adjustable pipe support and also flexible elbow in order to vary the inclination of the piping layout. The design will also features acrylic pipe in order to observe the flow of the free floating PIG in the pipeline. Figure 4.25 shows the isometric view of the experimental layout and Table 7 shows the bill of material for the layout. Refer Appendix IV for other views on the layout.
Figure 4.25: ISO View of Experimental Layout
Table 7: Bill of Materials
No Item Size Quantity BOM Notes
1 Transparent Arcylic Pipe 4" 17 meters -
2 Flexible joint 4" 4 Variable degree
3 T-joint 4" 2 PVC
4 90 degree elbow 4" 6 PVC
5 Adjustable pipe support - 5 Steel
6 Plastic tank 1m x 0.6m 1 Holes for pipes
7 Pump 1 hp 1 Adjustable
43
CHAPTER 5
5.0 Conclusion and Recommendation 5.1 Conclusion
It is crucial to ensure that the free floating PIG can travel through the inclination to enable leak to be detected. Inspection for pipe leakage is very important to avoid problems that are costly and deadly. Necessary parameters need to be determined to ensure the propulsion of the free floating PIG in the pipeline through the inclination.
To conclude, the result quality gained are high since the higher order of numerical solution is chosen to solve the simulation problem. A high percentage quality for meshing of the fluid geometry is gained and this will eventually help in increasing the accuracy of the result of simulation.
The project have successfully predicted the minimum velocity for the free floating PIG to propel through the inclination angle of the pipeline. The simulation also displayed the probable trajectory of the free floating PIG and also the velocity and pressure profile of the fluid behaving in the pipeline with the given inlet speed.
The expectation for this project is that it will gives out vital information about the movement of a free floating PIG for a different inclination angle of pipeline as this can help the propulsion of the free floating PIG through the inclination.
5.2 Limitations
The following limitations apply to this project as a whole.
1. The simulation does not take into account the flow assurance issue often faced in the oil and gas industry during pigging. The software used have limited method or setup to simulate the situation.
44 5.3 Recommendation
Based on the project conducted, there are some recommendation made in order to improve the foundation of this project. The focus will be on two parts mainly the simulation and also the experiment.
i. Design a program specifically for free floating PIG
Methods that are available now in ANSYS is very general and can be used in many application. DPM for example, can also be used to study about coalition of blood cells and also study about the projection of water vapors. It is about time that the industry produce a program specifically for PIG trajectory in pipeline and take into account the flow assurance issues, as PIGs are now have been widely use in the industry. A collaboration with ANSYS, Inc. is possible in order to come out with the best program, specifically for PIG simulation.
ii. Laboratory scale experiment construction
The experiment must be conducted using the key parameters input from the simulation to further justify the results gained from the simulation. The hands on experiment must simulate the real situation in oil pipeline to gained good results for the project.
45 References
[1] Reuters, 'Factbox: Recent North American oil pipeline spills', 2014. [Online]. Available: http://www.reuters.com/article/2013/10/10/us-usa-pipeline-spills-factbox-idUSBRE9990XH20131010. [Accessed: 30- Oct- 2014].
[2] KROHNE , "PipePatrol Leak Detection and Localisation System", Krohne.com, 2015. [Online]. Available: http://krohne.com/en/products/systems/pipepatrol/. [Accessed: 09- Apr- 2015].
[3] D. Combe and D. Hair, 'Problems with Operational Pigging in Low Flow Oil Pipelines', 2011.
[4] R. Davidson, 'An Introduction to Pipeline Pigging', 2002.
[5] A. van der Werff, 'The Importance of Pipeline Cleaning: Risks, Gains, Benefits, Peace of Mind', in Pipeline Technology Conference, Hannover Messe, Hannover, Germany, 2006.
[6] RST Projects Limited, 'The Use of Cleaning PIGs to Inspect Pipelines', Musselburg, UK, 2000.
[7] F. Esmaeilzadeh, D. Mowla and M. Asemani, 'Mathematical modeling and simulation of pigging operation in gas and liquid pipelines', Journal of Petroleum Science and Engineering, vol. 69, no. 1, pp. 100--106, 2009.
[8] X. Xu and J. Gong, 'Pigging simulation for horizontal gas-condensate pipelines with low-liquid loading', Journal of Petroleum Science and Engineering, vol. 48, no. 3, pp. 272--280, 2005.
[9] X. Yu, B. Xie, Q. Li and B. Cheng, 'Pigging Simulation Analysis of Deepwater Gas Tieback Flowlines in South China Sea', in Proceedings of the Twenty-third (2013) International Offshore and Polar Engineering, Anchorage, Alaska, USA, 2013, p. 736.
![Table 1: Pipeline parameters [9].](https://thumb-us.123doks.com/thumbv2/123dok_us/9036251.2801433/17.918.173.828.370.588/table-pipeline-parameters.webp)
![Figure 2.4: SmartBall tool with foam overshell [ 15] .](https://thumb-us.123doks.com/thumbv2/123dok_us/9036251.2801433/23.918.272.711.107.395/figure-smartball-tool-foam-overshell.webp)
![Figure 2.6: Accelerometer signal [15]](https://thumb-us.123doks.com/thumbv2/123dok_us/9036251.2801433/24.918.266.720.101.336/figure-accelerometer-signal.webp)
![Figure 2.7: SBR and Acoustic Sensor adhered to pipeline [ 15]](https://thumb-us.123doks.com/thumbv2/123dok_us/9036251.2801433/25.918.246.737.107.432/figure-sbr-acoustic-sensor-adhered-pipeline.webp)
![Figure 2.8: Leak detected in Analysis Software [ 15]](https://thumb-us.123doks.com/thumbv2/123dok_us/9036251.2801433/26.918.294.691.108.406/figure-leak-detected-analysis-software.webp)