Market Capitalisation of the Bombay Stock Exchange
By Lalita Saptagiri
Department o f Economics
School of Oriental and African Studies
Centre for Finance and Management Studies
A Thesis Subm itted in Partial Fulfilm ent o f the Degree o f Ph.D. o f U niversity o f London.
ProQuest Number: 10672681
All rights reserved INFORMATION TO ALL USERS
The qu ality of this repro d u ctio n is d e p e n d e n t upon the q u ality of the copy subm itted. In the unlikely e v e n t that the a u th o r did not send a c o m p le te m anuscript and there are missing pages, these will be note d . Also, if m aterial had to be rem oved,
a n o te will in d ica te the deletion.
uest
ProQuest 10672681Published by ProQuest LLC(2017). C op yrig ht of the Dissertation is held by the Author. All rights reserved.
This work is protected against unauthorized copying under Title 17, United States C o d e M icroform Edition © ProQuest LLC.
ProQuest LLC.
789 East Eisenhower Parkway P.O. Box 1346
Abstract
This thesis aims to provide an explanation for the causes of existence of many low capitalised companies (LCCs) listed on the Bombay Stock Exchange. The main theoretical framework for the thesis is derived from the agency conflicts approach. The agency model examines the relationship between managers and owners and determines managerial effort in a contractual arrangement under asymmetric information.
Given the developing nature of the financial and industrial structure in India, the agency conflicts between the different claimants take a different form as compared to that suggested in the traditional agency literature, which is oriented towards developed market economies. Accordingly, the inherent governance structures, which are specific to India and changes initiated by financial reforms of the early 1990s, make a strong case for agency theory to be used as a tool to investigate the peculiarity of Indian stock markets. The dynamics of agency conflicts inherent in the firm structure influences all decisions made in the firm, i.e. debt-equity ratio, dividend policy. It then becomes important to study the impact of the firm’s structure 011 its outstanding equity. This thesis is an attempt at analysing the low average
market capitalisation of the BSE from the point of view of owner-managerial behaviour capacitating financial decision-making i.e. how the decision-making of the owner-managers affect the value of the outstanding stock.
The existence of many LCCs on the BSE can be analysed by the simple "entry and exit" model of firms into the low capitalised category of the stock market. Among other reasons the entry of firms into BSE was facilitated by relaxation of many stringent bureaucratic policies towards new firms making their maiden public issues. Survival of a firm depends on its performance in the real market and effective monitoring is required to sustain both performance in the market and any improvements thereof. An LCC can move to a different capitalisation category through internal growth and takeovers or mergers. LCCs on the BSE face not only an ineffective outside monitoring (outside shareholders and debt holders) but also non-existent market "exit" mechanisms of takeovers or mergers. Most of the LCCs have exited from the stock exchange through de-listing (if firms fail to pay the listing fees and abide by the rules of the exchange) by SEBI, the regulatory authority. This corroborates to the insufficiency of the market mechanisms of "exit" in changing the status quo of LCCs. This thesis explores the causes behind the non-existent mechanisms of "exit" for LCCs.
This thesis proposes that lack of exit mechanisms stem from a market for lemons syndrome. Effective monitoring from outside stakeholders i.e. diffused shareholders is non existent because of the free rider problem. Whereas block debt holders base their monitoring on the relative position of a particular firm in their portfolio or the importance of a firm to the block debt holder determines the extent of monitoring. Lack of an effective outside monitoring is manifested in the dividend policy, which reflects accumulation of free cash flow used for the personal benefit of owner-managers. Lack of effective monitoring and exit mechanisms have led to the existence of many LCCs and them continuing in the similar status for a long period of time. These hypotheses were established with the help of an interview-based survey of managers working for these firms as well as econometric analysis of their financial data.
3
Acknowledgements
I convey my sincerest gratitude to my supervisor Prof. Laurence Harris who provided me with timely guidance. He was ever helpful in directing me towards the right path from the very beginning of my research. His comments and suggestions have always helped me to improve the quality of this work and I am very thankful to him for that.
My father D. N. Brahma and my mother have been a constant source of support in all these years of study without, whom I would not have been able to finish my studies. Asholc Som, my husband put up with me in my difficult times. Thanks goes to all those managers who participated in my field survey and lent their valuable time. Last but not the least, special thanks to all my friends who have lend me their support in different ways.
Table of Contents
Title Page 1
Abstract 2
Acknowledgements 3
Table of Contents 4
List of Tables and Figures 7
List of Abbreviations 10
Chapter- 1: The Stock Exchange, Mumbai. 12
1.1 Introduction 12
1.2 Indian Stock Markets 14
1.3 Objective of the Thesis 23
1.4 Analytical Framework 30
1.5 Structure of the Thesis 32
Chapter-2: Survey of Principal-Agent Conflicts and Corporate Governance 35
2.1 Introduction 35
2.2 Agency Problem 37
A. Implications drawn from the Current Literature 42
2.3 Agency Costs of Debt 45
A. Agency costs of Debt and State-Owned Financial Institutions 57
2.4 Agency Costs of Equity 62
A. Conflict between Large and Minority Shareholders 66
B. Ownership Structure and Monitoring 68
2.5 Agency Motives of Takeovers 7 5
A. Role of Financial Institutions in Takeovers 82
B. Reputation Building 85
2.6 Agency Costs and Industry Equilibrium 88
2.7 Conclusion 90
Chapter-3: Capital Structure and Governance Structures in Indian Companies 93
3.1 Introduction 93
3.2 Sources of Finance for Indian Companies 102
A. Debt 102
1. Debentures and other Corporate Debt Instruments 102
2. Bank Borrowings 106
3. Financial Institutions 108
B. Equity 115
1. Shares 115
3.3 Determinants of Debt-Equity Ratio 122
3.4 Financial Reforms and the Changing Capital Structure of Companies 129
3.5 Market for Takeovers in India 133
3.6 Conclusion 137
5
Chapter - 4: Models of Takeovers and Corporate Monitoring by Institutional Debtholders 153
4. 1. Introduction 153
SECTION-1 155
Market fo r Lemons and Takeovers
4.2 Introduction 155
4.3 Model 159
4.4 Conclusion 164
SECTION-2 166
Institutional Debtholders and Corporate Monitoring
4.5 Introduction 166
4.6 Model 169
4.7 Conclusion 174
Chapter - 5: Dividend policy 176
5.1 Introduction 176
5.2 Theories of Dividend Policies and their Critique 181
A. Agency Theory 181
B. Signalling Theory 187
5.3 Model 192
5.4 Conclusion 197
Chapter - 6: Analysis of Survey Results 199
6.1 Introduction 199
6.2 Survey Design 201
A. Data 201
B. Industry Groups 202
C. Nature of the Firms 203
D. Questionnaire 205
6.3 Theoretical Issues related to the Dividend Policy 205
6.4 Theoretical Issues related to Monitoring 208
6.5 Results 210
A. Approach towards the Issues involving Dividend Policy 210
B. Approaches to issues related to Monitoring by the Financial Institutions 213
C. Industry Influence on Dividend Policy 215
6.6 Conclusion 216
Chapter - 7: Econometric Analysis 218
7.1 Introduction 218
7.2 Hypotheses 219
7.3 Empirical Analysis 221
A. Data 221
B. Sample period 221
C. Selection of the Sample 222
D. Nature of the Firms 223
E. BSE Sensex Companies 224
7.5 Methodology 233
7.6 Results and Analysis 235
7.7 Conclusion 241
Appendix 7.1 243
Chapter - 8: Conclusions 257
7
List of Tables
Table 1.1: Proportion of LCCs in BSE 17
Table 1.2: Performance of Indian stock markets 18
Table 1.3: Comparison of market capitalisation and turnover ratios with other emerging 18 and developed markets.
Table 1.4: Capital raised in the primary market 19
Table 1.5: Proportion of IPOs in the public issues 20
Table 1.6: Number of listed domestic companies 20
Table 1.7: Market concentration in BSE 21
Table 1.8: Market capitalisation, No. of domestic companies listed and turnover ratio in 22 BSE
Table 1.9: Debt-equity ratios of Indian corporate sector 24
Table 2.1: Closely held and privately held companies 56
Table 3.1: Financial ratios 93
Table 3.2: Pattern of equity ownership in different types of companies 95
Table 3.3: Distribution of outstanding corporate equity for select countries 96
Table 3.4: Top listed companies in manufacturing, mean proportion of internal and 96
external finance of corporate growth
Table 3.5: Gross and net sources of finance for the Indian corporate sector 97
Table 3.6: International comparisons 97
Table 3.7: Share capital raised during 1957-90 99
Table 3.8: Firm characteristics of some developing and developed economies 100
Table 3.9: Debt-Equity Ratios 101
Table 3.10: Sources of debt 102
Table 3.11: Debentures and loans as a source of finance between 1957-1990 103
Table 3.12: Debentures and loans as a source of finance between 1991-98 104
Table 3.13: Borrowings by the IDBI sample of 401 Companies as on 31 March 104
Table 3.14: Bank borrowings as a source of finance during 1951-52 and 1973-74 106
Table 3.15: Structural changes in the pattern of lending between 1969 and 1996 107
Table 3.16: Bank credit to small and large industry 107
Table 3.17: Cumulative equity and preference capital support by all FIs till 1989 110
Table 3.18: Financial Institutions as source of finance 110
Table 3.19: New security issues during the period 1952-1994 117
Table 3.20: Security-wise classification of new issues during plan periods 118
Table 3.21: Components of capital issues 118
Table 3.22: Mode of capital issues 119
Table 3.23: Pattern o f capital issues with reference to the issuing bodies 119
Table 3.24: Corporate financing trends from 1951-52 to 1988-89 122
Table 3.25: Relative roles of different sources 123
Table 3.26: Paid up capital of some private sector companies between 1950-80 124
Table 3.27: Paid up capital of public limited companies between 1987-98 124
Table 3.28: Banking performance in different countries 130
Table 3.29: Distribution of Mergers and Acquisitions in India by various categories, 1991-97 135
Table 3.30: Distribution of Mergers and Acquisitions in India by identity of the active 135
company 1991-97
Table 3.31: Companies delisted from 1995 to 1999 by SEBI 136
Table 5.1: Public issues, rights issues and private placement of shares by the sample 178
LCCs between 1991-99
Table 5.3: Correlation between lagged retained earnings and PAT in the sample LCCs. 179
Table 5.4: Growth in PAT in the sample LCCs 179
Table 5.5: Correlation between earnings and dividends in the sample LCCs 179
Table 5.6: Dividends of sample LCCs following Equity Issues after 1990 182
Table 5.7: Mergers and Acquisitions by the sample LCCs since 1990 184
Table 5.8: No. of News items covered by the different financial press of the sample LCCs 191
Table 6.1: Year of Incorporation of the sample LCCs 203
Table 6.2: Percentage equity ownership in the sample LCCs 204
Table 6.3: Results of responses related to dividend policy 212
Table 6.4: Results of responses related to FIs 214
Table 7.1: Equity ownership pattern in BSE SENSEX companies 224
Table 7.2: Ratio of dividends and PAT and retained earnings and PAT in BSE SENSEX 225
companies
Table 7.3: Correlation between retained earnings (lagged) and PAT in BSE SENSEX 225
companies
Table 7.4: Growth in PAT in the BSE Sensex companies 225
Table 7.5: Rights, private placement and public issues of BSE SENSEX companies 225
between 1991-99
Table 7.6: Results of panel data analysis of BSE Sensex companies 235
Table 7.7: Results of panel data analysis of the sample LCCs 236
Table 7.8: Summary of the relationship between dividend payouts and other regressors 237
T able 7.9: Summary of the relationship between dividend payouts with other regressors in 239 the Heavy industry group
Table 7.10: Summary of the relationship between dividend payouts with other regressors 239
in the Light industry group
Table 7.11: Summary of the relationship between dividend payouts with other regressors 239
in the Other industry group
9
List of Figures
Figure 2.1: Traditional agency costs of debt 48
Figure 2.2: Agency costs of debt in relation to market value of the firm 53
Figure 2.3: Traditional Agency costs of equity 64
List of Abbreviations and Acronyms
BIFR Board of Industrial and Financial Reconstruction
BOLT BSE On-Line Trading System
BSE Bombay Stock Exchange
BSE Sensex Bombay Stock Exchange Sensitive Index
CCI Controller of Capital Issues
CDs Convertible Debentures
CMIE Center for Monitoring Indian Economy Pvt. Ltd.
Cr. Crore (Rs. 1,00,00,000)
CRAR Capital to Risk weighted Assets Ratio
CRR Cash Reserve Ratio
D:E Debt Equity ratio
EBIT Earnings before hiterest and Taxes
ERCs Earnings Response Coefficients
FCCs Foreign Controlled Companies
FERA Foreign Exchange Regulation Act
FIs Financial Institutions
FOBs Family owned Businesses
GIC General Insurance Corporation of India
ICCs Indian Controlled Companies
ICICI Industrial Credit and Investment Corporation of India
IDBI Industrial Development Bank of India
IFCI Industrial Finance Corporation of India
IPO Initial Public Offering
IRBI Industrial Reconstruction Bank of India
Lakh Rs. 100, 000
LCCs Low Capitalised Companies
Low-cap Low Capitalised Company
LIC Life Insurance Corporation
M&A Mergers and Acquisitions
MBO Management Buyout
Mkt. Cap. Market Capitalisation
MIS Management Information Systems
MNCs Multi-National Companies
MRTP Monopolies and Restrictive Trade Practices Act
NBFCs Non-Bank Financial Companies
NCDs Non- Convertible Debentures
NPV Net Present Value
NSE National Stock Exchange
NYSE New York Stock Exchange
OECD Organisation for Economic Co-operation and
Development
OTCEI Over the Counter Exchange of India
P/E Price Earnings ratio
PAT Profits after Tax
PUC Paid Up Capital
R & D Research and Development
RBI Reserve Bank of India
S & P Standard & Poor
SBI State Bank of India
SCICI Shipping Credit and Investment Corporation of India
SCMRD Society of Capital Market Research and Development
SEBI Securities Exchange Board of India
11
SI-ICIL Stock Holding Corporation of India Ltd
SIDBI Small Industries Development Bank of India
SLR Statutory Liquidity Ratio
SOEs State owned Enterprises
Chapter-1
The Stock Exchange, Mumbai
1. 1 INTRODUCTION:
The recent east Asian economic crisis has shown that even highly successful economies w ith high economic growth rates can suffer if there are fundamental flaws in corporate, financial and governance systems. For a large majority o f developing countries including India, the last decade was characterised by considerable deregulation, privatisation, internal and external liberalisation o f product markets as well as extensive financial liberalisation. This has meant that some version o f the Anglo saxon model of corporate, financial and governance systems has been adopted by many o f these developing countries. One o f the structural characteristics which have been criticised for the east Asian crisis is the nature o f corporate finance. Although India has been quite immune to the fall out in east Asia, there are important lessons that it needs to learn in order not to face the same grief.
The interface between capital markets and firms provides avenues o f performance monitoring by a number o f agents under a variety o f circumstances, depending on the firm ’s financial policies. Differences in the financial policies o f films (the formulation, im plementation and adaptation o f corporate strategy) lead to differences in financial preferences on the part of investors and may result in a variety o f systemic outcomes. “Insider” system s1 are considered superior at implementing policies that require strong relations with a number o f different stakeholders. “Outsider” systems2 are better at responding to market driven change (Sarkar et al., 1998). But a hybrid o f these two
1 Characterised by greater concentration o f shareholder power with banks, families and the other films. 2 Characterised by diversified equity ownership and less involvement o f lending institutions.
13
systems in India seem to be dominated by their respective disadvantages rather than their advantages, the next chapters provide evidence to this statement.
Performance monitoring by different constituents o f the capital market is, in principle, a key element in influencing overall “corporate governance”. The interaction among competition, governance and performance o f firms is strong although the existing literature does not provide sufficient evidence to support a conclusive basis for any policy decisions (Mayer, 1996). Corporate governance has become a subject o f active academic and policy debate throughout the world, although in the UK and US, there is much discussion o f the deficiencies o f the market system in delivering effective governance.
This thesis tries to analyse one particular element of apparent m arket failure in the governance o f firms in the developing country context o f India. Specifically this thesis tries to illuminate w hy such a large number o f veiy low market-capitalised companies (LCCs) continue to exist in listings on Indian stock exchanges, i.e. w hy the entiy o f LCCs on capital markets is so facile while exit is so rare. The reasons o f this phenomenon could be due to both a p riori structural and incentive deficiencies and/or empirical failures o f the market in permitting the phenomenon to persist and recur. The presence o f such a phenom enon indicates structural, policy and regulatory shortcomings in the Indian capital market which bear examination and rectification. Using empirical analysis and personal- interview-based survey o f managers o f the LCCs, the thesis points to possible causes o f m arket failure in inducing sufficient and effective corporate governance. Persistence o f ineffective corporate governance leads to too many firms remaining in a low market- capitalisation trap over a long period o f time. This not only reduces overall market capitalisation o f Indian stock markets, it also diminishes their quality.
The structure o f this introductory chapter is as follows, Section 1.2 deals with a description o f the Bombay Stock exchange, the premier stock exchange o f India, Section 1.3 outlines the objectives o f this study while Sections 1.4 and 1.5 provide an analytical and overall structure for the thesis.
1. 2 INDIAN STOCK MARKETS (BOMBAY STOCK EXCHANGE):3
A discussion o f the Indian Stock Markets, requires tobe preceded by an outline o f some of the key features o f the Indian financial system. The Indian financial system is characterised by relatively small, highly imperfect stock markets, a very large number o f medium and small firms, and a banking cum long term “development financing” institutional system which lends large amounts to companies but does not have the kind o f close or inter-corporate ties with firms (Cobham and Subhramanyam, 1998) that bank dominated systems in Germany, Japan and Korea for example have had. Between 1950- 85, the m ain feature o f the industrial funding pattern in India was the significant usage of debt4 (owed to banks and other institutions i.e., not “marketable” debt). The major Financial Institutions (FIs) in India played a highly significant role in funding corporate growth, during a period when equity markets had not evolved to their current dominant status. The investment made by the FIs in terms of both debt and equity in public and private industrial corporations was veiy high. The eventual transformation towards market-based equity financing was consciously brought about by different government
3 Bombay Stock Exchange has been renamed as Stock Exchange, Mumbai, but the old and more widely recognised name o f Bombay Stock Exchange is used throughout this thesis.
4 Financial Institutions (FIs) provided credit at relatively stable lending rates during the 1980s. The prime-lending rate o f the major FIs duiing the 1980s was 14% whereas the regular short-term prime-lending rates o f commercial banks were between 16 and 19.5%. Inflation rates based on the W holesale Price Index were between 4.5% and 8% during the period. Although the GDP deflator was higher, and was between 6.5%-9.3%, real interest rates on non-concessional loans were positive. The fiscal system also encouraged debt finance over equity; as a result Indian firms have been highly leveraged and dependent on the FIs for their investment needs (Srivastava and Schiantarelli, 1997).
15
policies5 occurring from the m id 1980s onward and accelerating after the 1991-92 crisis. In India as in many other developing economies, the State has been active in promoting the growth o f the stock markets (Singh, 1993).
Indian stock markets are many and varied. India currently has 2 national and 23 regional stock exchanges and an over-the-counter market, which are recognised by the Government under the Securities Contracts (Regulation) Act, 1956. The two national stock exchanges are both located in Mumbai. The regional stock exchanges are located in other prim ary and secondary cities in India, including Delhi, Calcutta, Chennai, Ahmedabad, Hyderabad and Bangalore. All these stock exchanges function under the regulation o f the M inistry o f Finance and Securities and Exchange Board o f India (SEBI). By any comparative standard for emerging markets Indian stock markets have a very large base o f shareholders6 (the retail equity investor population increased from about 2 million in 1980 to around 25 million in 1996-97, while the number o f retail investor accounts that the mutual fund industry manages is estimated at around 50 million). Retail investors are currently serviced by about 6500 brokers and 150,000 intermediaries, including sub-brokers, and investment advisors (Roy et al., 1997).
The Bombay Stock Exchange (BSE), which forms the focal point o f this study, is the oldest in Asia as well as the largest in hidia (Price, 1994). BSE accounts for nearly 70% of daily turnover and for 75% o f total market capitalisation in India. It was established in 1875 as "The Native Share and Stockbrokers Association" and is a voluntary non-profit making association. The Exchange has evolved over the years into its present status as one o f the two premier Stock Exchanges in the country. A t present
5 Foreign Exchange Regulation Act, 1973 and other fiscal measures (see Chapter- 2 ),
there are over 6,000 companies listed on the BSE; a very high number o f listed companies compared to any other emerging or developed market.7
Yet, although the secondary market in BSE is characterised by voluminous trading, that volum e is highly concentrated in ju st a few issues. Trading in the shares o f 50 companies, out o f the 6000 listed (with a total market capitalisation o f about Rs. 2.5 trillion), accounts for over 80% o f market turnover. More recently about 65% o f trading volume has been concentrated in ju st 10 scrips. The market is afflicted by outdated and inefficient floor trading practices, which are opaque. Broker behaviour is severely inimical to the m arket’s integrity and to the interests o f all other m arket participants (CR 1992, Gupta 1990).
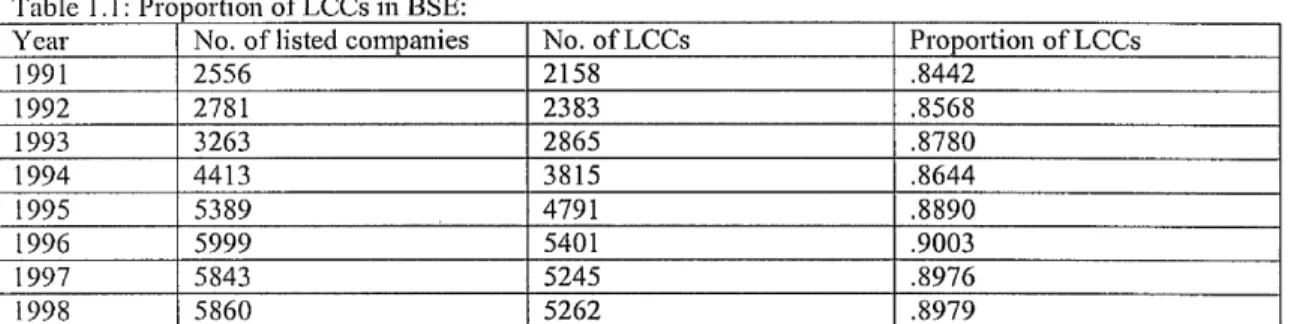
But given the large number o f listed companies, the average market capitalisation o f BSE is inefficiently low (because o f a very large proportion o f firms w ith extremely low market capitalisation as shown in table 1.1) compared to other emerging markets; which have far fewer num ber o f firms listed on their stock markets. Under a process o f gradual reform initiated in the early 1980s,8 market capitalisation has been steadily increasing9 along w ith the number o f companies listed on the stock market.
7 USA lias the largest number o f companies listed on its stock exchanges followed by India and the BSE. 8 The first step towards decontrol and deregulation was taken in 1982 with the decontrol o f cement companies and prices. Although that decade did not witness major changes in the financial system, it started a period o f gradual change towards decontrol and deregulation. But growing public concern about the need to reform stock markets led the government to set up a committee in May 1984 under G.S. Patel. The Committee submitted its final report to the government in June 1986, suggesting a radical and exhaustive set o f recommendations for the primary and secondary markets. Since then the government has managed to implement a few not-so-important recommendations like the cost o f raising fresh capital and increasing the marketable lot o f shares o f new companies to a uniform number o f 100. The other suggestions o f this committee were; a uniform structure and organisation for all stock exchanges, closer supervision o f the day-to-day functioning o f the stock market, broad-based membership o f the stock exchanges, computerisation o f dealings in securities, strict curbs on insider-trading and simple transfer procedures. Very few o f these recommendations were implemented until 1998, when dematerialisation was introduced along with changes in settlement systems and periods. The Patel report remains among the more exhaustive and visionary documents produced on reforming India’s capital markets.
17
Table 1,1; Proportion o f LCCs in BSE:
Year No. o f listed companies No. o f LCCs Proportion o f LCCs
1991 2556 2158 .8442 1992 2781 2383 .8568 1993 3263 2865 .8780 1994 4413 3815 .8644 1995 5389 4791 .8890 1996 5999 5401 .9003 1997 5843 5245 .8976 1998 5860 5262 .8979
Note: Tlie proportion o f LCCs was derived by subtracting the number of companies which are part o f stock market based indices like BSE Sensex, BSE National Index, B SE-100 Index, BSE-200, BSE-500, S&P Mid Cap. All these indices have overlapping listed companies and there is no specific index for the LCCs.
A round o f deeper financial reforms triggered by the severe financial crisis o f 1991-9210 has resulted in a m ajor increase in the market capitalisation o f the BSE (which represents about 75% o f the total market capitalisation o f the country) has quadrupled from Rs. 1.1 trillion at the end o f 1990-91 to Rs. 4.64 trillion at the end o f 1996-97. By 1998, 9,833 companies were listed on all the stock exchanges in India, compared to 9,89011 companies listed at the end o f 1996-97. The total market capitalisation o f companies listed on the BSE (5,85312 companies listed on BSE in 1998) was Rs. 5.60 trillion as on M arch 31, 1998, indicating a rise o f 20.78% from its 1996-97 level o f Rs.
10 A Committee on (Reforms o f the Financial System, 1991) headed by Mr. Narasimham set out the rationale o f the 1991-92 financial sector reforms. It submitted its report on Dec. 1991 which put forward a set o f recommendations dealing with various aspects o f the functioning o f the financial system i.e.
improving the efficiency and effectiveness o f the sector conceding operational freedom and flexibility to it through regulation and supervision in a free financial environment. Capital market reforms in the period 1992-93 to 1996-97 include:
• A llowing direct stock investments by institutions, • Permitting private sector mutual funds to be established,
• Scrapping o f the Office o f Controller o f Capital Issues (CCI) that regulated the issuance o f stocks and debentures,
• Establishment o f SEBI as a regulator o f the capital market,
• Allowing companies to access international capital markets through Euro Issues. Firm level reforms included;
• Compulsory disclosure o f material facts and specific risk factors associated with their projects while making public issues,
• Mandatory filing o f annual statements disclosing end use o f funds by companies raising funds from the capital market,
• Underwriting by the issuer has been made optional to reduce costs o f issue. 11 Includes companies listed in the OTC market.
4.63 trillion. As a percentage o f GDP, movement in market capitalisation lias been more erratic, but this ratio has also been rising (SEBI Report, 1998).
Table 1.2: Performance o f Indian Stock Markets.
Year 1991 1992 1993 1994 1995 1996 1997
Trading Val (Rs. bn.) 626.81 572.72 675.15 854.14 724.40 3398.44 5764.83
Mkt. Cap/GDP 19% 27% 38% 42% 39% 34% 33%
Traded Val/GDP 10% 8% 9% 9% 6% 27% 40%
Traded Val/Mkt.Cap 51% 31% 22% 21% 16% 77% 122%
Source: SEBI Annual Report, 1998.
In Tables — 1.3 and 1.4 emerging markets have been listed by the size o f their m arket capitalisation. They highlight the very low market capitalisation w hen expressed as an average per company.
Table 1.3: Comparison o f Indian Stock Market Capitalisation and Turnover ratios with other Emerging and Developed markets.____________ ______________ ______________________________ ______________ _______ Countries Mkt. Cap.
($ bn)
Turnover ratio13 (%)
Value Traded Mkt. Cap. ($ bn) Turnover ratio (%) Value Traded 1998 1991 Similar Markets India 105.2(21) 55.2(27) 64498(19) 47.7 50.9 24295 Korea 114.6(20) 28.9(48) 137859(17) 96.4 85464 M exico 91.8(25) 27.3(46) 33841(28) 98.2 32.3 31723 Malaysia 98.5(23) 9.1(64) 6805 58.7 10657 Singapore 94.5(24) 50.5(33) 50735(23) 47.6 37.9 18074 Larger Markets US 13451.3(1) 106.2(10) 13148480(1) 4087.6 534.4 2183910 Japan 2495.7(2) 40.3(35) 948522(4) 3130.8 100.7 315279 UK 2374.3(3) 53.4(30) 1167382(3) 987.9 100.8 995939 Taiwan 260.0(14) 323(1) 884698(5) 124.8 292.5 365232 Brazil 160.9(18) 70.4(21) 146594(16) 42.8 31.2 13373 Smaller Markets Austria 34106(37) 47.4(34) 16566(32) 7689 - 7039 Thailand 34903(36) 71(19) 20734(31) 35815 64.5 23119 Pakistan 5418 111.1(9) 9102(39) 7387 155.3 11476 Sri Lanka 1705 14.8(53) 281 1936 16.0 311 Bangladesh 1034 61.7(25) 793 269 142.7 384
Note: Numbers in the brackets show the world rankings.
Source: IFC Emerging Stock Market Fact book, 1999, P. No. 15-17, 20-23.
13 The ratio o f total value traded for the period to average market capitalisation in local currency. Average market capitalisation is the mean o f the end-of-period market capitalisation o f the prior and current periods.
19
Table 1.4: Number o f Listed Domestic Companies. (End o f period levels)
Countries No. o f Domestic Listed Companies
Similar Markets 1998 1991 India 5860(2) 2556 Korea 748(13) 183 M exico 194 209 Malaysia 736(15) 321 Singapore 321(25) 166 Larger Markets US 8450(1) 6742 Japan 2416(4) 2107 UK 2399(5) 1623 Taiwan 437(22) 221 Brazil 527(20) 570 Smaller Markets Austria 96 105 Thailand 418(24) 276 Pakistan 773(12) 542 Sri Lanka 233(38) 178 Bangladesh 208 138
Source: Emerging Stock Markets Fact book, International Finance Corporation, 1999.
W ith almost similar levels of market capitalisation, the num ber o f domestic companies listed in Korea, Mexico, Singapore, or Malaysia is far fewer than the number in India. The tables below also show the world ranking o f the BSE in terms o f market capitalisation (rank 20) and number o f domestic companies listed (rank 2) in 1998. The comparison between 1991 and 1998 in these tables highlights increases in these two measures after the 1991-92 financial reforms that took place in India. So the BSE portrays an unusual situation in that with very low market capitalisation, a large number o f existing as well as new companies have resorted to new market-based equity issues14 to finance the growth o f their net assets as shown in tables 1.5 and 1.6.
14 Between 1994-1998, capital raised through the primary market declined (due to recessionary conditions in the economy) as shown in Table 1.5. But it showed an increase in 1998-99. The total amount o f capital raised during 1998-99 horn the primary capital market was Rs. 55.8 bn., which is 22.24 % higher than the amount o f Rs. 45.7 bn. mobilised in 1997-98. While the amount o f capital mobilised increased during 1998-99, the number o f firms entering the market declined substantially from 111 in 1997-98 to 58 in 1998-99. This indicates that companies on an average made issues o f a size considerably larger than that in the previous year. In 1997-98, the proportion o f rights issues in total issues increased by more than three times over 1996-97. The over-pricing o f issues following the introduction o f free pricing and decline in the market prices o f those same issues had an adverse impact on the primary market (SEBI Annual Report, 1998). At the same time, the number o f IPOs has also declined. The proportion o f IPOs in total issues has
Table 1.5: Capital Raised in the Indian Primary Market.
Year Book value o f the Issues (Rs. Bn.) No. o f Issues (Public and Rights
Issues) 1994-95 276.32 1692 1995-96 208.03 1725 1996-97 142.76 882 1997-98 45.70 111 1998-99 55.86 58
Source: SEBI Annual Report, 1999.
Table 1.6: Proportion o f Initial Public Offerings (IPOs) in Indian Public Issues.
Year No. o f IPOs Book value o f the Issues (Rs. Bn.)
1996-97 715 59.50
1997-98 52 10.47
1998-99 18 4.04
Source: SEBI Annual Report, 1999.
On turnover, BSE is ranked 27th o f the world markets. This turnover ratio is a measure o f liquidity. All the markets which are similar to BSE in terms o f market capitalisation tend to lack liquidity. W hen ranked by tu rn o v e r ratios their relative position is lower than when compared to their rankings based on market capitalisation (Tables —1.3 and 1.4). Given the large number o f companies listed on the BSE, a low turnover ratio can be obviously attributed to lack o f liquidity in the market as a whole and almost complete illiquidity for over 85% o f listed scrips i.e., despite a large number o f stocks listed, there is no trading in m ost o f these stocks at all.
Domestic institutional investors hold about one-third o f the m arket’s capital, while management insiders and individual investors hold a third each. Effectively the bulk o f daily trading is restricted to institutional investors both domestic and foreign. In the case o f smaller companies (which make the bulk o f listed companies in BSE), family members usually hold over 50% o f the firm's issued shares. W ith the remainder being held by domestic FIs, and insurance companies as well as by banks (mainly as collateral), only a small proportion (usually less than 20%) o f total shares issued are available for
also declined from 81.07% in 1996-97 to 31.03% in 1998-99. SEBI claims that the strict norms it introduced for all public offers since 1995-96 has helped ensure improvement in quality o f firms entering the stock market (SEBI Annual Report, 1998).
21
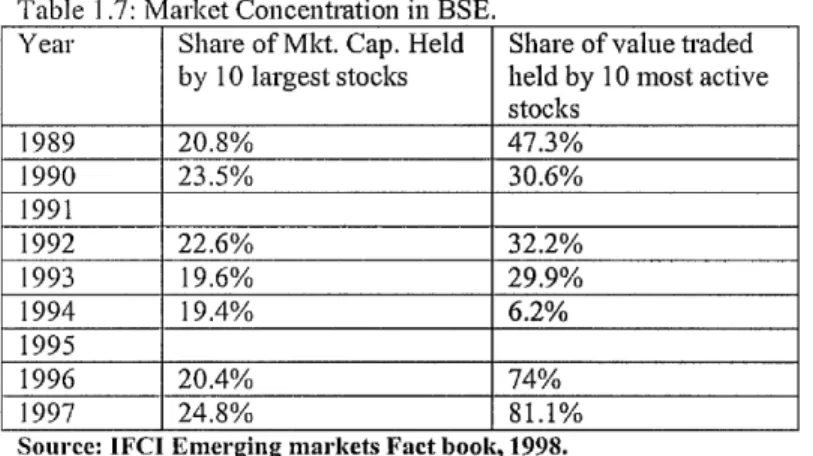
public trading. According to Sarkar et al. (1999), in the private stand-alone companies, the equity holding by directors and relatives is highest (22% of the total stake). Table 1.7 shows the market concentration in the BSE. A majority o f the smaller companies have extremely low turnover ratios, given that they face thin trading.
Table 1.7: Market Concentration in BSE. Year Share o f Mkt. Cap. Held
by 10 largest stocks
Share o f value traded held by 10 most active stocks 1989 20.8% 47.3% 1990 23.5% 30.6% 1991 1992 22.6% 32.2% 1993 19.6% 29.9% 1994 19.4% 6.2% 1995 1996 20.4% 74% 1997 24.8% 81.1%
Source: IFCI Emerging markets Fact book, 1998.
As observed earlier turnover on Indian stock exchanges has been increasing significantly since 1994. hi 1994, the government introduced competition by creating a new National Stock Exchange (NSE) that offered superior technology for electronic trading and computer links to brokers in 40 cities around the country. A t present the N S E ’s average daily trading volume is almost three times higher than that o f BSE, which introduced electronic technology belatedly in response to competition from NSE, which has led to increased liquidity and efficiency nationwide. In 1995 the government also created India’s first depository,15 and has moved progressively toward dematerialisation and electronic transfer o f scrip ownership. Those measures have im proved dramatically an outmoded share trading system (Barger, 1998) that was subject to considerable abuse by the broker community. After 1996-97, increase in turnover has been facilitated and supported by the screen based trading systems o f NSE and the expansion o f B S E ’s
Line Trading System (BOLT)16 facility across the country. Table 1.8 looks at the market capitalisation and the turnover ratios o f the BSE from 1980-98.
Table 1.8: Market Capitalisation, N o. o f Domestic Companies listed and Turnover ratio in BSE. Year No. o f Companies
listed on the stock exchange Market Capitalisation (US $ Millions) Value Traded (US $ Millions) Turnover Ratio (%) 1981 1031 6649 6693 108.3 1982 1106 7058 5030 74 1983 1151 7178 2377 33.5 1984 1295 6370 3916 57.6 1985 1529 14364 4959 48.3 1986 1912 13588 10781 77 1987 2095 17057 6743 43.9 1988 2240 23623 12241 59.2 1989 2407 27316 17362 68.8 1990 2435 38567 21918 65.9 1991 2556 47730 24295 56.8 1992 2781 65119 20597 37 1993 3263 97976 21879 22.4 1994 4413 127571 27290 21.4 1995 5389 122199 13738 11.24 19 96 5999 122605 26599 21.6 1997 5843 128466 53954 42 1998 5860 105188 64498 61.3
Source: IFCI Emerging Markets Fact book, various issues.
No doubt, low turnover partly explains the low average m arket capitalisation o f scrips on the BSE. A low proportion o f effectively tradable shares contributes to low turnover in the stock market. Given the capital gains and transfer, tax structures and other transactions costs, the lack o f liquidity in BSE can be attributed to both the capital structure o f firms and their ownership structure. Analysing the debt and equity (holding) pattern in Indian corporates and the inherent conflicts o f interest that arise is important for understanding the fundamental causes o f low market capitalised companies listed on the BSE.
i6 BOLT was set up to achieve the following goals: To increase market transparency,
To enhance market quality through improved liquidity, by increasing quote continuity and market depth, To reduce settlement risks due to open trades, by elimination o f mismatches,
To provide management information systems (MIS),
23
1.3 OBJECTIVE OF THE THESIS:
This thesis attempts to investigate and explain the causes o f low average market capitalisation o f firms listed on BSE. The main theoretical framework for the thesis is derived from the agency costs approach, initiated by Jensen and M eckling (1976).
The thesis highlights the contrast between the rhetoric surrounding the supposed attributes o f market m echanism s17 (disciplinary and efficient allocation o f resources) and their apparent inability to induce effective corporate governance and performance through m arket discipline especially in an emerging market like India.
Firms try to maintain a desired capital structure (or debt-equity ratio) according to the nature o f their productive activities, although the ratio is maintained more in the boolc-value terms than in market value proportions.18 W hen sales, profits or assets increase or taxes change, the impact on the financial structure o f a firm emerges through changes in the book value o f its debt and equity. These changes in turn lead to changes in public issues on capital markets by firms by way o f equity issues and/or debt from the financial intermediaries. M arket pricing and valuation of such issues is reflected in the premia or discounts obtained over par in the pricing o f issues and in the case o f debt their coupon returns (with the interplay between price and coupon determining yield). Thus changes in the above mentioned variables, i.e. sales, profits, assets, costs, taxes, affect the
and to support nation-wide expansion o f market activity (SEBI Annual Report, 1997).
17 Capital markets allocate scarce capital among competing users and uses. They provide signals to guide investors in making investment decisions and provide a mechanism by which capital markets enforce performance and governance disciplines.
18 Financial ratios related to the firm make use o f book values rather than market values. The market value o f the equity o f a company finally determines whether debt holders get their m oney back. But analysts do not look at the face amount o f the debt as a proportion o f the total market value o f debt and equity because market values are often not readily available and are subject to volatility. The market value includes the market’s perceptions (subject to rapid change) o f value o f intangible assets generated by R&D, advertising, staff training, and so on. These assets are not readily saleable, and if the company falls on hard times, the value o f these assets may disappear altogether (Myers and Brealey, 1997).
book value proportions o f debt and equity. The resulting market value o f equity19 or the market traded debt o f a corporation acts as a mediating influence on the cost o f effecting changes in the book values o f debt and equity. LCCs incur higher costs in bringing about changes in the book values o f their debt and equity.
Companies in emerging markets with low levels o f development and inherent market imperfections, depend much more 011 internal, rather than external or market
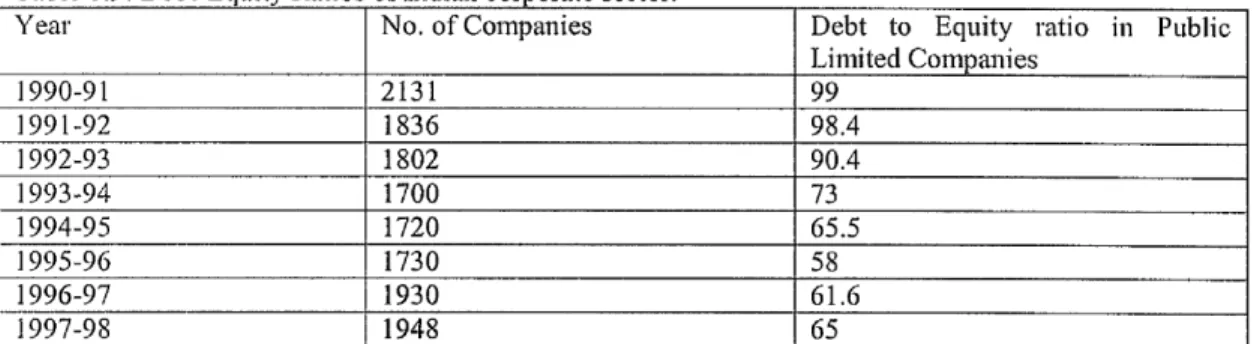
finance. As King (1977) observes, firms in countries where stock markets are poorly developed are forced to rely more extensively on bank and non-market debt as an informal credit, depending on the level o f development o f the domestic credit market. But the number o f firms listed on the stock markets in India suggests a seemingly paradoxical situation, with large num ber o f companies financing a significant part o f their investment through equity markets,20 for w hom dependence on debt as a source o f finance is not preferable compared to equity as shown in the table 1.9.
Table 1.9: Debt-Equity Ratios o f Indian corporate sector.
Year No. o f Companies Debt to Equity ratio in Public Limited Companies 1990-91 2131 99 1991-92 1836 98.4 1992-93 1802 90.4 1993-94 1700 73 1994-95 1720 65.5 1995-96 1730 58 1996-97 1930 61.6 1997-98 1948 65
Source: RBI Finance and Currency Bulletin, Various Issues
19 “Financial price data provide a window into the firm through the market's valuation o f the securities issued by the firm and the changes in these values over time. Accounting data, 011 the other hand, provide
information on the resources used by the firms. Thus, comparing accounting data and financial valuation data offers the opportunity to examine performance, the difference between inputs on one hand and output on the other” (Lindenberg and Ross, 1981).
20 Prior to 1992 Indian firms faced bureaucratic hurdles in respect to raising new equity finance as well like, companies making new issues, bonus issues, pricing the issues had to seek the permission o f Controller o f Capital Issues (CCI), as stock markets in general, were under the direct control o f Ministry o f Finance, Government o f India. Many o f the small and medium firms faced problems o f inadequate access to the capital markets.
25
Floating external equity is often regarded by corporate managers especially o f
• 91 ■
family owned ad new firms as leading to loss o f control, which m ost managers try to avoid. Companies w ith low market capitalisation compared to the book value o f their net asset become an easy target for acquisitions and hostile takeovers.22 In addition to loss o f control and vulnerability to takeovers, the tax rate23 in India on widely held domestic companies and closely held domestic companies is around 40% and 50% respectively. Because o f the deductibility o f interest payments, Modigliani and M iller (1958) argue that the net gain from debt financing relative to equity financing increases w ith the film ’s tax rate.
21 This is because public issues increase the number o f outside shareholders who becom e residual claimants on the net assests o f the firm. Outside shareholders could then act as monitors to the managerial activity. Private stand-alone companies with higher insider ownership have lower agency costs o f equity and higher agency costs o f debt because the incentives o f managers are more closely aligned with owners than with creditors [Lang-Friend (1988) and Friend-Hasbrouclc (1987)]. Managers are envisaged as pushing investment programs to a point where their marginal rate o f return is below the level that would maximise stockholder welfare, in other words managers indulge in over investment. For these purposes internal finance is particularly favoured since they are the most accessible part o f the capital market and most amenable to managerial desires for growth. In other words, professional managers avoid relying on the external finance because it would subject them to the discipline o f the external capital market (Cherian,
1996).
22
A low Tobin's Q can be a reliable indicator o f a declining firm as it measures the low valuation o f a film ’s tangible assets in their current use. It may pay to sell off assets when Q is low because those assets may have a higher value in another firm or sector. If a low Q reflects a low valuation o f physical assets relative to their potential, then acquiring the firm will be a cost-effective way to buy and redeploy its physical capital. A related measure o f profitability relative to the value o f physical assets is the deviation o f a film ’s Q from the average Q for its industry. A low Tobin's Q can also result from well-managed but invaluable assets. For example, if the targets for hostile takeovers invested a long time ago when their industry was growing, but in the current period if the fortunes o f the industry have turned around, they will be stuck with excess capacity. In recent years the corporate sector in India has witnessed many mergers and takeovers (though few have been hostile), yet LCCs have been immune to this mode o f market correction. Despite the increasing frequency o f highly publicised takeover battles in recent times, not many o f the worst managed listed companies in India are vulnerable to hostile takeovers. Such companies are restructured by the Board o f Industrial and Financial Reconstruction (BIFR) and not through the market for corporate control. This is because the promoters have voting control in their hands, facilitated by many regulatory relaxations made in the listing
requirements for companies (Gupta, 1990). Also their shares are heavily owned by FIs and public insurance companies and unit trusts that are disinclined to support hostile takeovers.
23 Corporate taxation for “widely held” domestic companies has been in the range o f 55% in 1975-76 [for income o f more than Rs. 1 Lakh (Rs. 1,00,000)] to 50% in 1988-89. in the early 1990s it ranged between 45-40%. Surcharge is levied on tax at 8% for the accounting year ended march 31, 1990 if taxable income exceeded Rs. 50,000. It is levied at 15% for the accounting year ended march 31, 1991 and thereafter if taxable income exceeds Rs. 75,000 (Source: Price Waterhouse Information Guide; D oing business in India).
High tax rates, limited access to capital markets due to thin trading, loss o f control, vulnerability to takeovers and acquisitions should have pushed firms toward debt financing. But the number o f firms both existing quoted firms and new firms issuing Initial Public Offerings (IPOs), seeking funds from the equity markets has been steadily increasing.
W hy then do (a) the potential tax savings to be generated by increasing debt coupled with (b) the fear o f loss o f control, not lead firms to borrow as m uch as possible instead o f issuing equity on the stock market? The different lines o f argument from the supply side, suggest the following reasons:
• Imperfect or incomplete capital markets;
• Credit rationing24 by public banks and other lending institutions (e.g. FIs),
• Financing decisions considered as information signals25 about the firm ’s credit quality and commercial risk rating and its current/future profitability,
24 “Banks making loans are concerned about the interest rate they receive on the loan, and the riskiness o f the loan. However, the interest rate a bank charges may itself affect the riskiness o f the pool o f loans by either: 1. Sorting potential borrowers (Adverse selection effect) 2. Affecting the actions o f borrowers (incentive effect). Both effects derive directly from the residual imperfect information, which is present in loan markets after banks have evaluated loan applications. When the price (interest rate) affects the nature o f the transaction, it may not also clear the market. .. .It is difficult to identify “good borrowers,” and to do so requires the bank to use a variety o f screening devices. The interest rate, which an individual is willing to pay, may act as one such screening device: those who are willing to pay high interest rates because they perceive their probability o f repaying the loan to be low. As the interest rate rises, the average “riskiness” o f those who borrow increases, possibly lowering the bank’s profits. Similarly, as the interest rate and other terms o f the contract change, the behaviour o f the borrower is likely to change. For instance, raising the interest rate decreases the return on projects, which succeed. In a world with perfect and costless
information, the bank would stipulate precisely all the actions that the borrower could undertake. However, the bank is not able to directly control all the actions o f the borrowers; therefore it formulates the terms o f the loan contract in a manner designed to induce the borrower to take actions, which are in the interest o f the bank, as well as to attract low-risk borrowers. For both these reasons, the expected return by the bank may increase less rapidly than the interest rate and beyond a point may actually decline. The interest rate at which the expected return to the bank is maximised is called the bank-optimal rate r*. The bank would not lend to an individual who offered to pay more than r*. In the bank’s judgement, such a loan is likely to be a worse risk than the average loan at interest rate r*, and the expected return to a loan at an interest rate above r* is actually lower than the expected return to the loans the bank is presently making. Hence, there are no competitive forces leading supply to equal demand, and credit is rationed” (Stiglitz and W eiss, 1983).
27
• Avoiding the hidden costs and implicit taxes (kick-backs) involved in borrowing from public financial institutions and banks,
• Avoiding tying up collateral as well as potential bankruptcy26 costs and
transaction costs involved in reorganisation and, lastly,
• Owner-managers having proclivity to avoid high debt ratios in an attempt to retain
control and protect personal wealth.
The last o f these reasons forms part of the agency approach.27 Agency theory purports to capture the conflict o f interests among various groups (“agents”) with claims to the firm ’s resources, including owner-managers, shareholders, debt holders etc. To analyse the interface between a firm and the capital markets, an understanding o f the conflicts o f interest between these groups was important. This thesis analyses the high proportion o f LCCs 011 the BSE using agency theory as its analytical proposition.
25 The shareholder and the manager have private information regarding the firm's prospects. The asymmetry o f information in capital markets engenders an adverse selection problem. Information asymmetry models argue that as managers know more than investors do about the firm's prospects, dividends reveal some o f that information to the market. It also helps explain the observed reluctance o f managers to change dividends. Thus, dividend-signalling models describe how managers can optimally convey their private information to lesser-informed outside investors (Bessler and N ohel, 1996). Fama and Babiak (1963) find a relation between annual dividends and earnings that is consistent with the view that dividend-paying firms increase their dividends only when management is relatively confident that the higher payments can be maintained. If managers have information about the future and/or current cash flows that investors do not have, investors will interpret a dividend increase as a signal that management anticipates permanently higher cash flows, and a dividend decrease as a signal that management expects permanently lower cash flows. Unexpected changes in dividends provide the market with clues about unexpected changes in earnings, which in turn trigger price movements that look like responses to dividend decisions. Miller and Modigliani (1959) suggest that given information asymmetry investors are likely to interpret a change in dividend rate, as a change in management view o f future profit prospects o f the firm.
26 As debt and firm risk increase, financial distress and bankruptcy become more likely. In a two period model in which the firm invests in the first period and gets its return in the second period, bankruptcy can be defined as the income o f the firm which is less than the fixed obligations to bondholders in an ongoing firm. But a firm can avoid bankruptcy even when its income is less than the obligations o f the firm by borrowing more. A firm is also bankrupt if the value o f its equity is zero or if the value o f its future income streams, assuming it does not go bankrupt in the meantime, is less than the value o f its outstanding debt.
27
Jensen and Meckling (1976) identify three potential value-reducing behaviours, which arise out o f conflicting interests between stockholders and bondholders. Asset substitution occurs when a film invests in riskier, lower-valued projects than originally anticipated by bondholders. Claim dilution results when new debt o f equal or greater priority than original debt is issued. Under investment results when instead o f
Corporate capital structure is determined at least in part by optimisation o f management interests even w hen these interests conflict with shareholders’ interests, hr their empirical study on bond and equity issues, Jung et al. (1996) conclude that their results on corporate security issue choice strongly supports the agency model. Their results are consistent with the role o f agency costs in the new issue decision. A n equity issue allows firms w ith poor investment opportunities to invest in poor projects and/or to reduce the disciplinary role o f debt. Their study finds that firms which issue equity, are o f two types:
a. Finns w ith valuable investment opportunities which seek financing to grow profitably b. Firms, w hich do not possess any valuable investment opportunities.
M ost o f the LCCs w ould belong to the second category (they also don't have debt capacity). Equity in m ost cases is deemed as a non-obl igatory, unrestricted source o f finance.28 Hence, there are few incentives for the firm’s management to align their interests w ith those o f the outside shareholders (in maximising the market value and dividend returns on the com pany’s shares).
Aspects o f corporate monitoring and governance,29 which play a positive role in improving the performance o f a firm, can also be best understood w ithin a principal-agent framework (Sarkar et al., 1999). According to Mayer (1998) there are five channels30
investing in positive net present value projects, a firm pays the debt proceeds to shareholders either as a dividend or a share repurchase. A ll three conflicts impose agency costs on the firm.
28 it increases managerial discretion, which management values. Managerial discretion can take numerous forms; managers may run slack operations, pursue sub-goals that are at variance with corporate purposes, and can engage in self-dealing.
29 Mechanisms o f corporate governance deals with providing managers with proper incentives in labour markets, in order to induce them to work in the interests o f the shareholders and to make them accountable for company performance.
30 a. Managerial incentives, b. Disciplining,
29
through which corporate governance affects performance. These channels are established by structural and institutional factors related to a firm i.e. ownership structure, financial structure, internal control systems, and the legal, political and regulatory environments. This thesis deals with only some aspects o f corporate governance, i.e. through finance and investment (debt and equity), disciplining and restructuring (market for corporate control31 and the role o f financial institutions).
Barua et al. (1994) commenting on the state o f capital market research in India, assert that certain areas such as arbitrage pricing theory, option pricing theory, agency theory and signalling theory are virtually unresearched in the Indian context. The Indian capital m arket has been attracting considerable attention in recent years especially after the financial liberalisation initiated in 1991-92. Against this background, it becomes important to study hitherto unresearched aspects o f finance related to India.
There is a strong case for agency theory to be used as a tool to investigate the behavioural characteristics o f Indian stock markets. The dynamics o f agency conflicts inherent in the firm structure influences all the decisions taken by a firm i.e. debt policy, dividend policy etc. Accordingly, it becomes important to study the impact o f firm ’s financial structure on its outstanding equity. This thesis tries to analyse low average market capitalisation o f the BSE by looking into how owner-manager behaviour
d. Corporate restructuring and e. Instilling commitment and trust.
31 Prior to the economic reforms, regulatory bodies like the Monopolies and Restrictive Trade Practices Act (MRTP) placed several restrictions in the way o f takeovers, mergers, and amalgamations. Banks could not finance takeovers under the regulations o f the Reserve Bank o f India. Currently RBI allows banks to lend against shares only to individual borrowers within a ceiling o f Rs. 100, 000 and stockbrokers against their stock in trade where the ceiling is decided on a case-to-case basis by individual banks. Business houses cannot borrow against shares. The cost o f funds is high at around 23%, including service charges. In 1991, the Government omitted relevant sections and provisions from the MRTP Act. The need for prior approval o f the federal government for M&A activities was abolished. Bhagwati Committee Draft on Takeovers
influences financial decision making i.e. how does decision-making o f owner-managers affect the market value o f outstanding equity and the movement o f its prices.
1.4 ANALYTICAL FRAMEWORK:
A model o f turnover o f the population of firms (through the birth o f new films and death o f existing firms) helps to analyse the incidence o f LCCs on the BSE. High rates o f entry typically coincide with high rates of exit; since one effect o f entry is the displacement o f some o f the older firms by new firms. A common way o f modelling is to assume that entry responds to deviations in expected profits from the cost o f entry,32 which depends on entry barriers. The determinants of birth, growth and death o f firms on the BSE can be summed as follows:
El = f ( P t - C E 0 CEt = g (BEt, CO
W here E is entry, P is expected profits, CE is the cost o f entry, BE are entry barriers, C is cost o f finance.
X t = f ( P t, Gt, BXt, CO
1996 and SEBI Substantial Acquisitions o f Shares and Takeovers Regulations 1994 attempted to ensure that takeovers as a disciplinary mechanism perform the function o f enhancing efficiency o f firms. 32 Firms which want to be listed on BSE have to fulfil the following criteria:
■ Minimum Capital: N ew companies can be listed on the Exchange, if their issued & subscribed equity capital after the public issue, is Rs.100 mil. and above.
■ Minimum Public Offer: As per Rule 19(2) (b) o f the Securities Contracts (Regulation) Rules, 1957, securities o f a company can be listed on a Stock Exchange only when at least 25% o f each class or kind o f securities is offered to the public for subscription.
Whereas companies listed on other Stock Exchanges and seeking listing on these Exchanges are required to fulfil the following criteria:
■ Minimum Issued Equity Capital o f Rs.30 mn. to Rs.l 00 ran.; " Profit track record o f at least three years;
■ Minimum Market Capitalisation o f Rs.200 mn., based on average price o f last six months;
■ Trading for a minimum 50% o f the total trading days during the last six months on any stock exchange;
" Minimum average volume traded per day during the last three complete months should be 500 shares and minimum 5 trades per day;
■ 25% o f the issued capital should be with public (including corporate bodies) and minimum 15 shareholders per Rs. 100,000 o f capital in the public category (BSE Annual Report, 1999).
31
W here X is exit, BX is the exit barrier,33 G includes variables related to the growth34 o f
' i c
the firm and P is profits.
Now assuming that all the new entrants in BSE are LCCs, let Lt be the proportion o f low capitalised firms in BSE at time t. These new firms generally start on a small scale and their access to the capital markets may be limited. Lt can be defined as
Lt = EE t-j-E X t.j
W here EE t-j is summation o f all the factors leading to the entry o f a firm in the low capitalised category o f BSE. EX t -j is the specific exit factors.
EX t _j = Bankruptcy o f LCCs + Involuntary de-listing36 o f LCCs + V oluntary de-listing of LCCs + LCCs reaching medium capitalised and large capitalised com panies’ category through growth + LCCs being taken over or merged.
This thesis concentrates on the last two variables on the RJ-IS o f the above equation. For considering the causes restricting takeovers and internal growth, this chapter looks at the firm level characteristics o f financial policy. The firm-specific characteristics are analysed from the point o f view o f agency theory.37 Some o f the characteristic features o f a typical “Iow-cap” film ’s financial policy were in accordance
33 Exit barriers in India were high, i.e. management was constrained by law to retrench either surplus assets or labour (Venkiteswaran, 1993).
34 Growth in the market value o f a company due to a takeover or a merger. 35 Falling profits over a period o f time would lead to bankruptcy and liquidation.
30 In addition to the market determined routes o f exit, the regulatory body Securities Exchange Board o f India (SEBI) de-lists companies from the stock exchange. Since 1999 BSE has introduced "Z Category” stocks instead o f delisting for companies which do not comply with the provisions o f the Listing
Agreement. De-listing was not a very effective disciplinary option because it was realised that companies, which defaulted on the listing fees wanted to be de-listed in the first instance. This meant that then they would have no obligation towards the Stock exchange or its direct governance and interference. But SEBI does not have any rules as yet to deal with such companies. The number o f companies placed under this group, by the end o f 1999 was 600 (BSE Annual Report, 1999).
37 “The size and scale o f operations o f most listed companies leads to a division between the shareholders, the board and the professional management. In addition to the benefits from specialisation o f function, there are also however, certain costs inherent in the corporate form o f firm organisation. The most