Digital Commons@Becker
Digital Commons@Becker
Open Access Publications2019
Heterogeneity Diffusion Imaging of gliomas: Initial experience and
Heterogeneity Diffusion Imaging of gliomas: Initial experience and
validation
validation
Qing Wang
Gloria J. Guzmán Pérez-Carrillo Maria Rosana Ponisio
Pamela LaMontagne Sonika Dahiya
See next page for additional authors
Daniel S. Marcus, Mikhail Milchenko, Joshua Shimony, Jingxia Liu, Gengsheng Chen, Amber Salter, Parinaz Massoumzadeh, Michelle M. Miller-Thomas, Keith M. Rich, Jonathan McConathy, Tammie L. S. Benzinger, and Yong Wang
Heterogeneity Diffusion Imaging of gliomas:
Initial experience and validation
Qing Wang1☯, Gloria J. Guzma´n Pe´rez-Carrillo2☯, Maria Rosana Ponisio1,
Pamela LaMontagne1, Sonika DahiyaID3, Daniel S. Marcus1, Mikhail Milchenko1, Joshua Shimony1, Jingxia Liu4, Gengsheng Chen1, Amber Salter5,
Parinaz Massoumzadeh1, Michelle M. Miller-Thomas1, Keith M. RichID6, Jonathan McConathy7, Tammie L. S. Benzinger1, Yong Wang1,8
*
1 Department of Radiology, Washington University in St. Louis, St. Louis, Missouri, United States of America, 2 Department of Medical Imaging, Neuroradiology Section, University of Arizona, Tucson, Arizona, United States of America, 3 Department of Pathology and Immunology, Washington University in St. Louis, St. Louis, Missouri, United States of America, 4 Department of Surgery, Washington University in St. Louis, St. Louis, Missouri, United States of America, 5 Department of Biostatistics, Washington University in St. Louis, St. Louis, Missouri, United States of America, 6 Department of Neurosurgery, Washington University in St. Louis, St. Louis, Missouri, United States of America, 7 Department of Radiology, Division of Molecular Imaging and Therapeutics, University of Alabama at Birmingham, Birmingham, Alabama, United States of America, 8 Department of Obstetrics and Gynecology, Washington University in St. Louis, St. Louis, Missouri, United States of America
☯These authors contributed equally to this work.
Abstract
Objectives
Primary brain tumors are composed of tumor cells, neural/glial tissues, edema, and vascula-ture tissue. Conventional MRI has a limited ability to evaluate heterogeneous tumor patholo-gies. We developed a novel diffusion MRI-based method—Heterogeneity Diffusion Imaging (HDI)—to simultaneously detect and characterize multiple tumor pathologies and capillary blood perfusion using a single diffusion MRI scan.
Methods
Seven adult patients with primary brain tumors underwent standard-of-care MRI protocols and HDI protocol before planned surgical resection and/or stereotactic biopsy. Twelve tumor sampling sites were identified using a neuronavigational system and recorded for imaging data quantification. Metrics from both protocols were compared between World Health Organization (WHO) II and III tumor groups. Cerebral blood volume (CBV) derived from dynamic susceptibility contrast (DSC) perfusion imaging was also compared with the HDI-derived perfusion fraction.
Results
The conventional apparent diffusion coefficient did not identify differences between WHO II and III tumor groups. HDI-derived slow hindered diffusion fraction was significantly elevated in the WHO III group as compared with the WHO II group. There was a non-significantly a1111111111 a1111111111 a1111111111 a1111111111 a1111111111 OPEN ACCESS
Citation: Wang Q, Pe´rez-Carrillo GJG, Ponisio MR,
LaMontagne P, Dahiya S, Marcus DS, et al. (2019) Heterogeneity Diffusion Imaging of gliomas: Initial experience and validation. PLoS ONE 14(11): e0225093.https://doi.org/10.1371/journal. pone.0225093
Editor: Ulas Bagci, University of Central Florida
(UCF), UNITED STATES
Received: May 3, 2019 Accepted: October 29, 2019 Published: November 14, 2019
Copyright:©2019 Wang et al. This is an open access article distributed under the terms of the
Creative Commons Attribution License, which permits unrestricted use, distribution, and reproduction in any medium, provided the original author and source are credited.
Data Availability Statement: The dataset contain
the patients’ clinical information which will compromise confidentiality. At Washington University in St. Louis, human subject approvals allow open data sharing of coded data with qualified investigators who would be willing to guarantee the confidentiality of the data. We have established a simple process for sharing the source imaging data, which has been successfully employed for many other studies. Please seewww. oasis-brains.orgfor an example. Data of this study has been stored in the online archive system CNDA
increasing trend of HDI-derived tumor cellularity fraction in the WHO III group, and both HDI-derived perfusion fraction and DSC-derived CBV were found to be significantly higher in the WHO III group. Both HDI-derived perfusion fraction and slow hindered diffusion frac-tion strongly correlated with DSC-derived CBV. Neither HDI-derived cellularity fracfrac-tion nor HDI-derived fast hindered diffusion fraction correlated with DSC-derived CBV.
Conclusions
Conventional apparent diffusion coefficient, which measures averaged pathology properties of brain tumors, has compromised accuracy and specificity. HDI holds great promise to accurately separate and quantify the tumor cell fraction, the tumor cell packing density, edema, and capillary blood perfusion, thereby leading to an improved microenvironment characterization of primary brain tumors. Larger studies will further establish HDI’s clinical value and use for facilitating biopsy planning, treatment evaluation, and noninvasive tumor grading.
Introduction
Gliomas account for the majority of primary brain tumors in adults; they represent 26.5% of primary brain tumors and 80.7% of malignant brain tumors [1]. Typically, malignant gliomas contain heterogeneous pathologies that reflect regional diversity in tumor cell proliferation [2], immune infiltration, tumor vessel density, necrosis, and cystic degeneration. This hetero-geneity makes clinical diagnosis and management very challenging.
Current standard-of-care imaging for newly diagnosed patients with brain tumors includes anatomical magnetic resonance imaging (MRI) with and without contrast to identify general characteristic features of the tumor, including its location, size, and extent. However, anatomi-cal MRI techniques alone are limited for the evaluation of tumor heterogeneity, especially in tumors that demonstrate little or no enhancement. Advanced MRI techniques such as diffu-sion MRI [3,4], MR spectroscopy [5,6] and MR perfusion [7] provide more pathophysiologic information, and they have demonstrated the potential to characterize tumor types and to dif-ferentiate recurrent tumor from pseudo progression. Among these advanced techniques, diffu-sion MRI holds a unique position due to its sensitivity when probing the microenvironment of biological tissues at a cellular level. Clinically, apparent diffusion coefficient (ADC) maps have been used to grade primary brain tumors [8,9], to define tumor cellularity [10], and to assess brain tumor response to therapy [11,12]. However, conventional ADC measures average the diffusivity of multiple pathologies coexisting within each tumor voxel, which significantly lim-its the accuracy and specificity of this method for characterizing neoplastic pathologies.
Perfusion MRI provides important diagnostic information about microvascularity within brain tumors, and it can be used to differentiate tumor types and tumor grades [7,13]. Quanti-tative and physiologic information provided by diffusion and perfusion MRI are complimen-tary, and the integration of these two techniques could significantly improve diagnostic confidence [14]. However, imaging properties examined by different imaging techniques may suffer mislocalization [15], which could increase registration errors and decrease diagnostic accuracy. The accurate and simultaneous imaging and quantification of tumor pathological heterogeneity and vascularity—in one session—will be highly favored to reduce registration error, thereby improving clinical diagnosis, treatment, and management.
(cnda.wustl.edu). Data access requests should be sent to Christine Pulizos ([email protected]).
Funding: This study was supported, in part, by
grants from the National Institutes of Health (NIH)/ National Institute of Neurological Disorders and Stroke (R01NS066905; PI Marcus); the National Multiple Sclerosis Society (RG5265 A1; PI Wang); the Bright Focus Foundation (A2017330S; PI Wang); the NIH/National Institute of Aging (R01AG053548; PIs Benzinger/Wang); the NIH/ National Institute of Childhood Health and Human Development (R01HD094381; PIs Wang/Cahill); the Siteman Cancer Center and Barnes-Jewish Hospital Foundation; the Washington University Institute of Clinical and Translational Sciences; the Washington University Neuroimage lab innovation funds; and the National Center for Advancing Translational Sciences (UL1 TR000448). This work used the services of the imaging facility informatics platform supported by NIH grant 5P30NS048056 (PI Marcus). The funders had no role in study design, data collection and analysis, decision to publish or preparation of the manuscript.
Competing interests: Drs. Yong Wang and Qing
Wang are the founders of InnoVoxel LLC, a startup company aiming to validate and clinically translate the diffusion basis spectrum imaging technique. A USA patent related to this technology has been filed (PCT/US2017/049440). Outside of this work, Dr. Tammie Benzinger discloses her relationships with Biogen, Roche, Jaansen, Eli Lilly and Avid Radiopharmaceuticals. Dr. Yong Wang discloses his relationship with Medtronic. The other authors report no conflicts of interest concerning the materials or methods used in this study or the findings specified in this paper. The financial disclosure does not alter our adherence to PLOS ONE policies on sharing data and materials.
Abbreviations: ADC, Apparent diffusion coefficient;
CBV, cerebral blood volume; CF, cellularity fraction; CONDR, Comprehensive Neuro-Oncology Data Repository; DBSI, diffusion basis spectrum imaging; DSC, dynamic susceptibility contrast; DTI, diffusion tensor imaging; DWI, diffusion-weighted imaging; fHF, fast hindered diffusion fraction; FLAIR, fluid-attenuated inversion recovery; HDI, Heterogeneity Diffusion Imaging; IVIM, intravoxel incoherent motion; MGA, Multimodal Glioma Analysis; MRI, magnetic resonance imaging; mROI, manual region of interest; PET, positron emission tomography; PF, perfusion fraction; ROI, region of interest; sHF, slow hindered diffusion fraction; T1W, T1-weighted; T2W, T2-weighted; TE,
echo time; TR, repetition time; tsROI, tissue sampling region of interest; WHO, World Health Organization.
In this article, we present and examine a novel diffusion MRI technique called Heterogene-ity Diffusion Imaging(HDI), which is capable of characterizing heterogeneous tumor composi-tion and microvascularity simultaneously from a single clinical diffusion MRI scan. HDI employs a multiple diffusion compartment model, which was developed based on diffusion basis spectrum imaging (DBSI) [16,17]. By modeling the confounding effects of anatomical complexities and neuropathologies, this approach is able to disentangle the heterogeneous pathological components that are mixed in one imaging voxel [16–20]. In the current study, HDI was employed to quantify tumor cellularity, slow versus fast hindered diffusion fraction, and perfusion effect in each tumor voxel. We hypothesized that HDI would be more sensitive for the characterization of gliomas’ heterogeneous microenvironments as compared with con-ventional ADC.
Materials and methods
Patient selection
This prospective single-center pilot study was approved by the Washington University in St. Louis Institutional Review Board. Seven adults with primary brain tumors were recruited from the Washington University School of Medicine between 2015 and 2016. They underwent the care imaging protocol and HDI diffusion MRI before planned standard-of-care surgical resection and/or stereotactic biopsy. The study was carried out in accordance with the guidelines of the institutional review board of the Washington University Human Research Protection Office. Written informed consent was obtained from all participants. The age range, patient tumor type, and tumor grade are summarized inTable 1. There were four female and three male subjects in this study. Areas of tumor sampling were identified intrao-peratively using the Stealth neuronavigational system (Medtronic, Minneapolis, MN, USA); the location and spatial coordinates of tissue sampling sites were recorded to align with HDI results. Each subject had at least one recorded tissue sampling site. Twelve tumor samples were prepared for this study. The entire HDI analysis was performed blinded to all other data (i.e., clinical data and information about patient surgeries and outcomes).
MRI data acquisition
MRI scans were performed on a 3-Tesla positron emission tomography (PET)/MRI system, the Siemens Biograph mMR (Siemens Health Care, Erlangen, Germany). MR images were acquired via the Comprehensive Neuro-Oncology Data Repository (CONDR) imaging proto-col used for brain tumors [21]. The protocol included pre-gadolinium and post-gadolinium T1-weighted (T1W) imaging (TR = 18 ms, TE = 4.38 ms, in-plane resolution = 1.0×1.0 mm2,
Table 1. Characteristics of patients and tumor grades detected by biopsy.
Patient No. Age Range (years) Tumor Pathology Tumor Grade IDH Mutant
S1 40s Oligodendroglioma WHO III Yes
S3 60s Oligodendroglioma WHO II Yes
S4 30s Oligodendroglioma WHO II Yes
S6 30s Anaplastic astrocytoma WHO III Yes
S7 30s Astrocytoma WHO II Yes
S8 30s Oligodendroglioma WHO II Yes
S9 40s Oligodendroglioma WHO III Yes
IDH, Isocitrate dehydrogenase; WHO, World Health Organization.
slice thickness = 1.0 mm); magnetization-prepared rapidly acquired gradient echo (TR = 2300 ms, TE = 2.95 ms, TI = 900 ms, in-plane resolution = 1.0×1.0 mm2, slice thickness = 1.0 mm); dynamic susceptibility contrast (DSC) perfusion-weighted imaging (TR = 1930 ms, TE = 36 ms, in-plane resolution = 2.2×2.2 mm2, slice thickness = 5.0 mm); T2-weighted (T2W)
fluid-attenuated inversion recovery (FLAIR) (TR = 8500 ms, TE = 133 ms, flip angle = 130 degrees, in-plane resolution = 0.9×0.9 mm2, slice thickness = 5.0 mm); and standard diffusion tensor imaging (DTI) (TR = 9000 ms, TE = 91 ms, in-plane resolution = 2.2×2.2 mm2, slice thick-ness = 3.0 mm). Clinical DTI scans were acquired using a 12-direction gradient scheme with a maximumbvalue of 1000 s/mm2.
We also designed and incorporated a diffusion scheme for HDI data acquisition that was used in addition to the clinical DTI scan. The new diffusion protocol included 74 diffusion directions distributed uniformly in the three-dimensional space, with 74 differentbvalues; it was administered across four separate sessions to improve patient tolerance. Each diffusion gradient had a uniquebvalue, and all of thebvalues were uniformly distributed between 0 and 2000 s/mm2. The maximumbvalue for each session was 2000 s/mm2. The imaging parameters were as follows: TR = 9500 ms; TE = 93 ms; in-plane resolution = 2.0×2.0 mm2; and slice thickness = 2.0 mm.
MRI image processing
MRI preprocessing. For each individual subject, all MRI sequences were coregistered to a target post-contrast T1W image using the Multimodal Glioma Analysis (MGA) pipeline [22].
Each subject’s T1W image was registered to a T1W atlas template image, and other T1W and
T2W sequences were coregistered with the subject’s T1W target image. T1W!T1W
registra-tion used the maximizaregistra-tion of spatial correlaregistra-tion [23], whereas cross-modal registration (e.g., T2W!T1W) used the alignment of intensity gradients [24]. Perfusion and diffusion
parame-ter maps were transformed to the T1W target space using a transformation matrix obtained
from coregistering respective sequences. The coregistration quality was verified using built-in MGA quality control metrics.
Diffusion and perfusion processing. After the acquisition and registration steps were completed, each subject’s raw diffusion and perfusion data were processed. The MGA pipeline was used for diffusion and perfusion processing. MGA precedes perfusion modeling by cor-recting signal intensity across slices and registering all frames to a middle time frame. Perfu-sion modeling is initialized by the automatic estimation of a local arterial input function and the selection of a convolution/deconvolution method. The arterial input function is defined using the Bayesian tissue model [25]. Diffusion data were processed based on the standard DTI model [26]. With the use of these methods, MGA computed the cerebral blood volume (CBV), mean transit time, and cerebral blood flow maps for the DSC scans. For diffusion-weighted scans, the ADC was computed.
HDI processing. Diffusion data acquired with the use of our new diffusion protocol were analyzed using the HDI method. HDI was developed based on the multiple tensor formula-tions used in the DBSI model [16,17]. Briefly, HDI modeled the diffusion-weighted signal from each imaging voxel using a combination of anisotropic and isotropic tensor components, as described by Eq (1). Each of the tensor components is described as a standard diffusion ten-sor formulation in the diagonal coordinate system [27]:
Sk ¼ RNAniso i¼1 fie jb!kj�λ⏊ ie jbk ! j�ðλki λ⏊ iÞ�cos2ψikþRb afðDÞe jb!kjDdD ðk¼1;2;. . .;KÞ ½1�
In Eq (1),|bk|is thebvalue of thekthdiffusion gradient (k= 1, 2,. . ., K).Skis the measured
diffusion-weighted signal that corresponds with thekthdiffusion gradient. HDI anisotropic components (i.e., the first term on the right side of Eq (1)) were used to model the complex neuronal structures invaded by tumor.NAnisois the number of anisotropic tensors in the
imag-ing voxel;ψikis the angle between thekthdiffusion gradient and the principal direction of the
ithanisotropic tensor;λ||_iandλ⏊_iare the axial and radial diffusivities, respectively, of theith
anisotropic tensor; andfiis the signal intensity fraction for theithanisotropic tensor. The HDI
isotropic spectrum (i.e., the second term on the right side of Eq (1)) was divided into several nonoverlapping windows on the basis of previously published reports of ADC ranges for dif-ferent tumor stages [8,9], andaandbare the low (0μm2/ms) and high (40μm2/ms) diffusivity limits, respectively, for the isotropic diffusion spectrumf(D). The number of anisotropic and isotropic diffusion components and the signal intensity fractions that correspond with all dif-fusion components are the key parameters to be solved. The unavoidable measurement and modeling noise will make the direct solution of Eq (1) unstable due to its ill-posed nature [16,
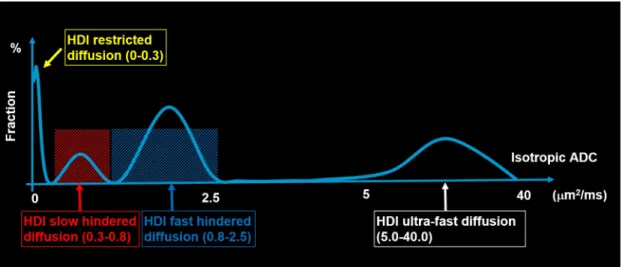
17]. A regularization technique that incorporated the non-negativity of the solution was employed previously in DBSI to stabilize the solution [16,17], and the same regularization technique was employed in this work. Specifically, isotropic diffusion components with diffu-sivity between 0 and 0.3μm2/ms were associated with cellularities [16,17], and those that ran-ged between 0.3 and 0.8μm2/ms were associated with the slow extracellular diffusion of water trapped between tumor cells, thereby reflecting the packing density of the tumor cells. The iso-tropic diffusion components with diffusivity that ranged between 0.8 and 2.5μm2/ms were associated with fast extracellular water diffusion, thereby reflecting edema. HDI also acquired diffusion-weighted images with smallbvalues to capture the ultrafast isotropic diffusion between 5 and 40μm2/ms. This ultrafast diffusion has been previously described as the intra-voxel incoherent motion (IVIM) effect and associated with capillary blood perfusion [28]. Within each imaging voxel for each tumor, the following HDI-derived metrics were quanti-fied: cellularity fraction (CF), slow hindered diffusion fraction (sHF), fast hindered diffusion
Fig 1. Schematic figure of the isotropic spectrum signals from Heterogeneity Diffusion Imaging. Isotropic diffusivity is used to
define each pathological component within a brain tumor. The isotropic diffusivity cutoffs for each of the pathological components were selected from previous diffusion magnetic resonance imaging studies of brain tumors. Specifically, the isotropic diffusion
components with diffusivity that ranged between 0.3 and 0.8μm2/ms were associated with the dense packing of tumor cells. The
components with diffusivity that ranged between 0.8 and 2.5μm2/ms were associated with extracellular water edema. The
components with diffusivity that ranged between 5 and 40μm2/ms were associated with capillary blood perfusion within tumors.
fraction (fHF), and perfusion fraction (PF). The detailed partition of the isotropic spectrum by HDI is shown inFig 1.
Surgical treatment
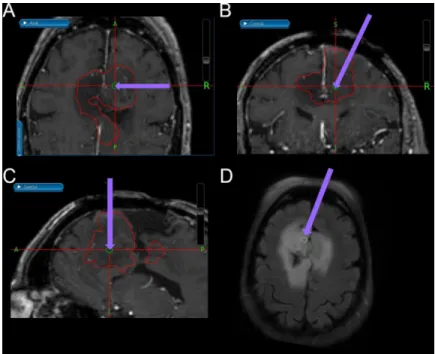
After the MRI, patients underwent stereotactic biopsy followed by partial or complete resec-tion. For each patient, at least one tumor sample was obtained with a stereotactic screen cap-ture taken with the Stealth station. The neuronavigation-guided T1W images of the biopsy
tissue-sampling sites were shown on axial, coronal, and sagittal views (Fig 2). T1W
contrast-enhanced, T2W, and FLAIR images were co-registered by MGA and loaded into the 3D Slicer
software platform (http://www.slicer.org) [29] to produce 5-mm diameter spheres that were centered at each surgical tumor sampling site.
Regions of interest and statistical analysis
Volumetric tumor regions of interest (ROIs) were drawn manually from the FLAIR images. All manual regions of interest (mROIs) were approved by a board-certified neuroradiologist (G.G.). HDI model analysis was performed on the selected mROIs. The ROIs at the tissue sam-pling sites (tsROIs) were also colocalized on HDI images to quantify the HDI findings. A two-samplet-test was performed to compare ADC, CBV, and HDI metrics between the World Health Organization (WHO) II and III tumor groups at tsROIs. The average HDI-derived PF was correlated with the DSC perfusion MRI-derived CBV index. The Pearson correlation coef-ficient was used to evaluate the association between CBV- and HDI-derived metrics.Pvalues of less than .05 were considered significant. Statistical analysis was performed using SAS 9.4 software (SAS Institute Inc., Cary, NC, USA).
Fig 2. Neuronavigation-guided anatomic images of biopsy tissue sampling sites. Neuronavigation-guided
T1-weighted images of the biopsy tissue sampling site at (A) axial, (B) coronal, and (C) sagittal views. (D) The tissue sampling site is labeled on the T2-weighted fluid attentuation inversion recovery image. Purple arrows indicate the passive biopsy needle.
Results
In all patients, HDI metrics demonstrated heterogeneous spatial distributions within tumors.
Fig 3shows a representative case from the low-grade tumor group for a woman in her 70s who had been diagnosed with WHO grade II oligodendroglioma. The subject underwent stan-dard-of-care imaging and HDI scanning. The T1W post-contrast MRI demonstrated
decreased signal intensity in the tumor region (Fig 3A). Elevated FLAIR signal intensity (Fig 3B) and increased ADC (Fig 3C) were also found in the tumor region. Elevated cellularity frac-tion was found in the HDI-CF map, and the cellularity distribufrac-tion was heterogeneous within the tumor (Fig 3E). No increased hindered diffusion fraction was identified in the HDI-sHF map (Fig 3F). An elevated hindered diffusion fraction was found in the HDI-fHF map (Fig 3G). A lack of elevated perfusion based on the CBV (Fig 3D) and HDI-PF (Fig 3H) maps was observed in this patient.
Another representative case for the high-grade tumor group is shown inFig 4for a man in his 50s who was diagnosed with WHO grade III oligodendroglioma. Representative MRI images of this patient are shown in the figure. T1W post-contrast MRI demonstrated decreased
signal intensity in the tumor (Fig 4A). Elevated signal intensity (Fig 4B) and increased ADC (Fig 4C) were also found in the tumor. Elevated cellularity fraction was found in the HDI-CF map, and the cellularity distribution was heterogeneous within the tumor (Fig 4E). Elevated sHF (Fig 4F) and fHF (Fig 4G) were observed in this patient. Elevated perfusion based on the CBV (Fig 4D) and HDI-PF (Fig 4H) maps was found in the high-grade brain tumor lesion.
Fig 3. Imaging from a woman in her 70s diagnosed with World Health Organization grade II recurrent oligodendroglioma. (A) The T1-weighted post-contrast image shows a lesion with decreased signal intensity. (B) The
fluid-attenuated inversion recovery image and (C) the diffusion magnetic resonance imaging-derived apparent diffusion coefficient show a lesion with an increased signal. (D) The dynamic susceptibility contrast-derived cerebral blood volume map and the Heterogeneity Diffusion Imaging-derived (E) cellularity fraction, (F) slow hindered diffusion fraction, (G) fast hindered diffusion fraction, and (H) perfusion fraction maps were generated on manually defined tumor regions and overlaid on the fluid-attenuated inversion recovery image. No elevated cerebral blood volume and Heterogeneity Diffusion Imaging-derived slow hindered diffusion fraction and perfusion fraction are shown in the tumor region. The elevated Heterogeneity Diffusion Imaging-derived cellularity fraction and fast hindered diffusion fraction are shown in the tumor region.
Fig 4. Imaging from a man in his 50s diagnosed with World Health Organization grade III oligodendroglioma.
(A) The T1-weighted post-contrast image shows a lesion with decreased signal intensity. (B) The fluid-attenuated inversion recovery image and (C) the diffusion magnetic resonance imaging-derived apparent diffusion coefficient show a lesion with an increased signal. (D) The dynamic susceptibility contrast-derived cerebral blood volume map and the Heterogeneity Diffusion Imaging-derived (E) cellularity fraction, (F) slow hindered diffusion fraction, (G) fast hindered diffusion fraction, and (H) perfusion fraction maps were generated on manually defined tumor regions of interest and overlaid on the fluid-attenuated inversion recovery image. The elevated cerebral blood volume and Heterogeneity Diffusion Imaging-derived cellularity fraction, slow hindered diffusion fraction, fast hindered diffusion fraction, and perfusion fraction are shown in the tumor region.
https://doi.org/10.1371/journal.pone.0225093.g004
Fig 5. Boxplots of imaging metrics. There is no group significant difference in (A) apparent diffusion coefficient or
(B) Heterogeneity Diffusion Imaging (HDI)-derived cellularity fraction between the World Health Organization (WHO) II and III groups. (C) The HDI-derived slow hindered diffusion fraction is significantly higher in the WHO III group as compared with the WHO II group. (D) There is no group significant difference in HDI-derived fast hindered diffusion fraction between the WHO II and III groups. (E) The cerebral blood volume is significantly higher in the WHO III group as compared with the WHO II group. (F) The HDI-derived perfusion fraction is significantly higher
in the WHO III group as compared with the WHO II group. Boxes indicate 25thto 75thpercentiles, and thin lines
indicate 5thand 95thpercentiles.�,P<.05.
Imaging metrics including ADC, CBV, and HDI-derived indices were compared between the WHO II and III groups at the tissue sampling sites, and details are shown inFig 5. No group significant difference was found in ADC between the WHO II and III groups (Fig 5A). The increasing trend of HDI-derived CF was observed in the WHO III group (Fig 5B). The HDI-derived sHF was significantly elevated in the WHO III group as compared with the WHO II group (Fig 5C). HDI-fHF was not significantly different between the WHO II and III groups (Fig 5D). The CBV generated from DSC perfusion imaging was statistically signifi-cantly higher in the WHO III group as compared with the WHO II group (Fig 5E). Similar to the CBV metrics, the HDI-derived perfusion index (PF) was statistically significantly higher in the WHO III group as compared with the WHO II group (Fig 5F).
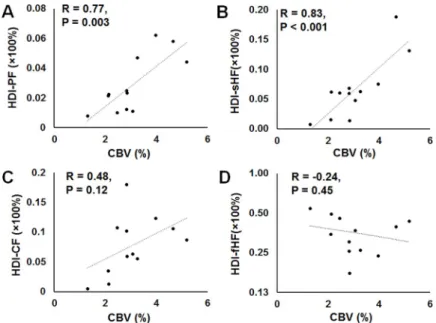
The correlation coefficients between the DSC perfusion imaging and HDI metrics were evaluated, as shown inFig 6. A statistically significant positive correlation was seen between CBV and HDI-derived PF (Pearson’sr= 0.77,P= .003) (Fig 6A). A significant positive correla-tion between CBV and HDI-sHF (Fig 6B) was also noted (Pearson’sr= 0.83,P<.001). CBV was not correlated with HDI-CF or HDI-fHF (Fig 6C and 6D).
Discussion
Tumor heterogeneity is ubiquitous, especially in malignant tumors [30], which can contain different grades of tumor cells, edema, and vascular structures within each imaging voxel and across the entire tumor. The complexity of the tumor microstructure imposes serious chal-lenges for diagnosis, treatment planning, and post-treatment evaluation. HDI was developed as a novel diffusion MRI technique to characterize tumor heterogeneity by separating and quantifying multiple pathological components.
Although conventional diffusion-weighted imaging (DWI) and DTI have been employed to characterize tumors and to evaluate treatment response in patients with primary brain tumors
Fig 6. The associations between dynamic susceptibility contrast-derived cerebral blood volume and Heterogeneity Diffusion Imaging-derived indices. Scatter plots showing the significant correlations between (A) dynamic
susceptibility contrast perfusion imaging-generated cerebral blood volume (CBV) and Heterogeneity Diffusion Imaging (HDI)-derived perfusion fraction and (B) CBV and HDI-derived slow hindered diffusion fraction in all subjects at the tissue sampling regions. No significant correlations were found between (C) CBV and HDI-derived cellularity fraction or (D) CBV and HDI-derived fast hindered diffusion fraction.
[9,12], these methods are not capable of detecting multiple tumor pathologies due to their sin-gle diffusion tensor assumption. ADC measures from DWI have been widely used in diagnos-tic oncology, and the reduced ADC of some tumors has been associated with a high density of tumor cells [9]. However, the sensitivity and specificity of ADC for detecting malignant tumors may be decreased by the edema and/or tumor necrosis that coexists in the lesions [31].
The development of advanced models and model-free diffusion MRI techniques has dem-onstrated improvements in tumor detection and characterization. For example, by making no assumptions about tissue composition, diffusion kurtosis imaging provides a model-free way to quantify non-Gaussian water diffusion [32]. This type of imaging has demonstrated its sen-sitivity for grading tumors [33] as well as its high diagnostic accuracy for separating low- from high-grade gliomas through meta-analysis [34]. Similarly, the stretched exponential method— developed to describe diffusion-related signal decay as a continuous distribution, with no assumptions made about the number of participating sources [35]—has demonstrated better performance for differentiating tumor grades as compared with ADC and DTI [36]. Although both the diffusion kurtosis imaging and stretched exponential methods show that non-Gauss-ian diffusion effects can be used as general heterogeneity biomarkers, it is unknown whether the non-Gaussian diffusion effects are mainly contributed by tumor cells or by the neuronal structures invaded by the tumor. Generalized q-sampling imaging derives complex intravoxel and intervoxel fiber alignment in tissue [37]. A rodent and human glioblastoma study has indi-cated that q-sampling imaging detected unique intratumor structural features that correlate with both intratumor biological heterogeneity and overall survival [38]. However, no isotropic diffusion components directly associated with tumor cells were included in the present study. Restriction spectrum imaging is an advanced DWI modeling technique that allows for the more direct measurement of tumor cells due to its ability to distinguish among different pools of water within tumor tissues [39]. Previous studies have demonstrated that the restriction spectrum imaging index has increased sensitivity and specificity as compared with ADC for the assessment of brain tumors [39]. Model-based advanced diffusion methods have the advantage of providing more specific subvoxel information. HDI was developed on the basis of the data-driven multicompartment model DBSI [16–20], with the extension of the full iso-tropic diffusion spectrum to 40μm2/ms. This pilot study demonstrated that HDI is capable of imaging and quantifying multiple tumor pathological components and microvascularity per-fusion simultaneously within brain tumors in a single clinical difper-fusion scan, which distin-guishes it from previous models.
In this study, HDI employed CF and sHF images to characterize the spatial distributions of tumor cellularity and its packing density, which cannot be revealed from conventional ADC maps and other advanced diffusion methods. The representative images from one low-grade tumor patient with WHO II oligodendroglioma (seeFig 3) and one high-grade tumor patient with WHO III oligodendroglioma (seeFig 4) showed very heterogeneous tumor cellularity dis-tributions. The conventional ADC measurements were incapable of differentiating between patients with WHO II and III tumors (seeFig 5A), thereby demonstrating ADC’s limited capa-bility for characterizing heterogeneous tumor microenvironments. HDI-CF showed an increased trend in the WHO III group as compared with the WHO II group, but no statisti-cally significant difference was found (seeFig 5B), probably due to the small sample size. Inter-estingly, HDI demonstrated that the WHO III group had a much higher HDI-sHF than that found in the WHO II group (seeFig 5C), which suggests that there are more densely packed tumor cells in the WHO III group as compared with the WHO II group. The HDI-fHF find-ings (seeFig 5D) demonstrated that the extracellular water fractions are comparable between the two groups. These findings suggest that HDI parameters can better quantify the micro-structural heterogeneity within tumors and that these parameters may provide higher
sensitivity for categorizing tumors as compared with conventional ADC. In this pilot study, we demonstrated the feasibility of using HDI to analyze heterogeneous brain tumors. No auto-matic method was used to classify the tumor grades based on the HDI findings due to the small sample size. A larger study will enable us to better define the relationship between tumor grade and HDI distribution, which will allow for an automatic tumor grade evaluation.
The discovery of gadolinium tissue deposition [40] and the uncertainty surrounding its effects compel the imaging community to find alternative methods for quantifying perfusion. The conventional IVIM method [28] employs a simple biexponential model to quantify perfu-sion (fast diffuperfu-sion) and diffuperfu-sion (slow diffuperfu-sion) effects in biological tissue. Although con-ventional IVIM-derived perfusion metrics have improved the diagnostic performance of arterial spin labeling-derived cerebral blood flow and have a strong correlation with cerebral blood flow [41], their accuracy and reliability have not been well accepted, at least partially due to the associated overly simplified biexponential computation model for complex biological tissues. To address this limitation of conventional IVIM, HDI incorporates the “ultrafast” IVIM component associated with capillary blood perfusion [41] into the comprehensive modeling of neuronal components, tumor cellularity, and extracellular water (Eq (1)). In this study, the HDI perfusion component was compared with clinical DSC perfusion imaging in all subjects. The strong correlation between HDI-derived perfusion and DSC-derived CBV (Fig 6A) and the similar spatial distribution patterns between those measures (seeFig 3D and 3H
andFig 4D and 4H) suggest that the HDI-derived perfusion index holds great promise as a complementary noninvasive method for accurately quantifying tumor CBV for patients who cannot receive contrast material for clinical DSC scans. The findings that CBV correlated with HDI-sHF (seeFig 6B) suggest that blood perfusion increases with an increased packing density of tumor cells.
The results of the biopsy evaluation of tumors highly depends on the location of the tissue sampling. The suboptimal selection of the biopsy site may lead to underdiagnosis, undertreat-ment, and higher tumor recurrence rates. Conventional T1W or T2W imaging has been
previ-ously employed for MRI-guided biopsy [42], and DWI has also been used to optimize biopsy target selection [43]. However, those imaging contrasts may not distinguish tumors from other pathologies such as regions with edema or tumor necrosis. This study has demonstrated that HDI could be a promising noninvasive tool for the guidance of biopsy, surgery, and radiotherapy.
Each biopsy site represents a different region of tumor that is localized by the Stealth neuro-navigational system and superimposed on both anatomical maps and maps of HDI-derived indices. Spatial heterogeneity is a fundamental feature of brain tumors [44]. Different sampling regions within one tumor usually have different characterizations, which is evidenced by the diffusion and perfusion data from the same subject (seeFig 4). Thus, including multiple sam-ples from the same subject will increase statistical power without biasing the analysis.
There are several limitations of this pilot study. First, the sample size is small. Future studies with larger numbers of patients will be needed to further validate the HDI technique. Second, the isotropic diffusivity thresholds were selected based on results from previously published DBSI studies. More patient data and histology studies are needed to further refine and opti-mize the threshold selection. Third, the fixed diffusion time employed in this study could lead to potential overlapping among different isotropic components. Incorporating multiple diffu-sion time measurement [45] could potentially improve HDI’s accuracy when characterizing the tumor microenvironment.
Conclusions
HDI was developed in this pilot study to noninvasively characterize brain tumor heterogene-ity. The preliminary data demonstrate the capability of HDI to quantify the microenvironment heterogeneity of brain tumors, including tumor cell fraction, packing density, edema, and cap-illary blood perfusion in a single diffusion MRI examination. The HDI results are consistent with pathology assessments of biopsy tissues and DSC measurements of blood perfusion. Larger studies will be needed to further validate HDI and to establish its role in the clinical management of patients with brain tumors.
Acknowledgments
The authors appreciate all of the patients with brain tumors and their families for their time and effort. They are also grateful to the support staff for their dedication.
Author Contributions
Conceptualization: Qing Wang, Gloria J. Guzma´n Pe´rez-Carrillo, Yong Wang. Data curation: Keith M. Rich.
Formal analysis: Qing Wang, Gloria J. Guzma´n Pe´rez-Carrillo, Maria Rosana Ponisio, Pamela LaMontagne, Sonika Dahiya, Mikhail Milchenko, Jingxia Liu, Gengsheng Chen, Amber Salter, Yong Wang.
Funding acquisition: Jonathan McConathy, Tammie L. S. Benzinger, Yong Wang.
Investigation: Qing Wang, Gloria J. Guzma´n Pe´rez-Carrillo, Joshua Shimony, Keith M. Rich, Tammie L. S. Benzinger, Yong Wang.
Methodology: Qing Wang, Gloria J. Guzma´n Pe´rez-Carrillo, Yong Wang.
Project administration: Daniel S. Marcus, Parinaz Massoumzadeh, Tammie L. S. Benzinger. Resources: Daniel S. Marcus, Joshua Shimony, Michelle M. Miller-Thomas, Keith M. Rich,
Jonathan McConathy, Tammie L. S. Benzinger. Software: Qing Wang.
Supervision: Joshua Shimony, Michelle M. Miller-Thomas, Tammie L. S. Benzinger, Yong Wang.
Validation: Pamela LaMontagne, Sonika Dahiya.
Writing – original draft: Qing Wang, Gloria J. Guzma´n Pe´rez-Carrillo.
Writing – review & editing: Maria Rosana Ponisio, Pamela LaMontagne, Sonika Dahiya, Daniel S. Marcus, Mikhail Milchenko, Joshua Shimony, Jingxia Liu, Gengsheng Chen, Amber Salter, Parinaz Massoumzadeh, Michelle M. Miller-Thomas, Keith M. Rich, Jona-than McConathy, Tammie L. S. Benzinger, Yong Wang.
References
1. Brain Tumor Statistics—ABTA 2018. Available from: http://abta.pub30.convio.net/about-us/news/brain-tumor-statistics/.
2. Choi YP, Shim HS, Gao MQ, Kang S, Cho NH. Molecular portraits of intratumoral heterogeneity in human ovarian cancer. Cancer Lett. 2011; 307(1):62–71.https://doi.org/10.1016/j.canlet.2011.03.018
PMID:21481528
3. Sundgren PC, Fan XY, Weybright P, Welsh RC, Carlos RC, Petrou M, et al. Differentiation of recurrent brain tumor versus radiation injury using diffusion tensor imaging in patients with new
contrast-enhancing lesions. Magn Reson Imaging. 2006; 24(9):1131–42.https://doi.org/10.1016/j.mri.2006.07. 008PMID:17071335
4. Xu JL, Li YL, Lian JM, Dou SW, Yan FS, Wu H, et al. Distinction between postoperative recurrent glioma and radiation injury using MR diffusion tensor imaging. Neuroradiology. 2010; 52(12):1193–9.https:// doi.org/10.1007/s00234-010-0731-4PMID:20571787
5. Bulik M, Jancalek R, Vanicek J, Skoch A, Mechl M. Potential of MR spectroscopy for assessment of gli-oma grading. Clin Neurol Neurosurg. 2013; 115(2):146–53.https://doi.org/10.1016/j.clineuro.2012.11. 002PMID:23237636
6. Naser RKA, Hassan AAK, Shabana AM, Omar NN. Role of magnetic resonance spectroscopy in grad-ing of primary brain tumors. Egypt J Radiol Nuc M. 2016; 47(2):577–84.
7. Gupta PK, Saini J, Sahoo P, Patir R, Ahlawat S, Beniwal M, et al. Role of Dynamic Contrast-Enhanced Perfusion Magnetic Resonance Imaging in Grading of Pediatric Brain Tumors on 3T. Pediatr Neuro-surg. 2017; 52(5):298–305.https://doi.org/10.1159/000479283PMID:28848203
8. Yamasaki F, Kurisu K, Satoh K, Arita K, Sugiyama K, Ohtaki M, et al. Apparent diffusion coefficient of human brain tumors at MR imaging. Radiology. 2005; 235(3):985–91.https://doi.org/10.1148/radiol. 2353031338PMID:15833979
9. Maier SE, Sun Y, Mulkern RV. Diffusion imaging of brain tumors. NMR Biomed. 2010; 23(7):849–64.
https://doi.org/10.1002/nbm.1544PMID:20886568
10. Guo AC, Cummings TJ, Dash RC, Provenzale JM. Lymphomas and high-grade astrocytomas: compari-son of water diffusibility and histologic characteristics. Radiology. 2002; 224(1):177–83.https://doi.org/ 10.1148/radiol.2241010637PMID:12091680
11. Tomura N, Narita K, Izumi J, Suzuki A, Anbai A, Otani T, et al. Diffusion changes in a tumor and peritu-moral tissue-after stereotactic irradiation for brain tumors: Possible prediction of treatment response. J Comput Assist Tomo. 2006; 30(3):496–500.
12. Schmainda KM. Diffusion-weighted MRI as a biomarker for treatment response in glioma. CNS Oncol. 2012; 1(2):169–80.https://doi.org/10.2217/cns.12.25PMID:23936625
13. Zhang H, Rodiger LA, Shen T, Miao J, Oudkerk M. Perfusion MR imaging for differentiation of benign and malignant meningiomas. Neuroradiology. 2008; 50(6):525–30. https://doi.org/10.1007/s00234-008-0373-yPMID:18379768
14. Yoon RG, Kim HS, Hong GS, Park JE, Jung SC, Kim SJ, et al. Joint approach of diffusion- and perfu-sion-weighted MRI in intra-axial mass like lesions in clinical practice simulation. PLoS One. 2018; 13(9): e0202891.https://doi.org/10.1371/journal.pone.0202891PMID:30192785
15. Groenendaal G, van den Berg CA, Korporaal JG, Philippens ME, Luijten PR, van Vulpen M, et al. Simul-taneous MRI diffusion and perfusion imaging for tumor delineation in prostate cancer patients. Radio-ther Oncol. 2010; 95(2):185–90.https://doi.org/10.1016/j.radonc.2010.02.014PMID:20231041
16. Wang Y, Sun P, Wang Q, Trinkaus K, Schmidt RE, Naismith RT, et al. Differentiation and quantification of inflammation, demyelination and axon injury or loss in multiple sclerosis. Brain. 2015; 138(Pt 5):1223–38.https://doi.org/10.1093/brain/awv046PMID:25724201
17. Wang Y, Wang Q, Haldar JP, Yeh FC, Xie M, Sun P, et al. Quantification of increased cellularity during inflammatory demyelination. Brain. 2011; 134(Pt 12):3590–601.https://doi.org/10.1093/brain/awr307
PMID:22171354
18. Chiang CW, Wang Y, Sun P, Lin TH, Trinkaus K, Cross AH, et al. Quantifying white matter tract diffusion parameters in the presence of increased extra-fiber cellularity and vasogenic edema. Neuroimage. 2014; 101:310–9.https://doi.org/10.1016/j.neuroimage.2014.06.064PMID:25017446
19. Murphy RK, Sun P, Xu J, Wang Y, Sullivan S, Gamble P, et al. Magnetic Resonance Imaging Biomarker of Axon Loss Reflects Cervical Spondylotic Myelopathy Severity. Spine (Phila Pa 1976). 2015. 20. Wang X, Cusick MF, Wang Y, Sun P, Libbey JE, Trinkaus K, et al. Diffusion basis spectrum imaging
detects and distinguishes coexisting subclinical inflammation, demyelination and axonal injury in experi-mental autoimmune encephalomyelitis mice. NMR in biomedicine. 2014; 27(7):843–52.https://doi.org/ 10.1002/nbm.3129PMID:24816651
21. Fouke SJ, Benzinger TL, Milchenko M, LaMontagne P, Shimony JS, Chicoine MR, et al. The compre-hensive neuro-oncology data repository (CONDR): a research infrastructure to develop and validate imaging biomarkers. Neurosurgery. 2014; 74(1):88–98.https://doi.org/10.1227/NEU.
0000000000000201PMID:24089052
22. Milchenko M, Snyder AZ, LaMontagne P, Shimony JS, Benzinger TL, Fouke SJ, et al. Heterogeneous Optimization Framework: Reproducible Preprocessing of Multi-Spectral Clinical MRI for Neuro-Oncol-ogy Imaging Research. Neuroinformatics. 2016; 14(3):305–17. https://doi.org/10.1007/s12021-016-9296-7PMID:26910516
23. Hajnal JV, Saeed N, Soar EJ, Oatridge A, Young IR, Bydder GM. A Registration and Interpolation Pro-cedure for Subvoxel Matching of Serially Acquired Mr-Images. J Comput Assist Tomo. 1995; 19 (2):289–96.
24. Rowland DJ, Garbow JR, Laforest R, Snyder AZ. Registration of [18F]FDG microPET and small-animal MRI. Nucl Med Biol. 2005; 32(6):567–72.https://doi.org/10.1016/j.nucmedbio.2005.05.002PMID:
16026703
25. Lee JJ, Bretthorst GL, Derdeyn CP, Powers WJ, Videen TO, Snyder AZ, et al. Dynamic susceptibility contrast MRI with localized arterial input functions. Magn Reson Med. 2010; 63(5):1305–14.https://doi. org/10.1002/mrm.22338PMID:20432301
26. Basser PJ, Mattiello J, LeBihan D. Estimation of the effective self-diffusion tensor from the NMR spin echo. J Magn Reson B. 1994; 103(3):247–54.https://doi.org/10.1006/jmrb.1994.1037PMID:8019776
27. Anderson AW. Measurement of fiber orientation distributions using high angular resolution diffusion imaging. Magn Reson Med. 2005; 54(5):1194–206.https://doi.org/10.1002/mrm.20667PMID:
16161109
28. Le Bihan D, Breton E, Lallemand D, Grenier P, Cabanis E, Laval-Jeantet M. MR imaging of intravoxel incoherent motions: application to diffusion and perfusion in neurologic disorders. Radiology. 1986; 161 (2):401–7.https://doi.org/10.1148/radiology.161.2.3763909PMID:3763909
29. Fedorov A, Beichel R, Kalpathy-Cramer J, Finet J, Fillion-Robin JC, Pujol S, et al. 3D Slicer as an image computing platform for the Quantitative Imaging Network. Magn Reson Imaging. 2012; 30(9):1323–41.
https://doi.org/10.1016/j.mri.2012.05.001PMID:22770690
30. Meacham CE, Morrison SJ. Tumour heterogeneity and cancer cell plasticity. Nature. 2013; 501 (7467):328–37.https://doi.org/10.1038/nature12624PMID:24048065
31. Nicholson C. Factors governing diffusing molecular signals in brain extracellular space. J Neural Transm (Vienna). 2005; 112(1):29–44.
32. Jensen JH, Helpern JA, Ramani A, Lu H, Kaczynski K. Diffusional kurtosis imaging: the quantification of non-gaussian water diffusion by means of magnetic resonance imaging. Magn Reson Med. 2005; 53 (6):1432–40.https://doi.org/10.1002/mrm.20508PMID:15906300
33. Van Cauter S, Veraart J, Sijbers J, Peeters RR, Himmelreich U, De Keyzer F, et al. Gliomas: diffusion kurtosis MR imaging in grading. Radiology. 2012; 263(2):492–501.https://doi.org/10.1148/radiol. 12110927PMID:22403168
34. Falk Delgado A, Nilsson M, van Westen D, Falk Delgado A. Glioma Grade Discrimination with MR Diffu-sion Kurtosis Imaging: A Meta-Analysis of Diagnostic Accuracy. Radiology. 2018; 287(1):119–27.
https://doi.org/10.1148/radiol.2017171315PMID:29206593
35. Bennett KM, Schmainda KM, Bennett R, Rowe DB, Lu HB, Hyde JS. Characterization of continuously distributed cortical water diffusion rates with a stretched-exponential model. Magnet Reson Med. 2003; 50(4):727–34.
36. Bai Y, Lin Y, Tian J, Shi D, Cheng J, Haacke EM, et al. Grading of Gliomas by Using Monoexponential, Biexponential, and Stretched Exponential Diffusion-weighted MR Imaging and Diffusion Kurtosis MR Imaging. Radiology. 2016; 278(2):496–504.https://doi.org/10.1148/radiol.2015142173PMID:
26230975
37. Yeh FC, Wedeen VJ, Tseng WY. Generalized q-sampling imaging. IEEE Trans Med Imaging. 2010; 29 (9):1626–35.https://doi.org/10.1109/TMI.2010.2045126PMID:20304721
38. Taylor EN, Ding Y, Zhu S, Cheah E, Alexander P, Lin L, et al. Association between tumor architecture derived from generalized Q-space MRI and survival in glioblastoma. Oncotarget. 2017; 8(26):41815– 26.https://doi.org/10.18632/oncotarget.16296PMID:28404971
39. White NS, McDonald CR, Farid N, Kuperman JM, Kesari S, Dale AM. Improved conspicuity and delin-eation of high-grade primary and metastatic brain tumors using "restriction spectrum imaging": quantita-tive comparison with high B-value DWI and ADC. AJNR Am J Neuroradiol. 2013; 34(5):958–64, S1.
https://doi.org/10.3174/ajnr.A3327PMID:23139079
40. McDonald RJ, McDonald JS, Kallmes DF, Jentoft ME, Murray DL, Thielen KR, et al. Intracranial Gado-linium Deposition after Contrast-enhanced MR Imaging. Radiology. 2015; 275(3):772–82.https://doi. org/10.1148/radiol.15150025PMID:25742194
41. Shen N, Zhao L, Jiang J, Jiang R, Su C, Zhang S, et al. Intravoxel incoherent motion diffusion-weighted imaging analysis of diffusion and microperfusion in grading gliomas and comparison with arterial spin labeling for evaluation of tumor perfusion. J Magn Reson Imaging. 2016; 44(3):620–32.https://doi.org/ 10.1002/jmri.25191PMID:26880230
42. Silverman SG, Collick BD, Figueira MR, Khorasani R, Adams DF, Newman RW, et al. Interactive MR-guided biopsy in an open-configuration MR imaging system. Radiology. 1995; 197(1):175–81.https:// doi.org/10.1148/radiology.197.1.7568819PMID:7568819
43. Deng J, Virmani S, Yang GY, Tang R, Woloschak G, Omary RA, et al. Intraprocedural diffusion-weighted PROPELLER MRI to guide percutaneous biopsy needle placement within rabbit VX2 liver tumors. J Magn Reson Imaging. 2009; 30(2):366–73.https://doi.org/10.1002/jmri.21840PMID:
19629976
44. Yuan Y. Spatial Heterogeneity in the Tumor Microenvironment. Cold Spring Harb Perspect Med. 2016; 6(8).
45. Xu JZ, Li H, Harkins KD, Jiang XY, Xie JP, Kang H, et al. Mapping mean axon diameter and axonal vol-ume fraction by MRI using temporal diffusion spectroscopy. Neuroimage. 2014; 103:10–9.https://doi. org/10.1016/j.neuroimage.2014.09.006PMID:25225002