Directed by Drs. Randall Penfield and Robert Henson. 254 pp.
Multilevel data complicates the accumulation of validation evidence. Using a unilevel approach to differential item functioning in the presence of multilevel data is both a theoretically and statistically unsound method. This simulation study compares three multilevel frameworks for the detection of differential item functioning. The methods compared were the Beggs Mantel-Haenszel adjustment, the multilevel Rasch model, and the SIBTEST bootstrapped standard error adjustment. Five conditions were varied in this study: the magnitude of DIF, the social-unit level sample size, the presence of impact, the degree of correlation within clusters, and the ratio of the reference to focal group. The results suggest that the Beggs Mantel-Haenszel adjustment is superior when analyzing Type I error and power rates. However, the multilevel Rasch model produced more accurate and precise estimates of effect size. Additionally, the multilevel Rasch model has the potential to provide more nuanced information regarding the causes of item bias.
COMPARING THREE MULTILEVEL FRAMEWORKS FOR THE DETECTION OF DIFFERENTIAL ITEM FUNCTIONING
by
Elizabeth Adele Patton
A Dissertation Submitted to the Faculty of The Graduate School at The University of North Carolina at Greensboro
in Partial Fulfillment
of the Requirements for the Degree Doctor of Philosophy Greensboro 2019 Approved by Committee Co-Chair Committee Co-Chair
ii
This dissertation, written by Elizabeth Adele Patton, has been approved by the following committee of the Faculty of The Graduate School at The University of North Carolina at Greensboro.
Committee Co-Chair Committee Co-Chair Committee Members
Date of Acceptance by Committee
iii
I would like to thank my dissertation committee of Dr. Micheline Chalhoub-Deville, Dr. Ric Luecht, Dr. Bob Henson, and Dr. Randy Penfield for their support and feedback throughout this process. In addition, I would like to thank Dr. Micheline Chalhoub-Deville for the significant mentorship she has offered over the years. Her personal and career advice has proven invaluable. Lastly, I would be remiss if I did not thank Dr. Micheline Chalhoub-Deville, Dr. Ric Luecht, and Dr. John Willse for the numerous professional recommendation letters they have provided. I am fortunate to have the endorsement of such well respected professionals and grateful for their assistance in securing a wonderful job. Lastly, I would like to thank Dr. Feifei Ye at the University of Pittsburgh for recognizing a Sociology of Education student who was slightly out of place in her advanced quantitative methods courses. Her guidance led me down this path and to the University of North Carolina Greensboro.
I would like to thank Lexi Lay for her friendship during this process. She is an incredible friend and colleague and I am excited to see what these next stages of life bring for both of us personally and professionally. Finally, and most importantly, I would like to thank my family for their continued love and support through this process. My husband made significant sacrifices, including relocating and career transitions, for me to pursue this degree. My daughter, Felicity, has provided the impetus for much-needed study breaks and is a constant reminder of how important a work-life balance is.
iv
Page
LIST OF TABLES ... vii
LIST OF FIGURES ... ix
CHAPTER I. INTRODUCTION ... 1
History of Accountability in the United States ... 4
Local Context ... 6
Purpose ... 10
Current Study... 11
Research Questions ... 13
Organization of the Study ... 13
II. LITERATURE REVIEW ... 14
An Overview of Validity ... 15
Interpretative Argument—Interpretation/Use Argument ... 16
The Validation of Use ... 19
Validation and Differential Item Functioning ... 24
Multilevel Validation: Context, Accountability, and Methodologies ... 28
Modifying an Existing Validation Framework for Accountability ...29
An Alternative Conceptualization of Multilevel Validation: Multilevel Constructs and Contextualized Response Processes ...35
Supporting Methodologies for Modified Validation Frameworks ...40
Differential Item Functioning ... 43
Effect Size ... 45
Traditional DIF Detection Procedures ... 45
Non-parametric Observed Score Matching Approaches ... 46
Parametric Latent Variable Matching Approaches ... 53
Multilevel DIF Detection Frameworks ... 55
Multilevel Mantel-Haenszel ... 57
Multilevel SIBTEST ... 59
Two- and Three-Level Rasch Models ... 61
v
Parametric Approaches: Multilevel Rasch Model ... 70
Anchor Item Selection and Purification ... 72
III. METHODS ... 79
Simulation Design ... 79
DIF Detection Methods ... 82
Selected Software ... 83
Variable Conditions ... 84
Conditions Held Constant ... 86
Addressing the Research Questions ... 89
IV. RESULTS ... 92
Descriptive Statistics ... 92
Power and Type I Error ... 93
Type I Error ... 93
Power ... 101
Effect Size Estimates ... 110
Relative Bias ... 110
Root Mean Square Error ... 117
Impact ... 125
Relative Bias ... 127
Root Mean Square Error ... 129
Impact Discussion ... 131
Validation Implications ... 131
Sources of Evidence at the Social-unit Level ... 132
Multilevel Interpretation Use Argument ... 134
Ecological Model of Validation ... 135
V. DISCUSSION ... 138
Multilevel Validation and DIF ... 138
Study Findings and Conclusions ... 140
Research Question 1: Power and Type I Error Rates ... 141
Research Question 2: Factors Influencing the Power and Type I Error Rates ... 141
Research Question 3: Effect Size ... 143
Implications ... 145
Limitations ... 147
vi
APPENDIX A. TYPE I ERROR AND POWER RESULTS ... 166
APPENDIX B. RELATIVE BIAS RESULTS ... 184
APPENDIX C. ROOT MEAN SQUARE ERROR RESULTS ... 215
vii
Page
Table 1. Example of the Extrapolation Inference ...17
Table 2. DIF as a Source of Validity Evidence (Gomez-Benito et al., 2018) ...26
Table 3. Classification of DIF Detection Methods ...43
Table 4. Contingency Table ...46
Table 5. Effect Size Measures for the Mantel-Haenszel ...49
Table 6. Effect Size Measures for SIBTEST ...53
Table 7. Example Dummy Coding for HGLM Rasch Model ...62
Table 8. Item Intercepts for DIF Items ...80
Table 9. Conditions Varied in the Study ...81
Table 10. Descriptive Statistics for Intraclass Correlation ...92
Table 11. Descriptive Statistics for School Means ...93
Table 12. Average Type I Error by Magnitude of DIF ...94
Table 13. Average Type I Error by Social-unit Sample Size...94
Table 14. Average Type I Error by ICC ...94
Table 15. Average Type I Error by Multilevel DIF Framework ...95
Table 16. BMH95 Type I Error ...96
Table 17. Multilevel Rasch Model Type I Error ...97
Table 18. SIBTEST BSSE Type I Error ...98
Table 19. Average Power by Magnitude of DIF ...102
Table 20. Average Power by Social-Unit Sample Size ...102
viii
Table 23. BMH95 Power ...104 Table 24. Multilevel Rasch Model Power ...105 Table 25. SIBTEST BSSE Power ...106 Table 26. Mean and Standard Deviation of Bias by Item Type, Impact Presence,
and Multilevel DIF Framework ...116 Table 27. Impact Analysis ...126
ix
Page Figure 1. Kane’s Validation Process adapted from Kane, Crooks, and Cohen
(1999), Kane (2006), and Kane (2013) ...18
Figure 2. Expanded View of Validation taken from Kane (2006) ...19
Figure 3. The Burden of Validation Responsibility as Presented by Chalhoub- Deville (2009) ...23
Figure 4. Kane’s IUA Adapted to Reflect Test Use in an Accountability System ...34
Figure 5. Zumbo et al.’s (2015) Ecological Model of Test Taking...37
Figure 6. An Ecological Model of Validation ...40
Figure 7. Types of Dichotomous DIF ...44
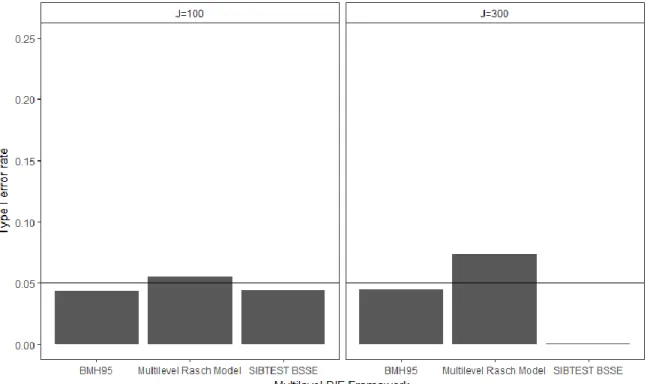
Figure 8. Type I Error for DIF Detection by Multilevel DIF Framework and Social-unit Sample Size ...100
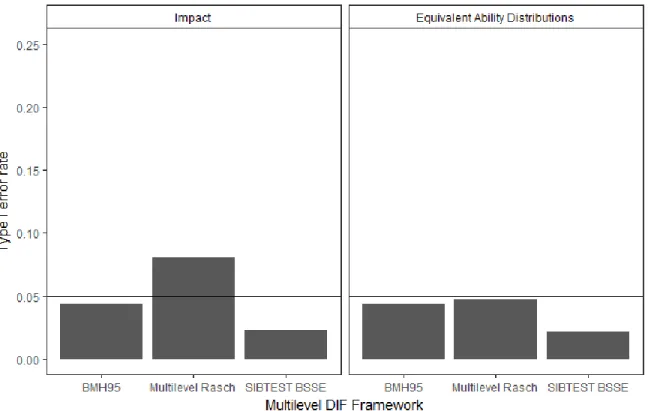
Figure 9. Type I Error for DIF Detection by Multilevel DIF Framework and Impact Presence ...101
Figure 10. Power for Magnitude of DIF by Number of Social-unit Clusters ...108
Figure 11. Power by Multilevel DIF Framework, Social-unit Sample Size, and Magnitude of DIF ...109
Figure 12. Relative Bias by Item Type and Framework ...111
Figure 13. Relative Bias by Magnitude of DIF and Framework ...111
Figure 14. Relative Bias by Social-unit Sample Size and Framework ...112
Figure 15. Relative Bias by Reference to Focal Group Ratio and Framework ...112
Figure 16. Relative Bias by Impact Presence and Framework...113
Figure 17. Interaction between Group Favored by DIF Item and Multilevel DIF Framework ...114
x
Figure 19. Root Mean Square Error by Item Type, Impact Status, and Multilevel
DIF Framework ...117
Figure 20. Root Mean Square Error by Item Type and Multilevel DIF Framework ...118
Figure 21. Root Mean Square Error by DIF Magnitude and Multilevel DIF Framework ...118
Figure 22. Root Mean Square Error by Social-unit Sample Size and Multilevel DIF Framework ...119
Figure 23. Root Mean Square Error by Reference to Focal Group Ratio and Multilevel DIF Framework ...119
Figure 24. Root Mean Square Error by Impact Presence and Multilevel DIF Framework ...120
Figure 25. Root Mean Square Error by Item Type and Magnitude of DIF ...121
Figure 26. Root Mean Square Error by Multilevel DIF Framework, Item Type, and Magnitude ...123
Figure 27. Root Mean Square Error by Social-unit Sample Size ...124
Figure 28. Root Mean Square Error by Multilevel DIF Framework...124
Figure 29. Bias by Impact Presence and Social-unit Cluster Size ...127
Figure 30. Bias Across ICC Magnitudes ...128
Figure 31. Root Mean Square Error by ICC Magnitude and Social-unit Sample Sizes ...129
Figure 32. Root Mean Square Error by ICC Magnitude and Impact Presence ...130
Figure 33. Root Mean Square Error by Impact Presence and Social-unit Sample Size ...131
CHAPTER I INTRODUCTION
Fairness in testing is a pivotal though complex issue. According to the Standards for Educational and Psychological Testing (2014; referred to hereafter as the Standards), fairness, “has no single technical meaning and is used in many different ways in public discourse” (p. 49). However, definitions related to testing frequently associate issues of fairness and validity. For instance, ETS (2014) defines fairness as, “the extent to which the inferences made on the basis of test scores are valid for different groups of test takers” (p. 19). While it is not feasible to investigate fairness for all groups in the population of test takers, testing programs should investigate fairness for those groups that experience or research has indicated are likely to be adversely impacted by construct-irrelevant influences on their test performance (ETS, 2014). Typically, analyses include groups which have been discriminated against based on ethnicity, disability status, gender, native language, or race and are defined legally.
The glossary of the Standards offers a related definition stating that, “fairness minimizes the construct-irrelevant variance associated with individual characteristics and testing contexts that otherwise would compromise the validity of scores for some
individuals” (2014, p. 219). The chapter dedicated to fairness within the Standards goes on to describe fairness in testing as being attributable to four principles: (1) fair and equitable treatment of all test takers during the testing process, (2) the lack or absence of
measurement bias, (3) access to the constructs measured, and (4) fairness as validity of individual test score interpretations for the intended use(s).
The excerpts from ETS (2014) and the Standards (2014) elucidate two issues which are being addressed in contemporary validity and fairness research. First, both the definitions from ETS and the Standards fail to differentiate between the intended and actual uses of test scores. The focus is on fairness as it relates to the intended uses for individual test takers. Moss contends that in a modern era of testing, one which is dominated by accountability systems, “a shift in focus from intended interpretations and uses to actual interpretations and uses is necessary” (2016, emphasis original, p. 236).
Second, there is a limited scope of group. Limiting analyses between test-takers based on their gender, ethnicity, native language, etc. places the focus on the individual characteristics of the test taker. This conclusion is in keeping with Leauneanu and Hubley’s (2017) assertion that validation research is typically disconnected from the contextual influences that shape testing situations. Zumbo and colleagues (2015) and later Chen and Zumbo (2017) address these concerns by proposing an ecological model of test taking.
While seemingly disparate theoretical discussions, ecological modeling and accountability systems stress the notion that student testing experiences and data are multilevel in nature. As such, there is a growing body of research focused on similar methodologies across the two research lines. One group of methodologies that are supported in both sets of literature, are analyses of differential item functioning.
The Standards (2014, p. 218) formally defines differential item functioning (DIF) as “a statistical indicator of the extent to which different groups of test takers who are at the same ability level have different frequencies of correct responses”. DIF is the statistical term that is used to simply describe the situation in which persons from one group answered an item correctly more often than equally knowledgeable persons from another group (Zumbo, 2007). Thus, DIF studies attempt to quantify construct irrelevant variance by assessing whether item responses differ for examinees with the same ability level but in different groups (Dorans & Holland, 1993). As such, DIF studies are
considered a key component in the evaluation of the fairness and validity of educational tests (Zwick, 2012).
However, DIF is not synonymous with item bias. Rather, DIF is a necessary but not sufficient condition for item bias (Clauser & Mazor, 1998). If an item exhibits
statistical DIF then it should undergo a judgmental procedure to determine the unintended sources of group differences in item difficulty. If these differences are due to an
unintended construct that is irrelevant to the attribute being measured then the item is considered biased (Camilli & Shepard, 1994). Thus, DIF is a statistical term while bias is a judgmental term. Lastly, impact represents between-group differences in test
performance caused by a between-group difference on the construct being measured (Ackerman, 1992). Therefore, impact represents results caused by true differences while DIF represents results caused by differences in construct irrelevant variables.
This chapter will provide a brief historical perspective on accountability systems within the United States before turning back to issues of validity, fairness, and DIF in
Chapter Two. Understanding the high stakes associated with accountability testing as well as its pervasiveness is necessary to understanding the current climate of testing and as a result validity, validation, and the assessment of fairness. As a key component of validity and fairness studies, DIF analyses should ultimately be shaped by our current testing landscape. To ground the discussion in current context, examples of the high stakes decisions made under the banner of accountability in North Carolina will be given.
History of Accountability in the United States
Internationally, accountability systems have arguably been the one most powerful trend in education policy in the last twenty years (Volante, 2007). Others have concurred dubbing the increased focus on accountability in the social sector, the ‘age of
accountability’ (Hopmann, 2008). Accountability systems combine numerous metrics, including test scores, to result in an overall index or rating for teachers, schools, districts, and educator preparation programs. The myriad of actual uses of test scores due to accountability systems in the United States requires a thoughtful discussion of fairness and validity.
The advent of the Elementary and Secondary Education Act (ESEA) of 1965 marks federal involvement in test-based accountability. Prior to ESEA, several states had introduced statewide testing programs intended to be used for student guidance and the identification of talent (Mazzeo, 2001). Federal involvement in test-based accountability represents an exponentially increasing shift from student-level accountability to
Since the 1970s, the United States has increasingly gravitated toward test-based reforms and school regulation. While ESEA was focused on equal opportunity and school improvement, it’s reauthorization, the No Child Left Behind Act of 2002 (NCLB), shifts to using standardized tests to hold educators, schools and states accountable to federal guidelines and expectations (Linn, 2006). Although not without dispute, the primary goal of accountability systems is student learning. By holding administrators and teachers accountable, it is hoped that they will be sufficiently motivated to encourage and support student learning. To increase motivation, administrators and teachers are held responsible for student learning (Smith, 2017).
If NCLB represents a shift away from student-level accountability, Race to the Top (RTTT, authorized under the American Recovery and Reinvestment Act of 2009) squarely places accountability at the social-unit level. Specifically, RTTT testing systems are intended to drive teacher effectiveness, school performance, and economic growth through college and career readiness (Deville & Chalhoub-Deville, 2011). To achieve these lofty goals, RTTT mandated many of the design features that testing consortia and independent states must attend to, such as alignment with Common Core State Standards (CCSS).
In 2015, NCLB was succeeded by the Every Student Succeeds Act (ESSA), another reauthorization of ESEA. While ESSA has addressed some of the criticisms lobbied at NCLB, it is still a primarily test based regime, which Mathis and Trujillo (2016, p. 6) characterize as, “a test-driven, top-down, remediate and penalize law.” Smith (2017) refers to accountability under NCLB and ESSA as a “punitive testing policy”
where formal rewards or sanctions are applied to aggregate scores. ESSA shifts accountability mechanisms to the states, granting states more flexibility. However, accountability systems are still federally approved through the peer review process. Though Adequately Yearly Targets no longer exist schools are still subject to state-imposed sanctions. Identification of schools in need of improvement is still largely determined by test scores.
Federal policies such as NCLB, RTTT, and ESSA represent reform-driven educational initiatives (Deville & Chalhoub-Deville, 2011) which are often referred to as the global education reform movement (GERM) (Sahlberg, 2011). One component associated with GERM in the context of the United States is a focus on test-based accountability policies for schools. Specifically, school performance and student
achievement are tied to the process of accrediting, rewarding and punishing schools and teachers. The features of NCLB, RTTT, and ESSA outlined above are in keeping with this definition of GERM.
Local Context. Policies within North Carolina are provided below to fully articulate how states use test scores to make high stakes decisions regarding teachers, schools, and administrators. North Carolina uses end of grade assessments (EOGs) in grades three through eight for Math, English Language Arts and Reading. In grades five and eight students also take a Science EOG assessment. End of course assessments (EOCs) include Biology, English II and NC Math I that are typically taken during the high school years.
The following information is based on legal documentation and reports issued from the North Carolina Department of Public Instruction (NCDPI) for the 2017-2018 academic year unless otherwise stated.
Creating an Accountability Index. The accountability indexes used within North Carolina, as mandated by ESSA, depend on multiple factors. As of 2013, three indexes are provided for each public school: achievement, growth, and performance.
School Achievement. There are five indicators used for calculating the school achievement score. Specifically, (1) the percent of students at an achievement level three or higher (of five) on all of the applicable EOG and EOC assessments, (2) the percentage of graduates who complete NC Math 3 with a passing grade, (3) the percentage of grade 11 students who achieve a 17 or higher on the ACT College Readiness Assessment, (4) the percentage of graduates identified as Career and Technical Education concentrators who meet the Silver Certificate or higher on the ACT WorkKeys Assessment, and (5) the percentage of students who graduate high school within four years (NCDPI, 2017a).
Growth. North Carolina uses a value-added model called the Education Value-Added Assessment System (SAS EVAAS) to assess growth on all EOGs and EOCs taken by students. The growth score results in one of three designations: (1) exceeds expected growth, (2) meets expected growth, or (3) does not meet expected growth (NCDPI, 2017a). Value-added models (VAMs) not only identify growth but attempt to associate growth with particular educators or schools (Castellano & Ho, 2013). As an example, VAM estimates can be interpreted as the average amount of achievement growth an
individual teacher contributes to his or her students (Guarino, Reckase, Stacy & Wooldridge, 2015).
Performance. School Performance Grades are a composite of student achievement (80%) and growth (20%) (NCDPI, 2017a). The performance grades are awarded on an A-F scale. Documentation regarding palpable differences between scores on the scale is lacking.
High Stakes Decisions for Teachers. With the passage of the Excellent Schools Act of 2013, teachers are evaluated on six core standards: (1) leadership, (2)
establishment of a respectful environment, (3) content area expertise, (4) facilitation of learning, (5) reflection on practice, and (6) contribution to the academic success of
students (State Board of Education, 2015). The sixth standard is determined by three-year rolling averages of student growth data observed at the individual (70%) and school level (30%). Teachers who are rated as “developing” or below on any standard or who do not meet expected growth are considered “in need of improvement” and are placed on growth plans monitored by their school administrator (State Board of Education, 2015).
North Carolina ascribes to a merit pay plan which allots bonuses to teachers who perform well. Plans vary by county, but all counties included a measure of growth either through the teacher evaluations (standard six) or through explicit inclusion of a growth indicator. The merit-based plan for Avery County, NC is given as an example. Teachers are awarded points based on five criteria: (1) absences, (2) tenure, (3) school growth, (4) the School Performance Grade, and (5) the number of sub-groups taught (State Board of Education, 2017). Teachers working at schools who received a D or F on the School
Performance Grade scale receive zero points towards their bonuses (more points result in higher bonuses). In this plan, growth is considered in both criteria three and four. In addition to the criteria listed above, at the high school level teacher performance is determined by the number of students who earn industry certifications or credentials or scores on Advanced Placement, International Baccalaureate and Cambridge Advanced International Certificate of Education exams. Teacher bonuses can range from $25 to $6,400 (Helms, 2018).
Merit pay bonuses are therefore dependent upon test scores in numerous ways: (1) through the student and school growth accounted for in teacher evaluations, (2) directly through student growth metrics, (3) through the School Performance Grades, and (4) through additional standardized tests at the high school level.
High Stakes Decisions for Administrators. Principal salaries for the 2017-2018 academic year were determined by two factors: (1) the average daily membership in the school and (2) the accountability growth score for the schools supervised by the principal in two of the last three years (NCDPI, 2017b). Of note, principal salary is not determined by education level, or tenure. For a principal at a small school (up to 400 students) the difference in monthly salary between failing to meet your growth model target and exceeding expectations was $1,030 (NCDPI, 2017c). At a large school (over 1,300 students) the salary difference increases to $1,235 monthly. The difference in salary for a principal in the smallest tier school versus the largest was also $1,030, indicating that performance on the growth model is at minimum given equal weighting as school size.
Similar to teachers, principals and assistant principals are eligible for merit bonuses that range from $1,000 to $15,000 depending on student growth (Helms, 2018).
High Stakes Decisions for Schools. The School Performance Grades result in each school being awarded a single grade from A-F. All schools are required to post their scores on their website. Schools which receive a D or an F are required to notify parents of their score. Outside of these provisions there are not currently rewards or sanctions. However, North Carolina operates Opportunity Scholarships which allots private school vouchers to parents looking to move their child from a public to private school. In 2018, 6,452 students received vouchers to attend private schools compared to just 1,216 in 2015 (EdChoice, 2018). While not directly linked, displeasure with public schools could motivate some parents to seek other options.
Similarly, there are no rewards given to schools which rank highly on the School Performance Grade scale or incentives given to schools who need to improve. Legally, there is no requirement for state officials to allocate funds or resources to these schools.
Given the high stakes associated with accountability systems it is necessary to understand how validity is conceptualized in our current testing environment, how fairness is assessed within validity, and what if any improvements are being suggested given the shift to social-unit level accountability.
Purpose
Accountability systems require sound methodologies for providing evidence of fairness to support the use of test scores at the teacher, administrator, or school level. Previous research has examined multilevel DIF frameworks as solutions for the nested
data structure. While scant research has linked multilevel DIF frameworks to the need for teacher and school level fairness evidence in an accountability context (Li, Qin & Lei, 2017), research has addressed the examination of DIF at social-unit levels (e.g. Chen & Zumbo, 2017; Cheong, 2006; Kamata, Chaimongkol, Genc, & Bilir, 2005).
Further research is needed to compare proposed multilevel DIF frameworks. The objective of this study is to investigate the performance of three multilevel DIF
frameworks (multilevel Rasch DIF Model, Kamata, 2001; multilevel Mantel Haenszel, French & Finch, 2013; multilevel SIBTEST, French & Finch 2015) under various conditions. The use of test scores at the teacher and school level is the impetus for this study, therefore, DIF will be investigated at the social-unit level.
While understanding the root causes of DIF is a noble cause, and arguably more important than merely flagging contaminated items, the focus of this study will be on identifying social-unit DIF. This is for two reasons. First, multilevel DIF analyses are in their nacency and few studies have focused on multilevel DIF, particularly while framing the study within accountability. Thus, a foundation for future research is necessary. Second, many of the proposed multilevel DIF frameworks are not suitable for
identification of the root causes of DIF but could be easily implemented by practitioners to identify multilevel DIF.
Current Study
The current study aims to compare three multilevel DIF frameworks: (1) the multilevel Mantel-Haenszel (MMH; French & Finch, 2013), (2) the multilevel SIBTEST (French & Finch, 2015), and (3) the three-level Rasch model (Kamata, 2001). The goal in
such a comparative study is to determine under which conditions frameworks perform well and provide guidelines to practitioners testing for DIF in nested data. This
simulation study adds a systematic investigation of social-unit level DIF to a relatively small body of research.
Similar to French and Finch (2013; 2015) and Wen (2014) the current study examines how factors related to social-unit sample size, magnitude of DIF, and intraclass correlation affect the power and Type I error of multilevel DIF frameworks. However, the current study does so in a comparative setting. Additionally, the current study investigates power and Type I error when impact is present. The power and Type I error rates of the three proposed methods have not been examined under conditions of impact. Lastly, the study assumes a balanced approach to DIF which differs from the dominant approach investigated in the initial studies by French and Finch (2013; 2015).
As an additional consideration this study aims to investigate the accuracy of the DIF effect size measures produced by the three multilevel DIF frameworks. Prior studies have focused on power, Type I error, and ability estimation. However, inference tests of statistical significance are just one component to a well conducted DIF study.
Significance results need to be paired with effect size measures to allow for meaningful interpretation of results. While the adjustments made to the Mantel-Haenszel and SIBTEST only address the test of significance it is imperative to understand how the effect sizes produced by these methods are affected by nested data.
Research Questions
1. How do three multilevel DIF detection frameworks, the multilevel Rasch model, the multilevel Mantel-Haenszel, and the multilevel SIBTEST, compare to each other in terms of power and Type I error under various conditions? 2. Within each multilevel DIF detection framework, what factors have the
strongest influence on power and Type I error (e.g. number of clusters, intraclass correlation, magnitude of DIF, presence of impact, and equivalency of sample sizes)?
3. How accurate are effect size measures produced by the three multilevel DIF detection frameworks?
Organization of the Study
Chapter Two reviews relevant literature on validity, validation, and multilevel validation before turning to DIF and multilevel DIF. The first section describes
theoretical considerations of validity and validation in order to provide a strong rationale for why this study is necessary. The second section introduces DIF methods before
presenting multilevel DIF frameworks. Chapter Three outlines the data simulation design, modeling approach, and criteria by which the results are evaluated. Chapter Four displays the results of the study. Finally, Chapter Five provides a general discussion of the results, implications for researchers, study limitations, potential future directions, and draws connections back to validation and fairness in an accountability context.
CHAPTER II LITERATURE REVIEW
This chapter is organized into two main sections. The first focuses on validity and validation as well modern adaptations which address multilevel data. The discussion will start with a brief overview of validity as presented by prominent researchers and the Standards (2014). Then the relationship between fairness and validity will be addressed, specifically through a discussion of the role of DIF in validation. Lastly, multilevel validation frameworks which are more closely aligned with accountability systems will be presented. Their theoretical underpinnings and supporting methodologies will be addressed.
The second section will focus on the technical aspects of DIF studies. What follows in this section is a general discussion of DIF, the types of DIF and some
generalities of DIF studies, which will be used to lay a foundation for a discussion of the literature regarding multilevel DIF frameworks. The methodology underlying each multilevel DIF framework will be presented before reviewing relevant findings regarding the frameworks power and Type I error under various conditions. Lastly, the method in which anchor items are selected for DIF analyses is discussed as well as the
An Overview of Validity
Messick (1989) defines validity as “an integrated evaluative judgment of the degree to which empirical evidence and theoretical rationales support the adequacy and appropriateness of interpretations and actions based on test scores or other modes of assessment” (p. 13). Messick argues for a unitary, construct-grounded approach to validity. It is not a characteristic of a test per se, rather a function of test scores and uses. Nor is it a quantity you either have or don’t, it is an evaluative judgment regarding the extent to which empirical evidence supports interpretations of scores and upholds their uses. Our current conceptualization of validity is grounded in the work of Messick. Indeed, the current edition of the Standards (2014) frames validity in terms of Messick stating, “validity refers to the degree to which evidence and theory support the
interpretations of test scores for proposed uses of tests” (p. 11).
Kane (2006, 2013) is the counterpoint to Messick’s (1989) philosophical leanings. Kane’s contribution to validity is significant as he lays out a roadmap for practitioners to follow, thus providing actionable guidance rather than theoretical discussion on validity. Kane’s Interpretive Argument (IA; 2006) provides explicit statements of the inferences and assumptions underlying the interpretation and use of test scores. The IA provides practitioners with organized steps to document their validation process. Later, Kane renamed the IA an IUA (Interpretation/Use Argument; 2013) to underscore the importance of interpretation and use in the validation process. While the Standards (2014) conceptualizes validity in terms of Messick they also incorporate Kane and his concepts of validation. Specifically, the Standards define validation as, “a process of
constructing and evaluating arguments for and against the intended interpretation of test scores and their relevance to the proposed use” (2014, p. 11).
As Kane’s (2006; 2013) conceptualization of validation is widely accepted by the measurement field to the extent that its theoretical underpinnings are presented in a guide published by the three preeminent research organizations it will be presented as a
framework for validation. That is not to imply that there are not competing validation frameworks for the consideration of individual level validation. However, Kane’s IA/IUA is instructive for understanding some of the issues surrounding validation work and will serve as a foundation for newer multilevel frameworks.
Interpretative Argument-Interpretation/Use Argument. Kane’s IA/IUA provides practitioners and researchers a tractable method for accruing validity evidence to support the interpretation and use of test scores. The IA/IUA hinges upon Toulmin’s (1958) model for analyzing arguments. Claims are laid out which must be supported by warrants. However, the warrants are generally self-evident and therefore require backing, e.g. evidence. Challenges to the warrant can and should be made which are ideally refutable via the backing. Validity, then, is evaluated in terms of the clarity, coherence, completeness, plausibility, and appropriateness of the claims made (Kane, 2006; Kane, 2013).
An example of an inference and its corresponding claim, warrant, and backing are provided in Table 1. While validation is a context specific process these are given as generalities to highlight the components of Toulmin’s argument model.
Table 1
Example of the Extrapolation Inference
Inference Claim Warrant Challenge Backing
Extrapolation The items on the test are
representative of tasks within the target domain and real world in general.
The construct assessed by the test accounts for the quality of performance in the domain of interest. The universe of generalization is sufficiently different from the target domain in some way that extrapolation from the universe score to the target score is not legitimate (Kane, Crooks & Cohen, 1999, p. 11).
Evidence is accrued via “think-aloud” protocols where examinees think through the processes they use during a task. If these processes are consistent with other tasks in the target domain then confidence in the inference is strengthened (Kane, 2006, p. 36). A second evidence source is the correlation between the score on the test and an external criterion measure (Kane, Crooks & Cohen, 1999, p. 10).
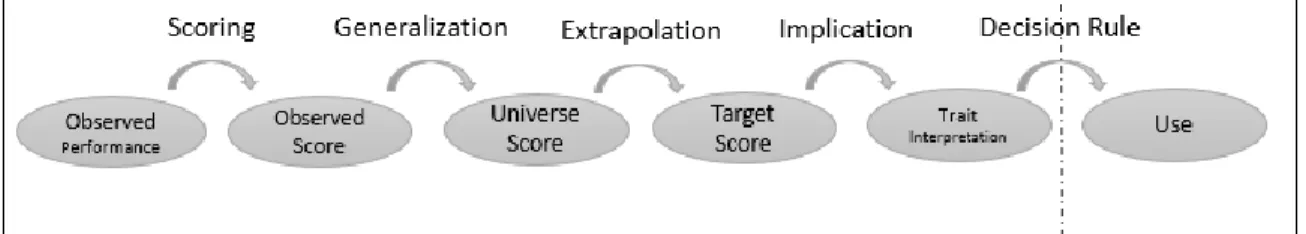
Figure 1 represents a visual of the validation process as laid out by Kane, Crooks, and Cohen (1999) with the addition of use which is addressed in Kane (2013) though never formally visualized. The addition of use at the end of the validation process is warranted given Kane’s separation of evidence evaluation for interpretation and use (2013, p. 47 & p. 56) and is supported in the literature (Chapelle, Enright & Jamieson, 2010). Considered within the decision rule inference, the inference related to use, are consequences. Namely, Kane advocates for the inclusion of three types of consequences: (1) intended outcomes, (2) adverse impact, and (3) systemic effects.
Figure 1. Kane’s Validation Process adapted from Kane, Crooks, and Cohen (1999), Kane (2006), and Kane (2013).
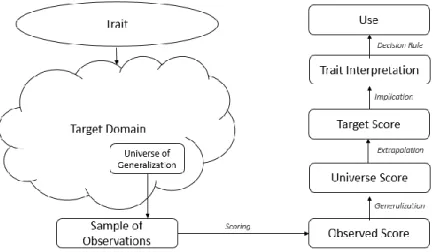
Of note, in Figure 1, while the inferences are presented as separate bridges, a more apt analogy would be as pillars of a bridge. If any one of the inferences which makes up the interpretation argument were to lack strong supporting evidence, then the entire bridge collapses. However, the inferences related to interpretation and use are an exception and remain connected yet separate. Meaning, failure to justify the use of test scores does not automatically invalidate the interpretation of the scores. This separation is represented by the dashed line in Figure 1. Figure 2 represents an expanded view of validation as laid out in Kane (2006) and visualizes terminology introduced in the following discussion.
Examples of the specific claims, evidence, and backing which is needed for each inference will be presented in subsequent sections on validity theory in an accountability context. By situating them as so it is possible to provide a comparison between the claims and evidence needed when considering student level validity and the claims and evidence needed when considering social-unit level validity.
Figure 2. Expanded View of Validation taken from Kane (2006).
The Validation of Use. When considering the validation of use and related consequences there are numerous debates within the field of measurement. First, does the evaluation of use belong in validation and if so is the evaluation of consequences
relevant? Second, which uses are we evaluating: intended, actual, or both? Third, if we are to validate the use of a test, then who should be responsible for evaluating it? And lastly, is the evaluation of consequences relevant only to use?
Although Kane (2013) stressed the equal billing that interpretation and use should be given in the validation process, the decision rule inference and consequences are not necessarily accepted as part of the validation process by the measurement field en masse. Researchers span the spectrum from those that believe use has no place in validation (Borsboom & Wijsen, 2015) to those that believe consequences should be evaluated but not under the heading of validity (Cizek, 2012; Lissitz & Samuelsen, 2007) to those who would take Kane’s inclusion of use and consequences farther (Bachman & Palmer, 2010).
Falling on the inclusionary end of the spectrum, Sireci (2016) typifies the case for why use and consequences should be included in validation. He states, “if tests existed only for their scores to be interpreted, but the scores were never used for any purpose, by definition, they would be usesless tests. Useless tests have no utility and proposing a definition of validity for them is a fruitless endeavor” (Sireci, 2016, pp. 231-232). As presented by Sireci, interpretation and use are interwoven, and a separation as perceived by Kane (2013) is difficult to achieve.
Hubley and Zumbo (2011) lobby for the inclusion of consequences based on two primary arguments. First, they link the evaluation of consequences to issues of construct underrepresentation or construct-irrelevant variance and the construct. As presented by Hubley and Zumbo, score interpretation and use not only cause consequences but are impacted by their consequences. Particularly convincing is their argument that a consequence of score use may result in revised theories regarding the construct and population of interest.
However, Hubley and Zumbo (2011) argue that not all social consequences are due to sources of invalidity. Specifically, they give the example of financially penalizing schools for children’s poor test performance under NCLB. They view this action as test misuse based on external political beliefs or policies. They contend that such social consequences are outside the realm of validity because they are explicitly linked to test misuse.
However, given that tests are designed explicitly for accountability it is difficult to accept that the current practice of using tests due to political policies represents
misuse. Bennett, Kane and Bridgman (2011) specifically reference political policy agendas through their inclusion of intended and unintended negative effects of an assessment system. When listing potential intended effects of two consortium tests used for accountability, the Partnership for Assessment of Readiness for College and Careers (PARCC) and the Smarter Balanced Assessment Consortium (SBAC), they include: (1) making accountability policies better drivers of improvement, and (2) helping education leaders and policymakers make the case for improvement and for sustaining education reforms (Bennett et al., 2011). Both effects are squarely situated in policy, yet Bennett and colleagues also advocate for the involvement of measurement professionals in their evaluation. Clearly within the segment of the field that supports the consideration of consequences within validation disagreement persists as to which consequences should be evaluated.
Hubley and Zumbo’s (2011) second argument is that many actual test uses for measures fall well outside intended test uses and are driven by the desire to bring about personal and social change. Therefore, it is critical to consider the consequences and side effects of measurement in the validation process itself. Some of the specific uses of measures laid out by Hubley and Zumbo are for ranking, intervention, feedback, decision-making, and policy purpose. These uses elucidate a second debate over the inclusion of uses in validation: which uses should we consider, intended, actual, or both?
Sireci (2016) and Moss (2016) each contend that to worry ourselves with intended test uses is not enough. We must also consider the actual uses of tests. According to Moss, actual interpretations and uses are invariably shaped by local users’ purposes and
depend on the local capacity to use the provided information well. As such, the actual interpretations and uses are far more varied than one might assume (Coburn & Turner, 2012; Moss, 2007). Moss asserts that these local interpretations and uses are ultimately a local responsibility, however, she states that measurement professionals should support local educators and administrators in their validation endeavors.
Within Moss’s (2016) discussion of actual test interpretations and uses she makes a direct connection to accountability systems. She states that indirect test uses include score-based incentives intended to raise test scores and the use of test scores to improve schooling. However, the actual uses are far more widespread. In a study by Coburn, Toure, and Yamashita (2009) they found that test scores were used to shape numerous decisions, including: decisions about curriculum adoptions, professional development, and compensation among others. Their work highlights the widespread reach of test results and the multifaceted nature of actual test use.
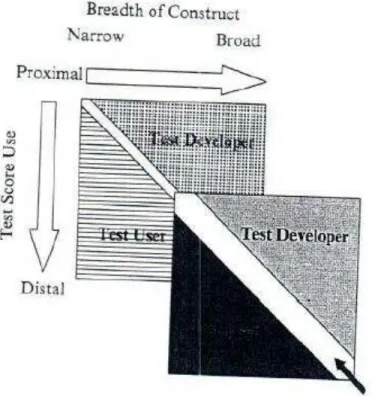
Similar to Moss (2016), Chalhoub-Deville (2009) addresses the burden of evaluating use through her ‘Zone of Negotiated Responsibility’, depicted in Figure 3, which offers a sliding scale for determining if the burden of responsibility falls on the test user or developer. The breadth of construct, test use, and time shape the responsibility considerations for test developers and users. As outlined by Chalhoub-Deville, the broader the definition of construct the more the burden of responsibility falls on the test developer. However, as the actual uses diverge from the intended use the responsibility shifts to the test users. The shift in burden related to time is also related to actual uses. As time passes and unintended interpretations and uses of a test persist the test developer
can no longer ignore those interpretations and uses and must implement validation research to support them.
Figure 3. The Burden of Validation Responsibility as Presented by Chalhoub-Deville (2009).
There is not only debate within the measurement field regarding whether
consequences should be evaluated at all but also whether consequences are only relevant to score use. Kane (2013) explicated three types of consequences which should be evaluated to support the use inference. Zumbo and Hubley (2016), however, disagree that consequences are only related to the use inference and not to test score inferences or meaning. They argue that researchers have typically linked the evaluation of
Hubley view as outside the realm of validation work. Instead they consider consequences to be the impact or effects of legitimate test score interpretation and use. Therefore, consequences are relevant to the validation process as they are inextricably linked to the meaning of scores.
Validation and Differential Item Functioning
The Standards (2014, p. 218) formally defines DIF as “a statistical indicator of the extent to which different groups of test takers who are at the same ability level have different frequencies of correct responses”. Thus, DIF studies attempt to quantify construct irrelevant variance by assessing whether item responses differ for examinees with the same ability level but in different groups (Dorans & Holland, 1993). Within the Standards (2014), DIF appears in both the chapter on fairness and validity.
Within the Standards (2014), the chapter on validity presents five sources of validity evidence. Specifically, evidence should be collected which relates to (1) test content, (2) response processes, (3) internal structure, (4) relations to other variables, and (5) consequences of testing. DIF studies are proposed as providing validity evidence based on internal structure. DIF studies speak to internal structure by highlighting whether particular items function differently for “identifiable subgroups of test takers (e.g., racial/ethnic or gender subgroups)” (Standards, 2014, p. 16). However, the views espoused by the Standards are not universally accepted and research has been put forth which challenges our conceptualization of these topics and pushes the field of
The Standards (2014) defines construct underrepresentation as “the extent to which a test fails to capture important aspects of the construct domain that the test is intended to measure,” conversely construct-irrelevant variance is “variance in test-taker scores that is attributable to extraneous factors that distort the meaning of the scores” (p. 217). DIF studies allow for the statistical detection of construct-irrelevant variance that is contingent upon group differences. Thus, ensuring that scores obtained from tests are unbiased and reflect the same construct for all examinees (Walker, 2011).
However, Gomez-Benito and colleagues (2018) argue that DIF studies provide broader validity evidence than is implied by the Standards (2014). Rather than being limited to evidence for internal structure, they view DIF studies as speaking to the intended interpretation of test scores holistically. Gomez-Benito and colleagues assert that distinguishing DIF from actual differences in the abilities of test takers and determining whether DIF items are measuring the intended construct are fundamental validity issues undertaken in the pursuit of fairness.
Kane’s IA/IUA (2006; 2013) is not the only approach to validation work, indeed there are many approaches presented in the literature. Salient here is Sireci’s
deconstructed approach to validation (2016) which relies on explicitly stating the
purposes of testing and using the five sources of evidence (as presented in the Standards, 2014) to support those explicit purposes. Gomez-Benito and colleagues give explicit examples of how DIF related work can extend to all sources of evidence, thus firmly ingraining DIF analyses in overall validation work. Their examples are presented in Table 2.
Table 2
DIF as a Source of Validity Evidence (Gomez-Benito et al., 2018)
Source of validity evidence DIF validation work Test content Is construct representation similar for
identifiable groups of the intended population?
Are there differences in the accessibility of test content?
Is any content in the items flagged for DIF irrelevant to the construct measured? Response processes Do the items tap the same intended
process delineated in the test specification for identifiable groups?
Internal structure Are the relationships among items or part of the test similar for different groups of test takers, i.e. dimensionality?
Does an item measure a
construct-irrelevant dimension for some examinees? Relations to other variables Are the relationships between item/test
responses and external criterion following the same pattern for identifiable groups of the intended population?
Consequences of testing Are unintended consequences of testing arising from construct-irrelevant
components or construct underrepresentation?
Does the presence of DIF items lead to different pass rates for identifiable groups?
Gomez-Benito and colleagues (2018) make a clear argument for considering DIF analyses as an integral part of validation work. Additionally, they demonstrate how DIF analyses and subsequent analyses related to findings from DIF studies can provide evidence for the other evidentiary components laid out in the Standards (2014). In doing so they call for an expansion of what we consider DIF work well past statistical studies to alert measurement professionals to potentially troublesome items.
Zumbo (2009) also views DIF analyses, their methodologies, and impacts as evolving. He categorizes DIF analyses as belonging to one of three generations. The first generation of DIF, more commonly used the term item bias and conflated issues of impact and DIF. The second generation is signified by the adoption of the term DIF and impact, as well as the introduction of new statistical DIF methodologies. The focus during the second generation is on detecting items and distinguishing impact from bias rather than on discerning root causes for DIF. During the second generation of DIF popular methodologies included contingency tables, regression models, and the use of unidimensional and multidimensional item response theory.
The third generation is characterized by what Zumbo (2009, p. 229) refers to as a subtle but extremely important shift to conceiving DIF as occurring, “because of some characteristic of the test item and/or testing situation that is not relevant to the underlying ability of interest” (emphasis original). Zumbo’s assertion is salient as we consider the examination of DIF in the era of accountability. This third generation of DIF analyses should consider contextual variables such as classroom size, socioeconomic status, teaching practices, and parental styles. All of which, Zumbo asserts, have typically been ignored in DIF analyses. Including these contextual variables aligns well with the notion that we need to investigate those contextual variables to ensure that the use of test scores at higher social-units levels is valid.
Building on Zumbo’s (2009) description of the third generation of DIF analyses, Gomez-Benito and colleagues (2018) challenge the notion that item bias and DIF remain separate concepts. They assert that psychometricians and measurement professionals
have moved past, “statistical analysis which flagged items for DIF to combining statistical findings with substantive explanation regarding the construct
underrepresentation and/or construct-irrelevant cause of the differential item
performance” (p. 5). This evolution has come about precisely because of advances in modeling (Chen & Zumbo, 2017; Zumbo, Liu, Shear, Olvera, Ark & Ark., 2015).
Multilevel Validation: Context, Accountability, and Methodologies
While validity theory has evolved during the time of NCLB, RTTT, and now ESSA, there remains debate as to if validity theory, as presented above, adequately addresses issues that arise under accountability systems. Chalhoub-Deville (2016) contends that our traditional validity frameworks are inadequate for guiding validation work due to the broad claims at the individual, group, and social system level inherent in GERM movement assessments.
However, there lacks a clear path in the literature for what adequate validity theory looks like under an accountability system. Attempts have been made to outline validation for accountability purposes by modifying existing frameworks (Haertl, 2013), however, these attempts stop short of purposing a new framework explicitly designed for score interpretation and use in the context of accountability. Additionally, systems of item response have been purposed which highlight the multilevel nature of current testing contexts (Chen & Zumbo, 2018; Zumbo et al., 2015). These multilevel theories highlight not only the need for addressing validation for social-unit level test use but also for addressing context as it relates to individual score use and interpretation and for determining root causes of DIF.
Modifying an Existing Validation Framework for Accountability. An example of modifications which can be made to Kane’s IA/IUA (2006; 2013) will be given here as it elucidates key issues in using test scores at the social-unit level. Then, a proposed visual framework regarding the process flow of this modified validation framework will be presented.
In a discussion on value-added modeling (VAM), Haertl (2013) highlights the complexity of validation in an accountability context. Haertl adjusts Kane’s Interpretative Argument-Interpretation/Use Argument (IA, 2006; IUA, 2013) to discuss the validity of score interpretation and use at the teacher level. However, his discussion and
modifications are applicable to other uses of aggregated scores.
Each inference will be presented as it originally was in Kane’s (2006; 2013) work and as presented by Haertl (2013) in the context of VAM scores for teacher rewards or sanctions.
Scoring. Traditionally the observed performance would be a student’s responses to items, free responses, or performance on a performance assessment. In Kane’s IA/IUA (2006; 2013) the observed performance should be understood in this manner. Scores should be comparable across tasks, raters, and test forms (Kane, 2006).
On the other hand, when validating the use and interpretation of VAMs, Haertl (2013) contends the observed performance is that of the teacher. Rather than test items, the scores of examinees are used as measures of their performance. Moving from the teacher’s classroom performance to their VAM score (e.g. the scoring inference) must be
relatively undistorted by irrelevant factors (Haertl, 2013). Therefore, scores must be free from any systematic bias (Haertl, 2013).
Generalization. Generalization extends the observed performance on a set of tasks to an expected score for a universe of performances that would be considered exchangeable with the current task. The universe of performances is referred to as the universe of generalization and the expected score is referred to as the universe score. At the student-level, generalizability and reliability studies provide estimates of standard errors of measurement and therefore put limits on the precision of estimates of the universe score (Kane, 2006).
When using aggregated scores in a VAM, reliability is still the primary concern of the generalization inference. The stability of VAM scores can be quantified by
correlating VAM scores at two points in time or from two sections of the same class (Haertl, 2013). High correlation coefficients would imply stable VAM scores.
Extrapolation. Extrapolation extends the inference from the universe score to the larger universe of performance that is of interest, the target domain. The universe of generalization represents a small subset of the target domain. A key threat to
extrapolation is construct-irrelevant variance. Construct-irrelevant variance may result in scores that are systematically higher or lower for identifiable groups of examinees and in inappropriate score interpretations and uses (Standards, 2014). Items which introduce construct-irrelevant variance decrease the degree to which we can claim to have
supported the interpretation of scores across multiple groups of test takers. According to Kane (2006), extrapolation can be supported via analytic and empirical evidence.
At the student-level, analytic evidence may include: (1) examining the
relationship between the processes employed in responding to test tasks and other tasks in the target domain via think alouds and (2) face validity. Empirical evidence may include: (1) criterion-related validity, establishing a direct link between test scores and a valid criterion measure; (2) generalization across new situations or populations of examinees; (3) convergent validity evidence as measured by the correlations between different measures of the trait; and (4) results from a multi-trait multi-measurement study.
Use of aggregate scores at the social-unit level, such as in a VAM, requires evidence linking the VAM scores to broader notions of teacher effectiveness to support the extrapolation inference. When adapting Kane’s IA/IUA (2006; 2013) for use with teachers and VAMs, the concern remains: is there construct-irrelevant variance which is jeopardizing our score interpretations and uses?
Haertl (2013) contends that evidence must be collected which addresses the following questions: (1) how well does the VAM score correspond to other kinds of information about teaching quality?, (2) how much do the estimates change if a different test is used?, (3) do the achievement tests reflect the range of desired cognitive outcomes, and (4) is it possible to extrapolate beyond test scores to a broader range of schooling outcomes?. This evidence may be collected through qualitative methods such as
classroom observations and in-depth interviews. Empirical evidence includes calculating VAM scores using different subtests from a given assessment for the same students and teachers.
Implication. Implication extends the target score to a verbal description of the trait. Accountability legislation impacts the implication inference for students and at the social-unit level. Specifically, NCLB mandated students be categorized into three proficiency levels (basic, proficient, advanced) based on test scores. Some states added additional levels related to college and career readiness (e.g. North Carolina). Evidence which can support the student level interpretation includes: (1) longitudinal studies of school and college performance and (2) correlational studies between school performance (e.g. GPA) and test scores to support labels such as “grade level proficient” (Beimers, Way, McClarty, & Miles, 2012; O’Malley, Keng, Miles, 2012).
While Haertl (2013) does not provide specific evidence needed to support the implication inference, evidence accrued through qualitative methods documenting teacher quality and efficacy would support the use of VAM scores to make
categorizations of teacher efficacy.
Use. Use, as described by Kane (2013), specifically regards evaluating three types of consequences: (1) intended outcomes, (2) adverse impact, and (3) systemic effects. The extent to which consequences must be evaluated and supported with evidence is tied to the stakes of the testing program. According to Kane, the evaluation of consequences is imperative if decisions to be made are high stakes.
While sanctions at the student level are not currently a focus of accountability policy, the emphasis on the use of test scores as a vehicle for student learning and
achievement has student level implications. Even when test scores are explicitly designed for use at the social-unit level, the resulting policy decisions would impact students,
teachers, and the larger community. Forer and Zumbo (2011) refer to consequences which are felt at multiple levels as cross-level consequences.
The same types of consequences are relevant at the social-unit level. Haertl (2013) describes unintended negative consequences of the use of VAM scores to make high stakes decisions as: (1) a decrease in career satisfaction as teaching becomes more prescriptive due to pressures to teach to the test, (2) more competition and less
cooperation among teachers, (3) less supportive peer and mentoring relationships with new teachers, and (4) resentment or avoidance of students who do not learn easily.
The discussion of consequences here is limited to the use of student level or aggregate test scores.
Visualizing a Framework for Accountability Systems. Haertl (2013) provides an example of modifying Kane’s IA/IUA. However, in this framework there lacks an
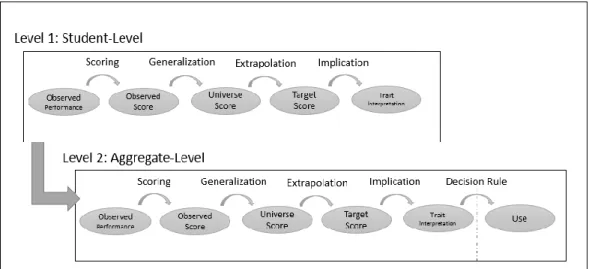
interaction between student and social-unit level evidence accumulation. Within an accountability system, validation would be undertaken at both levels. Figure 4 outlines one potential framework for the organization of collecting student- and social-unit level evidence.1
The relationship between the student- and social-unit level is comparable to the relationship Kane (2013) lays out for interpretation and use. A lack of evidence to support social-unit level validation does not necessarily invalidate the interpretations and uses of test scores at the student level. Nor does support for validation at the social-unit
1 Figure 4 represents a visualization based on work presented by Karen Hoeve, Jeremy Acree, and JB Weir in UNCG ERM’s Validity and Validation course in Fall 2017.
level validate the interpretation and use of test scores at the student level. However, a lack of evidence at the student-level would be a red flag that aggregating scores is inadvisable. Additionally, some analyses may provide relevant evidence for both levels.
Figure 4. Kane’s IUA Adapted to Reflect Test Use in an Accountability System.
The treatment of use in this framework is variable and is dependent upon the intended and actual uses of a test and accountability index. For instance, current reform-driven educational initiatives link school performance and student achievement to the process of accrediting, rewarding and punishing schools and teachers (Chalhoub-Deville, 2016). Under such systems the intended test use is not at the student level rather at the social-unit level. While the intended use would need to be evaluated at the social-unit level, it is likely that there would be actual test uses which spanned both the student and social-unit level. Additionally, there may be unintended negative effects which span both levels. Lastly, improved student learning and performance is at the heart of accountability systems and while the consequences are typically at the social-unit level they are enacted
to bring change about at the student level. Thus highlighting, the necessity of linking student and social-unit level validation.
An Alternative Conceptualization of Multilevel Validation: Multilevel Constructs and Contextualized Response Processes. Zumbo and Forer (2011) address validation by considering multilevel constructs. They define multilevel constructs as those which have meaningful uses and interpretations at the individual and social-unit levels. To interpret or use data at the aggregate (e.g. social-unit) level, one must also present validity evidence at the aggregate level (Zumbo & Forer, 2011).
Zumbo and Forer (2011) present a step by step procedure for conducting
multilevel construct validation, which is adapted from Chen, Mathie, and Bliese (2004). The five steps in their framework are:
1. Define the construct across levels of analysis; 2. Articulate the nature of the aggregate construct;
3. Determine the psychometric properties of the construct across levels of analysis;
4. Ensure that there is construct variability across levels of analysis; 5. Examine the function of the construct across levels of analysis.
Forer and Zumbo (2011) utilize these steps to provide construct validation evidence for the Early Development Instrument, a school readiness assessment of
kindergartners. While the test is an individual assessment, it is purely designed to be used for policy and planning by educators and administrators. Thus, it represents a multilevel construct. Their utilization of the multilevel construct validation process results in two
significant conclusions which are relevant to multilevel validation in general. First, multilevel construct analysis is necessary to ensure that the structure and function of a multilevel measure are isomorphic across any level of aggregation. Second, one cannot assume the construct is the same at all levels of aggregation merely because they represent aggregation. Significantly, dimensionality must be addressed at all plausible levels of aggregation.
Multilevel validation should not only address issues of multilevel constructs but also the contextual nature of testing. Zumbo and colleagues (2015) and later Chen and Zumbo (2017) present an ecological model for considering response processes. Response processes are defined as mechanisms that generate observed test score variation
(Embretson, 2010; Messick, 1995). Zumbo and colleagues (2015) consider evidence focused on why and how people respond to items as they do to be central evidence for measurement validation. Within their ecological framework, they explicitly address multilevel DIF analyses as integral to providing validation evidence.
Zumbo and colleague’s (2015) work utilizes Brofenbrenner’s (1994) ecological systems theory which is popular in the social sciences as a basis for understanding the interaction between examinees and test items. They also build upon Chalhoub-Deville’s (2003) ability-in language user-in context theorem while acknowledging that her
description of construct is generalizable beyond language assessment. Particularly salient for the ecological model of item responses is the notion that “ability and context features are intricately connected and it is difficult or impossible to disentangle them”
(Chalhoub-Deville, 2003, p. 372). Due to the interconnection of contextual features, ability, and item response a broader framework for examining response processes is necessary.
Such a framework is presented in the ecological model of item responding (Chen & Zumbo, 2017; Zumbo et al., 2015). Zumbo and colleagues explicitly view this
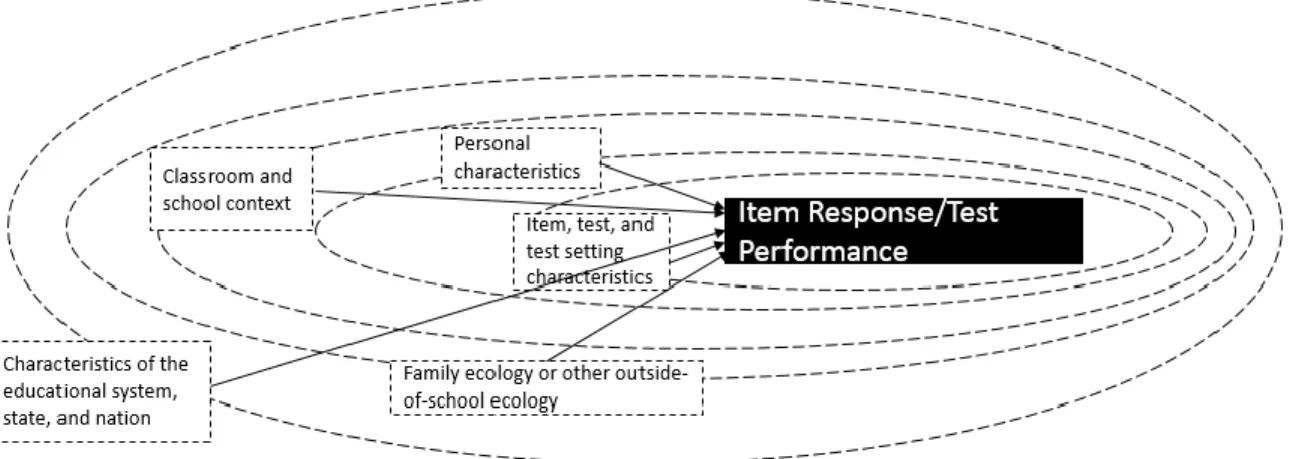
ecological model as the foundation for the statistical and psychometric methodology of DIF analysis. This model provides a contextualized and embedded view of response processes and is presented in Figure 5. In particular this model is appropriate for educational testing, but adjustments could easily be made to better suit licensure and certification settings.
Figure 5. Zumbo et al.’s (2015) Ecological Model of Test Taking.
At the most immediate level are item and test properties, such as the content of the test, format of the test, and the test’s psychometric properties (Chen & Zumbo, 2017; Zumbo et al., 2015). The next layer, which is typically the focus of DIF studies, includes student characteristics. However, it is the outer levels that are particularly informative in an accountability context. Moving outward the next layers include the classroom and
school context, family or outside of school ecology, and the characteristics of the education system and nation state.
Framing validation work within an ecological framework has multiple significant outcomes. First, understanding how social-unit level characteristics impact item response and test performance becomes salient. This outcome is particularly relevant in an
accountability context where score use is happening at the social-unit level.
Second, moving to an ecological framework challenges the notion that DIF analyses be limited to identifiable subgroups as proposed by the Standards (2014). Zumbo and colleagues (2015) argue for the use of latent class modeling to detect DIF between groups which are not identifiable via observed characteristics. Their reasoning hinges on the fact that levels of the ecological system may interact in ways that are unobserved. For instance, as opposed to focusing on gender based DIF analyses, a more modern take on DIF would move past focusing on biological sex differences and consider gender as a social construct. Therefore, considering the influence of institutionalized gender roles, classroom size, socioeconomic status, parental styles and how all these factors may shape the construct of gender (Zumbo et al., 2015).
The study of DIF for observable characteristics beyond the student level
represents a middle ground to DIF analyses as they are currently conducted and the latent approach espoused by Zumbo and colleagues (2015). To extend the gender example given above, perhaps student level differences due to gender vary in severity dependent upon a social-unit variable, such as the gender of a teacher. Numerous interactional