Predicting room occupancy with a single passive infrared
(PIR) sensor through behavior extraction
Yordan P. Raykov
ARM, Cambridge
NCRG, Aston University, UK
Emre Ozer
ARM
Cambridge, UK
Ganesh Dasika
ARM
Austin, TX, US
Alexis Boukouvalas
Molecular Sciences
University of Manchester, UK
Max A. Little
NCRG, Aston University, UK
Media Lab, Massachusetts
Institute of Technology, US
ABSTRACT
Passive infrared sensors have widespread use in many applica-tions, including motion detectors for alarms, lighting systems and hand dryers. Combinations of multiple PIR sensors have also been used to count the number of humans passing through doorways. In this paper, we demonstrate the potential of the PIR sensor as a tool for occupancy estimation inside of a monitored environment. Our approach shows how flexible nonparametric machine learning algorithms extract useful in-formation about the occupancy from a single PIR sensor. The approach allows us to understand and make use of the motion patterns generated by people within the monitored environ-ment. The proposed counting system uses information about those patterns to provide an accurate estimate of room occu-pancy which can be updated every 30 seconds. The system was successfully tested on data from more than 50 real office meetings consisting of at most 14 room occupants.
INTRODUCTION
The increasing focus on designing human living environments that are responsive to the people that inhabit them, raises the demand for energy efficient and cost effective sensing devices that are capable of counting the number of occupants in a room. Existing systems for estimating the number of occu-pants within a monitored room can be divided into two classes: mechanisms that use a set of sensors which cover the whole area of interest, and mechanisms that use simple sensors to count individuals passing through all entry and exit locations. Sensors that monitor the whole area of interest are typically visible light and thermal cameras which are expensive and suffer from low accuracy in crowded areas. Systems that track movements at entry and exit locations using simple motion sensors (e.g., passive infrared (PIR) sensors, break-beams,
me-chanical barriers, etc.) can be inaccurate due to their inability to correctly identify the number of individuals passing through these locations when that number becomes large. In addition, such systems often require specific physical siting in the en-vironment which usually entails costly specialist installation ([31], [18], [9]). These shortcomings raise the demand for systems that can provide an accurate human occupancy count in a closed environment, while being simple enough to install by a non-expert, and that rely on low-cost data sensing devices with low computational power. Simple, low-cost PIR sensors can be readily obtained for less than $10 at time of press. PIR sensors are already employed in commercial buildings for various tasks related to human motion detection such as con-trolling light switches [16] and triggering burglar alarms [22]. Systems using distributed networks of PIR sensors placed in hallways and gateways of closed facilities to count the number of people entering or exiting are well-studied ([20], [32], [34]). By contrast to previous systems, we investigate the potential of using a single low-cost PIR sensor for counting the number of people inside of its field of view and propose a novel system that relies on a single sensor to monitor a chosen room. We ex-tract motion patterns from the raw sensor data with an infinite hidden Markov model (iHMM) [3] and use those patterns to infer the number of occupants using basic statistical regression methods. This system is well-suited to the adaptive setting on active deployment whereby the iHMM readily finds new motion patterns in the signal as new data arrives.
We demonstrate the system configured to estimate an occu-pancy count on various time windows ranging from 30 seconds to 20 minutes. The result of these tests show that this approach can accurately estimate room occupancy count to within±1 for time windows of less than 2 minutes. We also explore the challenges imposed by using a single PIR sensor in terms of the monitored room size, maximum number of distinguishable occupants, and the restrictions imposed by the sensor’s range and view angle.
CHALLENGES OF HUMAN OCCUPANCY COUNTING WITH SINGLE PIR SENSOR
The aim of this work is to obtain an accurate online estimate of the number of occupants in an office meeting using data from a single PIR sensor sitted inside of the room. The simplicity of the sensor will necessarily create some specific challenges that must be carefully considered when modeling the data. A PIR sensor outputs the change in temperature of a passing body compared to the background temperature of the field of view, therefore we need to verify the sensitivity of our findings to the choice of a monitored room in which each experiment is performed. Since most infrared radiation is reflected from the human body, occupants within the monitored environment can be easily blocked from the field of view of a single sensor by other occupants. In addition, because the digital output of the sensor saturates at a maximum value, there is a limited range motion that we can actually differentiate with this type of sen-sor. For example, if two or more people are sufficiently active and close to the sensor to generate more than the maximum range of detectable motion, the sensor would be unable to detect the motion patterns of the rest of the occupants. That is, the occupants occlude each other not only by physically con-straining the field of view of the sensor, but also by exceeding the maximum range of motion that the PIR can measure. We notice that more occupants would on average generate in-creasing range of motion as long as we observe them for long periods of time. Therefore, a simplistic approach to estimate occupancy is to assume that occupancy count increases with the increase of motion. However, within short observation time windows (e.g. 30 seconds or less) it is likely that the tem-porally local behavior of particular individuals will undermine this assumption. Therefore we need to carefully handle such temporally local behaviors to extract properties of the global behavior of interest, whether a participant is in the room or not.
RELATED WORK
Occupancy counting in an environment is a crucial task in human sensing and as such it has been widely studied. Yet, it is typically approached by employing either a occupancy count sensor that covers the entire area of interest, or keeping a tally of people entering and leaving at all entry and exit points. While the first approach is generally more accurate, the higher price and energy consumption of these systems makes them prohibitive for many real-world applications.
1. Person-counting sensors that cover the entire area of interest usually consist of high resolution video, stereo cameras and thermal imaging devices. A tracking algorithm is used to count human bodies from the image, for example by us-ing supervised machine learnus-ing from dot-annotated images [17], or using head-detection algorithms from stereo camera images [29]. [6] used unsupervised machine learning to seg-ment components of homogeneous motion before applying Bayesian regression, and this approach shows promising improvements for locating and counting people in crowded places from video data. [31] proposed a real-time network that does not depend upon object tracking, which makes the scheme much less computationally prohibitive; the high
cost of the data acquisition device still remains an issue though.
2. Considerable effort has been invested in trying to avoid the need for expensive devices. Most progress in that direction is obtained by systems that rely on counting at all entry and exit locations of a closed environment ([11], [33]). For example ([34], [32]) placed three PIR sensors in a hallway to identify direction of movement and relative location of people passing. [1] instead combined PIR sensors with reed switch door sensors for occupancy counting with the purpose of optimizing the energy consumption of an office building. [30] presented a similar approach, but using only PIR sensors at all entries and exits.
3. Alternative systems use multiple low-price sensors at differ-ent locations which are tied through a probabilistic model that combines information from the different outputs [13]. [8] used a probabilistic belief network to model occupancy based on data from multiple PIR sensors (4 PIR sensors per room) placed on the walls rather then entry/exit loca-tions. This method assumes that the number of occupants is constant over time and that the system can be trained on typ-ical behaviors common for the monitored room. The belief network is calibrated on historical data for the monitored rooms and does not adapt after the training stage, which makes the system highly dependent on the historical data and sensitive to non-observed behavior. [15] used hidden Markov models to quantify occupancy count from extracted features of multiple types and locations of energy-efficient sensors. This approach shows average accuracy of 80% in open-plan buildings, where accuracy here is the number of correctly estimated points divided by total number of points. 4. Assuming unlimited resources, perhaps the most accurate occupancy count can be obtained from systems that make use of both expensive sensors to monitor larger areas of a building, multiple motion based sensors monitoring each en-trance and exit, historical data of building occupancy,CO2
sensors and smoke detectors etc. ([21], [9]). In the sim-plified case of single room monitoring, much research has been directed towards systems with diverse sets of sensors that are able to infer comprehensive human activity ([14], [5]), but the focus of such systems is behavior modeling rather then occupancy counting, and these systems therefore have high complexity and cost.
In contrast, we suggest using a single PIR sensor and flexi-ble probabilistic model to model simpler behavior that are closely related to the number of attendees.
SYSTEM OVERVIEW
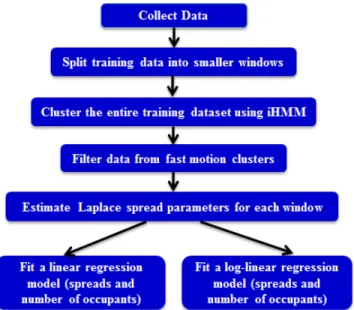
In this section we describe the key stages in our proposed solution to occupancy estimation (Figure 1). The data acqui-sition process and the statistical nature of the recorded PIR output is discussed in detail in the Experimental setup. We split the training data into different time windows of PIR out-put to examine the duration of signal sufficient to accurately estimate number of monitored people. Once data has been partitioned to smaller time windows, all of the training data is clustered using iHMM in order to extract physical behavior
Figure 1. Architecture of the proposed occupancy counting system.
of interest from the raw PIR signal. The behavior that biases the occupancy estimation is filtered and we model the remain-ing data usremain-ing Laplace distribution. The estimated Laplace parameters describe well how populated a meeting has been and can be efficiently used in a regression model. Different re-gression models are used for more and less occupied meetings to maximize estimation accuracy.
Figure 2. Image of the data acquisition board consisting of a NUCLEO F401-RE mbed microcontroller board with a single PIR sensor on a PCB connected to the ADC port of the microcontroller through the Arduino connector.
EXPERIMENTAL SETUP
Collection devices
In this study we attached a single PIR motion sensor (Pana-sonic NaPiOn series AMN21111) on a PCB to an ARM mbed NUCLEO F401-RE microcontroller board, powered through a USB cable that connects it to a laptop. The PIR sensor is an analog output sensor as opposed to digital output ones in NaPiOn series. It is a standard type PIR, 14.5mm tall, lens
surface area 9.5mm and 9.8mm mounting hole. It has 5m de-tection range, horizontal view of 82oand top (vertical) view of 100oand records approximately 30 single dimensional digital measurements per second. The PIR is connected to the 12-bit ADC embedded in ST Nucleo-F401-RE microcontroller as shown in Figure 2. We use the mbed compiler to read the ana-log values from the PIR. The mbed compiler uses a function to convert analog values to digital in a range from 0.0 to 1.0 where 0.0 represents 0 volt while 1.0 represents Vdd. Analog values between are represented by a floating-point number between 0.0 and 1.0. The board is placed in the middle of the room, adjacent to the wider wall in rectangular rooms, with the sensor facing the room interior. The height at which the sensor is positioned varies (between 0.70m and 1.00m). The analog data generated by the sensor is sent to the ADC inside the microcontroller that converts analog data to digital, which is then transmitted to the laptop through the USB interface for further processing.
Figure 3. Example of a monitored room with no occupants inside. The board placed in a typical position in the middle of the room at 1m height.
Data collection
The data acquisition board is deployed in 7 different confer-ence rooms (see Figure 3) in an office building, where the rooms vary in dimensions, access to sunlight and maximum occupant capacity. Data has been collected from randomly chosen real meetings in the company and so there is variation in the number of individuals and the nature of each meeting. The monitored meetings involved white board sessions; seated formal meetings; slide presentations; shared conference calls etc. The board was carefully placed in the middle of the room, in order to maximize the PIR sensor coverage. Upon the start of each meeting sensor data was recorded where the first and the last five minutes of the recorded PIR sensor data are re-moved to account for the system installation and occupants to settling in. Note that the start and the end of a meeting can be automatically detected from the PIR output with great accuracy. However, at the begining and at the end of a meeting true number of occupants changes quicker than the system fastest response time, making the labelling of the ground truth inaccurate.
Sensor data description
The analog output of the PIR sensor is converted to real num-bers in the range of 0.0 to 1.0 with 4 decimal place. The temporal fluctuations in this signal reflect certain movements
Figure 4. Raw digital data recorded using the standard digital PIR sen-sor for 10 seconds.
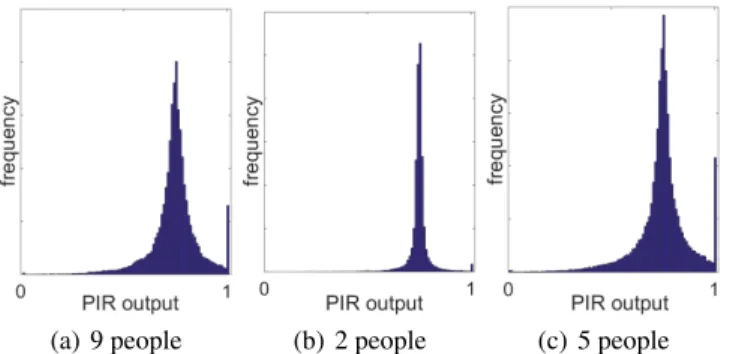
in the monitored environment (Figure 4). When there is a lot of movement in the room, the PIR analog output reaches the maximum value, which, in turn, is converted to 1.0 by the ADC. The challenge we are addressing entails analyzing these fluctuations to infer the number of people occupying the monitored room. The PIR output for a typical 1 hour meeting comprises a set of approximately 120,000 real numbers. Figure 5 depicts the statistical distribution of the sensor data from different meetings, which ignores the time ordering of the data. The sharp peak in the distribution at the median value, combined with the fat tails and the truncation at the maximum ADC output 1.0 suggest that for longer durations the PIR data is well described by a mixture of a truncated Laplace distribution centred at the median value, and a Dirac delta distribution centered at 1.
(a) 9 people (b) 2 people (c) 5 people Figure 5. Histogram of raw PIR data from three different meetings with varying number of occupants and approximately 1 hour duration.
LAPLACE MODELLING
We showed that the PIR output for long segments of differ-ent meetings is well described with a mixture of a truncated Laplace distribution and a Dirac delta distribution centred at 1.0. Ignoring the spike, it is then reasonable to model the data from different meetings with different Laplace distributions, xj∼L(µj,bj)wherexj denotes the sensor data stream of PIR measurements from meeting jcollated into a single vector, and(µj,bj)are respectively the location and spread parameter of the Laplace. We estimateµ1, . . . ,µJandb1, . . . ,bJusing:
µj=median(xj),bj= 1 Nji:x
∑
i∈xj xi−µjwhereJdenotes the number of training meetings (in this study
J=53) andNjdenotes the number of PIR output points for
meetingj. In Figure 6 we plot eachµjandbjagainst the num-ber of people that have been present at meeting j. While the location parameters do not vary substantially across meetings, we observe that meetings with higher occupancy are indeed more likely to have larger spread, as expected. In addition, we notice that the relationship between the count and the spread parameter changes quite substantially for meetings with more than about 8 occupants. Examination of the monitored rooms shows that assuming normal seating patterns 8 occupants are the most that can fit within the field of view of the standard PIR type sensor without occupants occluding each other. We be-lieve this is a limitation of the monitored environment and the position of the PIR sensor, rather than our proposed counting algorithm.
(a) Laplace spread
(b) Laplace location
Figure 6. Number of occupants for different meetings plotted against the Laplace parameters.
Regression component
The small amount of regression data coupled with the sin-gle predictor variables make the generalized linear models (GLMs) an appropriate parsimonious choice for modeling the dependence between the Laplace spread parameter and the occupancy count. We will treat low occupancy meetings with fewer than 8 occupants separately from the ones with 8 or more occupants, where for most practical purposes we need an unsupervised way of switching between those two regressions. The easier, but less accurate approach would be stratifying at a hard value ofb0.09, however later when we introduce a behaviour extraction stage, we will be able to tackle the swithing more efficiently. Multiple types of GLM regressions were compared in terms of mean absolute error; the best fit for meetings with up to 7 occupants is obtained with a linear model with Gaussian outputs; for the second strata of high occupancy meetings a log-linear model with Poisson outputs as for high occupancy meetings the number of occupants in-creases exponentially with the spread parameter.
The mean absolute error for the low occupancy strata (less than 8 individuals) is less than±1. This suggests that with Laplace parameters estimated from the PIR data from an observed meeting, we can identify the number of occupants to within±1 individual. For the high occupancy strata the count prediction accuracy is reduced, but some relationship can be captured with mean absolute error of the log-linear model less than ±1.25 individuals.
While there exist much more complex regression models which could be used (e.g. support vector regression, kernel re-gression, Gaussian process regression or convolutional neural networks), they require substantial amounts of memory, com-putational power and training data. Furthermore, with such complex models, the model is hard to interpret. Specifically, these models often have large numbers of parameters and it is extremely difficult to predict from an analysis of the trained model what the effect on the occupancy count prediction will be when varying any one of these parameters. For example, support vector regression requires that all support vectors are held in memory, and requires quadratic programming to train the regression model [25]. Similarly, while convolutional neural networks have been used to solve difficult regression problems to high prediction accuracy ([4], [12], [23]), these require vast amounts of training data and computational power which makes them generally out of reach of low power em-bedded microcontroller systems.
By comparison, GLMs, because they lead to convex opti-mization problems in parameter training, can be trained using simple gradient descent algorithms.
Time window duration
The Laplace spread parameters for each meeting were esti-mated from all of the PIR data for that meeting, most often approximately an hour. Therefore, to make a prediction for the occupancy count, we have to wait the whole duration of the meeting. To be practical, the system needs to be able to work for much shorter time windows.
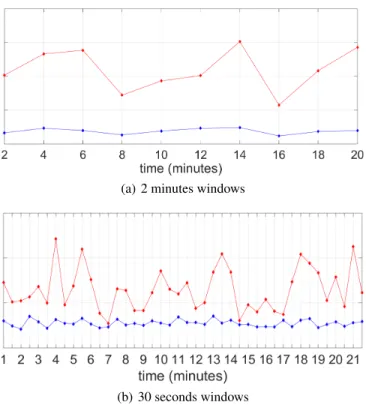
We next investigate this by fitting a Laplace distribution to shorter time segments of the raw sensor data. Instead of esti-mating parameters from the data for the whole meeting, we estimate the same Laplace parameters for every 2 minutes time windows, that is we partition each meeting in multiple smaller, non-overlapping time windows. The problem we will face is that shorter time segments of PIR data are more conflated with short-term individual behavior which is not representative of the current number of occupants. Figure 7 shows estimates of the spread parameters evaluated every consecutive 2 minutes of a meeting with 9 occupants present for the entire duration. Ideally, the Laplace parameters would be almost constant across all time windows, indicating that data recorded from the same meeting is summarized with the same parameter values. The varying spread of the raw data from the same meeting is explained by the varying movements of the occupants in that duration. This variation will be due to temporally local and/or individual behaviors which depend upon the precise nature of the meeting and the habits of the occupants, the effect of which diminishes over longer time windows.
We address this problem of the Laplace parameters varying during the meeting by clustering the training data into groups of similar motion patterns and then matching the motion struc-ture discovered onto patterns of human behavior we expect to observe. To have a sufficiently flexible grouping of behavior, and to allow the number of behaviors to grow as more data be-comes available, we model these groupings using the infinite hidden Markov model (iHMM) [3]. In this way, instead of using all the PIR data we focus the analysis only on the clus-ters that are most universally likely to describe the occupancy count. This approach substantially reduces the variation in spread parameters over the duration of the meeting, for shorter time windows (Figure 7).
(a) 2 minutes windows
(b) 30 seconds windows
Figure 7. Laplace spread parameters for different time windows of a meeting with 9 occupants. The red line shows the spread parameter estimated from all the raw PIR sensor data, whereas the blue line shows the spread parameter estimated from only points in the selected small motion behavior.
EXTRACTING BEHAVIOR FROM PIR DATA The infinite hidden Markov model (iHMM)
The hidden Markov model (HMM) is a widely used probabilis-tic model for segmentation of time series data and has been successfully used to model behavioral patterns of sequential data from different sources ([27], [2], [7], [10]). Typically, someKnumber of different temporal patterns is assumed a priori and we learn a clustering of the data intoKgroups in-corporating some measure of similarity between points and the time dynamics of the data. The nature of the clustering is highly dependent on the choice ofK. The time dynamics of the data is modelled by the Markov assumption for the discrete hidden states, one state per cluster, the HMM assumes the ob-served data is independent given the hidden states. However, major constraint of the HMM is that we do not knowKin
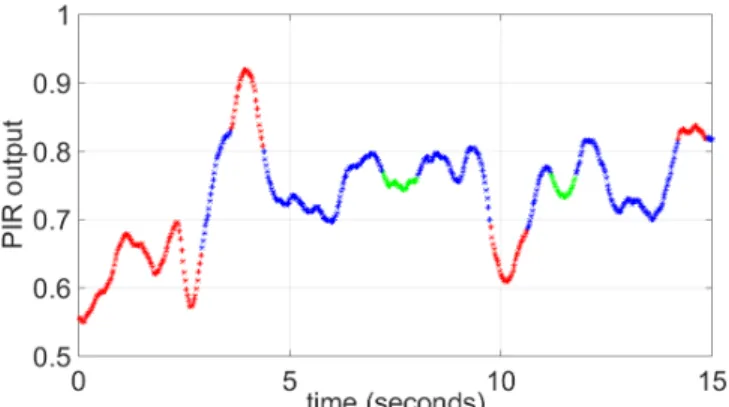
advance and further we should assume thatKwill change as the nature of the meetings, the occupants and the occupancy count changes. That is, we will assume that the number of behavioral patterns will approach infinity as the data grows to infinity, but will be some finite unknownK+for any finite subset of the data. These are the modeling assumptions of the iHMM [3]. The iHMM adapts its complexity to the structure in the data making it a natural choice for the segmentation of streaming data. In Figure 8 we show the clustering produced with iHMM of 15 seconds PIR signal, where different colors denote different clusters. The iHMM has been trained on all of the training data which exceeds 53 hours rather than just on the 15 seconds that are displayed.
Figure 8. Clustering output of the iHMM applied to 15 seconds PIR data. Different colors denote different clusters (states); the number of the clusters has not be specified a priori, but learned from the data. AssumingT is the number of PIR recordings from all meet-ings let us denote the raw sensor data withx1, . . . ,xT. Every observed recordingt∈ {1, . . . ,T}is associated with a hidden variablezt indicating the cluster (state) of that observation and every statek∈ {1, . . . ,K+} is modeled with a Laplace distributionL(µ,bk)with fixed location parameterµ and cluster specific spreadbk. Conveniently, the Laplace distri-bution with fixed location has a conjugate prior. Further we observed similar location parameter values across different meetings. Transitions between states are governed by Markov dynamics parameterized by the transition matrixπ, where
πi j=p(zt=k|zt−1=i)fort>1 and the vectorπ0denotes
the initial state probabilities fort=1. Given the model param-eters, the joint distribution over hidden states and the observa-tions can be written as:
p(z,x|π,b) =
T
∏
t=1
p(zt|zt−1)p(xt|zt) (1) To complete the Bayesian description of the iHMM we need to specify the priors over the random variables in the model. The conjugate choice for prior over the spread parameters
bkis the inverse-gamma distribution,bk∼InvGamma(ν0,χ0)
and to obtain flexible non-fixed transition matrix we place a hierarchical Dirichlet process (HDP) [26] prior over π,
(HDP(α,γ,G0)). The hierarchical Dirichlet process (HDP) is
set of coupled Dirichlet processes that can capture the more complex structure of an HMM transition matrix. The full Bayesian construction of the iHMM is often referred to as the HDP-HMM.
The Dirichlet process is a stochastic process most commonly used to construct infinite mixture models. It is parameter-ized by a positive concentration parameterα >0 and by its
expectationG0which is a function. While in finite mixture
models, we typically assume that the observed data groups into some finiteKnumber of clusters, in infinite mixture mod-els we assume that as more data is observed from the same population more clusters arise. In infinite mixture models, we learn the number of clustersK+from the data and instead we parametrize the strength of belief in the prior structure through
α.
In a similar way that Dirichlet processes can be used to infer the number of clusters in non time-ordered data the HDP allows us to infer the number of states in time series clustering. It is parameterized by a global concentration parameter γ
that controls the rate at which new clusters are generated on observing more data. For a given amount of observed data, a largeγ value leads to more clusters than a small value ofγ. The local concentration parameterα controls how likely we
are to observe repeating sequences of existing clusters. The expectation functionG0is the prior distribution for the cluster
parametersb. The transition matrixπis modeled with an HDP characterized by the transition probability:
p(zt=k|zt−1=i)∝
(
Nk−t,i+ αM
−t k
∑kMk+γ for an existing statek α γ
∑kMk+γ for a new state (2) whereNk−t,i counts the number of transitions between statei
andkhave previously occurred, excluding observationt, and
Mkcounts how many times statekhas been chosen with a new transition.
Matching motion patterns to behavior
By fitting an infinite HMM to the raw PIR data, we aim to cluster together segments of the time series that are similar. In this way, observations that are grouped into the same clus-ter are more likely to describe the same physical patclus-tern of movement. Note that typical human behaviors (e.g. walking, sitting down, standing up) are complex and so are composed of many different types of motion. Without making restrictive assumptions about the movement described by the recorded PIR signal, we are more likely to cluster together similar types of motion rather than composite human behaviors. At the same time obtaining the structure of the observed motion patterns is key to understanding how the different human behaviors are formed and in what way those behaviors differ based on the sequence of movements that form them. For our problem of occupancy counting, mapping sequences of motion patterns into composite behaviors is not the focus of the problem. How-ever, HMMs have already proven useful for the more difficult problem of tracking the activity of monitored individuals in different problem domains ([19], [27]).
We describe the collection of motion patterns that describe small movements as ’small motion behavior’. In order to separate parts of the PIR output describing this small motion behavior, to filter out more larger movements, we examine the PIR recordings from an empty room. More precisely, we ex-amine which clusters occur for empty rooms once the iHMM
is fitted to whole of the data. Then we identify segments of the PIR signal, from occupied rooms, that are grouped together un-der clusters found in non-occupied rooms. The iHMM groups together motions that are temporally similar, so larger move-ments would be clustered in separate groups and we can easily filter them out. Large temporally local fluctuations in the PIR output reflect some temporally local human behavior and will bias the occupancy count estimate (unless more information is available about the nature of these behaviors). In Figure 8 the blue and green clusters are motions describing the ’small motion behavior’ and the data belonging to the red cluster is filtered out. Note that red cluster groups both data with bigger and smaller PIR output, as points are clustered with respect to their common spread and time dynamics rather than absolute value. By focusing only on specific clusters, we are comparing Laplace parameters estimated from comparable (similar) sequences of PIR data which will make our estimates of those parameters less variable and more robust to reduc-ing the occupancy count estimate time window (c.f. Figure 7). In the collected training data approximately 70% of all of the training data groups into small motion behavior and the remaining 30% of the PIR output is filtered out.
Filtering out undesired motion behaviors and reducing the observation time windows will also help us exploit a more accurate switching mechanism between the two regression models for more and less occupied enviroment when needed. One efficient way we suggest for that switching would be to specify an interval of uncertainty forb; estimatedbfalling inside of that interval would imply uncertainty about which regression model to use. Whenever values forbestimated from the latest PIR output are from the uncertainty region, we do not choose a regression model but we proceed by esti-mating anotherbfrom the next window. We repeat that step if needed and based the first value of estimatedb and also obtained sequence of valuesbso far, we choose with higher certainty the appropriate regression model to output the occu-pancy count. Using this mechanism can cause certain delays in the estimation output, but delays rarely exceed 2, 3 times of the aimed time window duration(for example delay of 1 minute and 30 seconds instead of the assumed 30 seconds windows for estimation).
SYSTEM EVALUATION
In this staged-the-wild study we recorded PIR sensor data from 53 real-life meetings, 37 of those had up to 7 participants, the remaining 16 had more than 7, and the 2 most occupied meetings had 23 and 29 occupants, all with different meeting durations. The two most occupied meetings are excluded from the analysis as for the size of the monitored rooms and the viewing angle of the PIR sensor, data recorded from such over-populated meeting rooms is not meaningful. Indeed, the maximum seating space in the biggest of the monitored rooms is 14 people and typically exceeding this capacity leads to severely limiting the field of view of the PIR sensor which causes severe sensor occlusion and irretrievably biased sensor output.
We recorded simply the PIR sensor output and the true number of occupants for each meeting, so the study has been highly
Table 1. Percentage of time windows across all meetings (with less than
8 people) where the predicted number of occupants is within±1of the
true number of occupants. In the square brackets is the percentage of
time windows where the predicted number of occupants is within±2of
the true number of occupants.
Raw data Small motion behavior 30 seconds 63%[93%] 80%[96%]
1 minute 80%[93%] 83%[97%] 2 minutes 82%[96%] 85%[99%] 20 minutes 89%[97%] 92%[97%]
Table 2. Percentage of time windows across all meetings (with at least
8 people) where the predicted number of occupants is within±1of the
true number of occupants. In the square brackets is the percentage of
time windows where the predicted number of occupants is within±2of
the true number of occupants.
Raw data Small motion behavior 5 minutes 68%[79%] 59%[86%] 20 minutes 79%[84%] 71%[84%]
non-invasive. The data from each meeting is split in small observation windows in order to track how the accuracy of the occupancy count system changes with the count estimation time window. Note that if we wish to receive an estimate of the current room occupancy every 30 seconds, naturally the accu-racy of that estimate would be lower than an estimate obtained every 2 minutes or every 20 minutes. For numerous applica-tions an occupancy count estimation updated only every 20 minutes would not be of great value so there is an inherent trade-off between accuracy and count estimate time window. We investigated time windows of 20 minutes, 2 minutes, 1 minute and 30 seconds. Additional investigation showed that processing windows longer than 20 minutes does not appear to provide a substantial increase in occupancy count estima-tion. We still treat low and high occupancy count meetings differently in the analysis due to the different statistical nature of the data in these different occupancy strata.
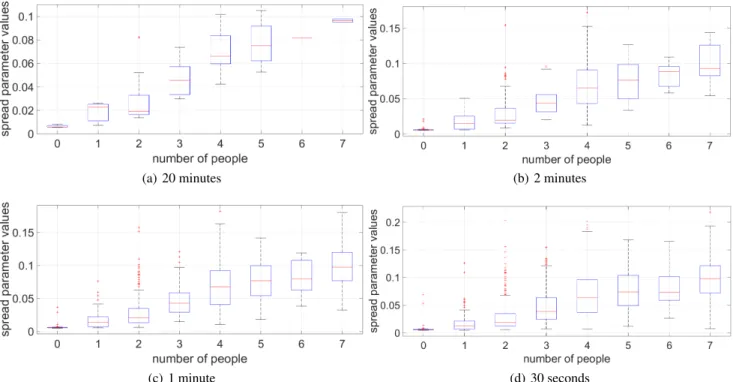
Fewer than 8 occupants
In the case of a small numbers of occupants, a linear Gaussian regression model performed best in terms of mean absolute prediction error (MAE) and is used to predict the human oc-cupancy count from the spread parameter alone (Figure 9). For shorter estimation time windows, the relationship between occupancy count and PIR data spread becomes unclear, the effect of which is clear from the numerical prediction accuracy estimates for predictions within±1 and±2 (Table 1) of the true occupancy count.
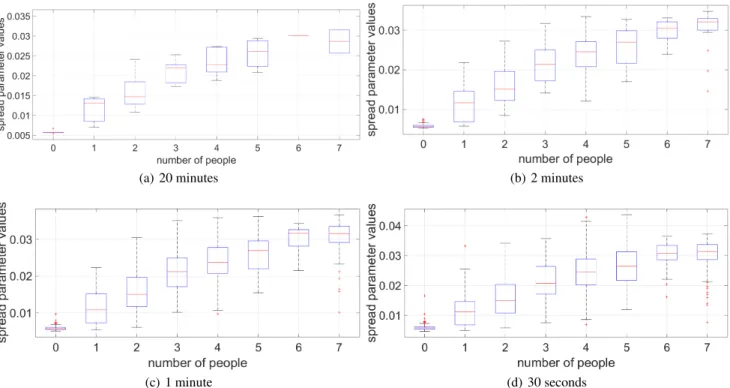
After the raw data is clustered with the Laplace iHMM and the clusters describing the saddle behavior are separated, we estimate spread parameters only from the data representing these behaviors. Following the same recipe, Gaussian linear regression is used to predict occupancy count from the “sta-bilized” Laplace spreads for different count estimation time windows (Figure 10 and second column of Table 1). The re-sulting overall increase in prediction accuracy confirms the positive effect of iHMM behavior clustering.
(a) 20 minutes (b) 2 minutes
(c) 1 minute (d) 30 seconds
Figure 9. Box plots of Laplace spread parameters estimated from raw PIR data for different meetings with up to 7 occupants, over different estimation time window durations. Top and bottom edges of each blue box are 25th and 75th percentiles respectively, the middle red line is the median, red pluses denote outliers.
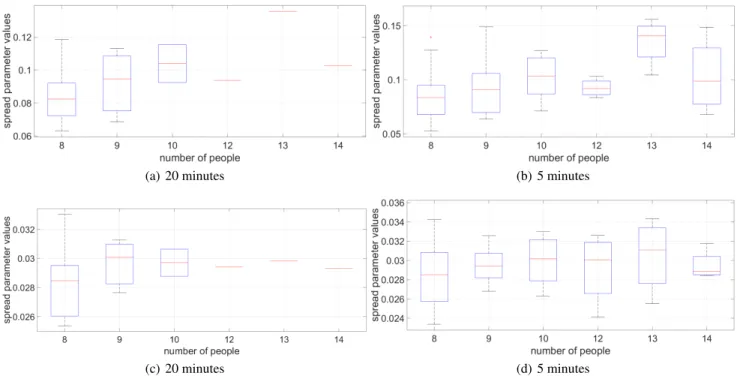
At least 8 occupants
For larger numbers of occupants which occlude each other, a Poisson log-linear regression model is found to provide the most accurate predictions (Figure 11). The predictive power of the Laplace parameters reduces significantly in this high occupancy strata due to the reasons discussed above and the error of this approach for windows smaller than 5 minutes is substantial. In addition, the benefits of behavior extraction stage are diminishing and regression on both Laplace parame-ters evaluated for both the raw data and “stabilized” Laplace parameters performs almost equally in terms of mean absolute error (MAE). The estimation accuracy within±1 person and within±2 can be found in Table 2.
COMPUTATIONAL EFFICIENCY
Practical applications of Bayesian probabilistic models such as the iHMM have been few largely due to the complex and computationally demanding inference algorithms involved for learning the parameters of such models. As a bayesian non-parametric probabilistic model for time series data, the iHMM is no exception and careful consideration is needed to choose fitting procedures which are tractable for implementation in low-power embedded microcontroller hardware. Eventually, the algorithms developed in this paper will be deployed in a resource constrained embedded system in which a micro-processor will take the data from the PIR sensor and run the algorithms to make occupancy prediction in a smart room context. The microprocessor must make the prediction in real-time at the end of every observation window, and therefore the algorithms must be optimized for performance. In this study we compare several different iHMM inference algorithms: the
Table 3. Mean absolute error (MAE, interquartile range in brackets) as a measure of occupancy count prediction accuracy using “stabilized” Laplace parameters from PIR data only for small motion behavior clus-ters. Each column corresponds to iHMM clustering performed using a different inference algorithm. Last row shows speed comparison in terms of iterations to convergence.
Beam sampler Gibbs sampler Iterative MAP
30 sec. 0.95(0.7) 0.98(0.8) 0.99(0.8)
1 min. 0.87(0.7) 0.89(0.8) 0.91(0.7)
2 min. 0.79(0.6) 0.81(0.7) 0.84(0.7)
20 min. 0.64(0.6) 0.72(0.6) 0.70(0.7)
Iterations 125 100 6
beam sampler [28], direct assignments Gibbs sampler [26] and iterative maximum a posteriori (MAP) inference [24] (Table 3). Note that we are less interested in the quality of fit of the iHMM to the raw PIR sensor data than the prediction error of the regression component of the system using estimates of the “stabilized” Laplace parameters obtained using that iHMM, where the parameters have been estimated using dif-ferent iHMM inference algorithms. This is because ultimately we care about accurate human occupancy counting rather than learning the iHMM per se. We report the iterations that each inference algorithm required to convergence where an iteration consist of a full sweep through the training data and the model parameters. Computational price of a single iteration across algorithms is not equivalent, but for the chosen application is comparable.
Theoretically, both beam and Gibbs sampler inference algo-rithms are guaranteed to converge on the optimal iHMM fit
(a) 20 minutes (b) 2 minutes
(c) 1 minute (d) 30 seconds
Figure 10. Box plots of the “stabilized” spread parameters estimated only from the saddle behavior clusters across all meetings with at most 7 occupants.
eventually. However, the stochastic nature of both samplers makes them highly computationally demanding and they can easily take two orders of magnitude more iterations to con-verge than iterative MAP. At concon-vergence both stochastic al-gorithms will generally outperform iterative MAP in terms of iHMM parameter estimate accuracy, but we observe that the improvement due to better iHMM parameter estimates does not translate into sufficiently improved occupancy count to justify such large increase in computational effort over it-erative MAP. Indeed, itit-erative MAP is simple enough that it can be used where computational resources are at a pre-mium, as would be the case for our experimental setup using a microcontroller board.
DISCUSSION AND FUTURE WORK
Type of the PIR sensor
In addition to the standard type PIR sensor, we also use a slight motion type PIR (Panasonic NaPiOn AMN 22112 series) in the same experiments in order to validate the developed models for different PIR. The standard sensor shows to be more promising then the slight motion detector mostly due to the larger field of view. The slight motion sensor does not cover all of the monitored room with only 2m range and occupants seated in particular areas of the monitored room cannot be seen by the sensor. The accuracy of the occupancy count system would benefit from exploring additional types of PIR sensors with more sensitivity, range and wider field of view. Further, installing a second PIR sensor on the opposite side of the room and analyzing the output of the two jointly may help to address both the problem of mutual occlusion of the sensor by the occupants, and the problem of limited field of view.
Position of the sensor
The data acquisition board was placed on a table positioned approximately in the middle of the room next to the wall. The table was part of the chosen office room furniture and as a result its height varied slightly in the different meeting rooms. The results did not seem to be influenced by the exact height of the table, but placing the sensor on one particular side of the room led to occupants occluding each other during more populated meetings (typically with 8 or more people). This problem can be easily addressed by testing different positions of the PIR sensor; a promising start would be the ceiling of the room. This would make the installation of the system more challenging, but it is likely to lead to a consistent improve-ment of accuracy due to the clear unobstructed view of all the occupants that the sensor will be afforded in this physical configuration. In addition, PIR sensors installed on the ceiling are likely to increase the maximum distinguishable occupancy count. The accuracy of the system and its invariance to sensor location and position can additionally be improved with more training data accounting for different physical configuration scenarios.
Behavior modeling
In the current implementation, the key assumption made is that small movement patterns will describe better the num-ber of people in a room, as they are less intentional and are independent of the nature of the meetings. We expect this assumption to hold in most human counting scenarios and no additional information about the nature of the meeting has been incorporated. In effect, we have sacrificed some of the predictive accuracy to obtain a generally applicable human occupancy counting system. Where additional information
(a) 20 minutes (b) 5 minutes
(c) 20 minutes (d) 5 minutes
Figure 11. Box plots of the spread parameters over all meetings with number of occupants varying between 8 and 14.
is available about the behavior of the monitored occupants, incorporating this information into our probabilistic model will most likely improve the accuracy of the system and may even help us address other problems different from that of occupancy counting. For example, if we assume that we are monitoring conference meetings with duration of 1 hour start-ing on the hour, we would immediately know that occupancy changes occur only once every hour and we can use the whole hour PIR data to improve our predictions.
Limitations
The low dimensionality of the PIR sensor, makes the system sensitive to occupants occluding each other from the view of the sensor. Even with optimized positioning, there is a fairly limited amount of occupants that we can expect to monitor with single PIR. To monitor larger spaces, we would need to place multiple PIR sensors at the different parts of the room, so that all of the area is inside of the field of view of at least one PIR sensor. With few simple updates, the suggested method can be used to process data from multiple PIR sensors. The single PIR measurements would be replaced with multivariate ones having measurements from different sensors in each di-mension. We would also add more predictors in the regression stage to incorporate the information gained from the different PIR sensors. If we want to deploy the system in hallways, cafe-terias or other office facilities, substantial additional training and calibration would be needed. The behaviour extraction stage simply groups together similar motion behaviours, so we believe it is highly adaptable to different scenarios. However the assumption of which behaviours are most correlated to the occupacy count can change with the nature of the monitored activity and should be carefully re-considered for follow-up applications.
CONCLUSION
The purpose of this study was to demonstrate the potential of using a single passive infrared (PIR) sensor for more com-plex tasks than motion detection. We demonstrate how such a simple sensor combined with “intelligent” machine learning models can be utilised to solve the more complex problem of counting occupants in a room. While the accuracy of the proposed system does not yet reach the current state of the art obtainable with stereo cameras and computationally demand-ing image processdemand-ing algorithms (or multisensor devices), our approach shows the ability to count the number of room oc-cupants to within±1 individual while substantially reducing the hardware costs, computational power and the need for specialist installation. Applications where accuracy is not crit-ical, for instance, optimizing energy usage in buildings, can benefit from this cost-effective and easy to deploy approach. To our knowledge, the system discussed in this report is the first attempt at designing a human occupancy counting system using a single, low-cost PIR sensor.
REFERENCES
1. Yuvraj Agarwal, Bharathan Balaji, Rajesh Gupta, Jacob Lyles, Michael Wei, and Thomas Weng.
Occupancy-driven energy management for smart building automation, 2010.
2. Ernesto L Andrade, Scott Blunsden, and Robert B Fisher. Hidden markov models for optical flow analysis in crowds. In18th International Conference on Pattern Recognition, ICPR, volume 1, pages 460–463. IEEE, 2006.
3. Matthew J Beal, Zoubin Ghahramani, and Carl E Rasmussen. The infinite hidden markov model. In
Advances in Neural Information Processing Systems, pages 577–584, 2001.
4. Zsolt Bitvai and Trevor Cohn. Non-linear text regression with a deep convolutional neural network.Volume 2: Short Papers, 1(x1):180, 2015.
5. Rodney A Brooks. The intelligent room project. In
Cognitive Technology. Humanizing the Information Age. Proceedings., Second International Conference, pages 271–278. IEEE, 1997.
6. Antoni B Chan and Nuno Vasconcelos. Counting people with low-level features and bayesian regression.
Transactions on Image Processing, IEEE, 21(4):2160–2177, 2012.
7. Pau-Choo Chung and Chin-De Liu. A daily behavior enabled hidden markov model for human behavior understanding.Pattern Recognition, 41(5):1572–1580, 2008.
8. Robert H Dodier, Gregor P Henze, Dale K Tiller, and Xin Guo. Building occupancy detection through sensor belief networks.Energy and buildings, 38(9):1033–1043, 2006. 9. Varick L Erickson, Yiqing Lin, Ankur Kamthe, Rohini
Brahme, Amit Surana, Alberto E Cerpa, Michael D Sohn, and Satish Narayanan. Energy efficient building
environment control strategies using real-time occupancy measurements. InProceedings of the First ACM
Workshop on Embedded Sensing Systems for
Energy-Efficiency in Buildings, pages 19–24. ACM, 2009. 10. Debin Gao, Michael K Reiter, and Dawn Song.
Behavioral distance measurement using hidden markov models. InRecent Advances in Intrusion Detection, pages 19–40. Springer, 2006.
11. Kazuhiko Hashimoto, Katsuya Morinaka, Nobuyuki Yoshiike, Chihiro Kawaguchi, and Satoshi Matsueda. People count system using multi-sensing application. In
International Conference on Solid State Sensors and Actuators. TRANSDUCERS’97 Chicago, volume 2, pages 1291–1294. IEEE, 1997.
12. Le Kang, Peng Ye, Yi Li, and David Doermann. Convolutional neural networks for no-reference image quality assessment. InProceedings of the IEEE
Conference on Computer Vision and Pattern Recognition, pages 1733–1740, 2014.
13. Aftab Khan, James Nicholson, Sebastian Mellor, Daniel Jackson, Karim Ladha, Cassim Ladha, Jon Hand, Joseph Clarke, Patrick Olivier, and Thomas Plötz. Occupancy monitoring using environmental and context sensors and a hierarchical analysis framework. InACM International Conference on Embedded Systems For Energy-Efficient Buildings, pages 90–99, 2014.
14. Julie A Kientz, Shwetak N Patel, Brian Jones, ED Price, Elizabeth D Mynatt, and Gregory D Abowd. The georgia tech aware home. InCHI’08 extended abstracts on Human factors in computing systems, pages 3675–3680. ACM, 2008.
15. Khee Poh Lam, Michael Höynck, Bing Dong, Burton Andrews, Yun-Shang Chiou, Rui Zhang, Diego Benitez, and Joonho Choi. Occupancy detection through an extensive environmental sensor network in an open-plan office building.IBPSA Building Simulation,
145:1452–1459, 2009.
16. Suk Lee, Kyoung Nam Ha, and Kyung Chang Lee. A pyroelectric infrared sensor-based indoor location aware system for the smart home.IEEE Transactions on Consumer Electronics, 52(4):1311–1317, 2006. 17. Victor Lempitsky and Andrew Zisserman. Learning to
count objects in images. InAdvances in Neural
Information Processing Systems, pages 1324–1332, 2010. 18. Xiaoming Liu, Peter Henry Tu, Jens Rittscher, Amitha
Perera, and Nils Krahnstoever. Detecting and counting people in surveillance applications. InIEEE Conference on Advanced Video and Signal Based Surveillance, AVSS., pages 306–311. IEEE, 2005.
19. Andrea Mannini and Angelo Maria Sabatini. Gait phase detection and discrimination between walking jogging activities using hidden markov models applied to foot motion data from a gyroscope.Gait and posture, 36(4):657–661, 2012.
20. Emi Mathews and Axel Poigné. Evaluation of a "smart" pedestrian counting system based on echo state networks.
EURASIP Journal on Embedded Systems, 2009(1):1–9, 2009.
21. Sean Meyn, Amit Surana, Yiqing Lin, Stella M Oggianu, Satish Narayanan, and Thomas A Frewen. A
sensor-utility-network method for estimation of
occupancy in buildings. InProceedings of the 48th IEEE Conference on Decision and Control, pages 1494–1500. IEEE, 2009.
22. Mahmoud Moghavvemi and Lu Chin Seng. Pyroelectric infrared sensor for intruder detection. InIEEE Region 10 Conference, TENCON 2004, volume 500, pages 656–659. IEEE, 2004.
23. Deepak Pathak, Philipp Krähenbühl, Stella X Yu, and Trevor Darrell. Constrained structured regression with convolutional neural networks.arXiv preprint
arXiv:1511.07497, 2015.
24. Yordan P Raykov, Alexis Boukouvalas, and Max A Little. Iterative collapsed map inference for bayesian
nonparametrics, 2015.
25. Alex Smola and Vladimir Vapnik. Support vector regression machines.Advances in Neural Information Processing Systems, 9:155–161, 1997.
26. Yee Teh, Michael Jordan, Matthew Beal, and David Blei. Hierarchical Dirichlet processes.Journal of the American Statistical Association, 101(476), 2006.
27. B Ugur Toreyin, E Birey Soyer, O Urfalioglu, and A Enis Cetin. Flame detection system based on wavelet analysis of pir sensor signals with an hmm decision mechanism. In16th European Signal Processing Conference, pages 1–5, 2008.
28. Jurgen Van Gael, Yunus Saatci, Yee Whye Teh, and Zoubin Ghahramani. Beam sampling for the infinite hidden markov model. InProceedings of the 25th International Conference on Machine Learning, pages 1088–1095. ACM, 2008.
29. Tim Van Oosterhout, Sander Bakkes, and Ben JA Kröse. Head detection in stereo data for people counting and segmentation. InVISAPP, pages 620–625, 2011. 30. Florian Wahl, Milo Milenkovic, and Oliver Amft. A
distributed pir-based approach for estimating people count in office environments. InIEEE 15th International Conference on Computational Science and Engineering, pages 640–647. IEEE, 2012.
31. Danny B Yang, Hector H Gonzälez-Banos, and Leonidas J Guibas. Counting people in crowds with a real-time network of simple image sensors. In9th IEEE International Conference on Computer Vision, pages 122–129. IEEE, 2003.
32. Jaeseok Yun and Sang-Shin Lee. Human movement detection and identification using pyroelectric infrared sensors.Sensors, 14(5):8057, 2014.
33. Piero Zappi, Elisabetta Farella, and Luca Benini. Enhancing the spatial resolution of presence detection in a pir based wireless surveillance network. InIEEE Conference on Advanced Video and Signal Based Surveillance, pages 295–300. IEEE, 2007. 34. Piero Zappi, Elisabetta Farella, and Luca Benini.
Tracking motion direction and distance with pyroelectric ir sensors.IEEE Sensors Journal, 10(9):1486–1494, 2010.