COMPARATIVE STUDY OF THE EFFECT OF INFRASTRUCTURE DEVELOPMENT ON ECONOMIC GROWTH IN DEVELOPING
COUNTRIES By Dong-Il Suh
THESIS Submitted to
KDI School of Public Policy and Management in partial fulfillment of the requirements
for the degree of
MASTER OF PUBLIC POLICY 2017
COMPARATIVE STUDY OF THE EFFECT OF INFRASTRUCTURE DEVELOPMENT ON ECONOMIC GROWTH IN DEVELOPING
COUNTRIES By Dong-Il Suh THESIS Submitted to
KDI School of Public Policy and Management in partial fulfillment of the requirements
for the degree of
MASTER OF PUBLIC POLICY 2017
Professor Kye-Woo Lee
COMPARATIVE STUDY OF THE EFFECT OF INFRASTRUCTURE DEVELOPMENT ON ECONOMIC GROWTH IN DEVELOPING
COUNTRIES By Dong-Il Suh
THESIS Submitted to
KDI School of Public Policy and Management in partial fulfillment of the requirements
for the degree of
MASTER OF PUBLIC POLICY
Committee in charge:
Professor Kye-Woo LEE, Supervisor
Professor Sung-Soo CHOI
Professor Jongyearn Lee
... ABSTRACT
COMPARATIVE STUDY OF THE EFFECT OF INFRASTRUCTURE DEVELOPMENT ON ECONOMIC GROWTH IN DEVELOPING
COUNTRIES By Dong-Il Suh
The purpose of this paper is to evaluate the impact of investment in various infrastructure sectors on economic growth in developing countries. Infrastructure would be interpreted in a wide sense. In this paper, infrastructure is confined to Telecommunications, Energy, Transportation and Water and Sanitation sectors. The author used a panel data set covering a panel of 113 countries from 2005 to 2015. The study found that infrastructure development generally has been effective in facilitating economic growth.
Keywords: Infrastructure, Telecommunication, Energy, Transportation, Water, PPP, Institution, Doing Business Index, Developing Country, Economic Growth
Copyright by Dong-Il Suh 2017
ACKNOWLEDGEMENTS
I would like to express my deepest gratitude to supervising professor, Kye-Woo Lee for tutoring me to be an independent researcher. I am deeply indebted to Jung-Han Kim and Dong-Hyun KIM, the Deputy Directors of Ministry of Land, Infrastructure, Transport for insights and valuable guidance throughout the project. I also thank Se-Jong Yoo for providing me invaluable suggestion. I have benefited from comments on related modeling issues by Dr. Rahman Anisur.
TABLE OF CONTENTS 1. INTRODUCTION ... 1 1.1. Background of the Study ... 1
1.2. Research Questions ... 3
1.3. Structure of the Paper ... 4
2. LITERATURE REVIEW ... 4
2.1. Infrastructure Quantity Indicator ... 4
2.2. Private Participation in the Infrastructure Development ... 5
2.3. Institutions and Business Environment ... 6
2.4. The Contribution of this Study ... 6
3. RESEARCH METHOD AND DATA ... 7
3.1. Research Method ... 7
3.2. Data ... 8
3.3. Infrastructure and Growth Regression ... 10
3.3.1. White`s General test for Heteroskedasticity ... 14
3.3.2. Breusch-Pagan Lagrangian Multiplier test for Random Effects ... 15
3.3.3. Hausman Test for Random and Fixed Effects ... 16
3.4. Infrastructure, Private Participation and Growth Regression ... 19
3.5. Infrastructure, Institutions and Growth Regression ... 20
4. CONCLUSIONS AND POLICY IMPLICATIONS ... 23
BIBLIOGRAPHY ... 25
LIST OF TABLES
1. Definition and Summary Statistics of Variables ... 9
2. Descriptive Statistics ... 10
3. Regression Result of Infrastructure and Economic Growth Model ... 11
4. Result of Variance Inflation Factors(VIF) ... 12
5. Regression Result of Infrastructure and Economic Growth Expansion-Model ... 13
6. White`s General test result for Heteroskedasticity ... 15
7. Breusch-Pagan Lagrangian Multiplier test result for Random Effects ... 16
8. Housman test result between Fixed and Random Effect model ... 17
9. Regression Result of Housman test between Fixed and Random Effect model ... 18
10. Regression Result of Private Participation in Infrastructure and Growth ... 19
11. Regression Result of Institution, Infrastructure and Economic Growth ... 21
12. Regression Result of Business Environment, Infrastructure and Growth ... 22
LIST OF FIGURES
1. ODA, FDI Trends in developing countries (2002 ~ 2015) ... 2 2. PPP Investment Trends in developing countries (2005 ~ 2105) ... 3
1. INTRODUCTION
1.1 Background of the Study
An adequate supply of infrastructure is a prerequisite factor for economic growth. Intuitively, one would think that various infrastructure development interacts with the economic growth in complex processes as intermediary goods. The improvement in both quality and quantity of infrastructure affects the productivity of overall industries. Eventually it raises the profitability and competency of industry (Calderón, 2008).
Traditionally, the provision of infrastructure has been a government's’ responsibility because of the inherent nature of infrastructure; high cost of construction, large scale with indivisibility, national security and natural monopoly. However, the exclusive infrastructure development by public sector results in failures in providing adequate supply. That failure stems from budget constraint, the lack of stable long-term finance, macro-risk arising from political instability and poor governance (Okoh, 2013). For the public sector, it is difficult to keep pace with providing the country’s infrastructure flexibly.
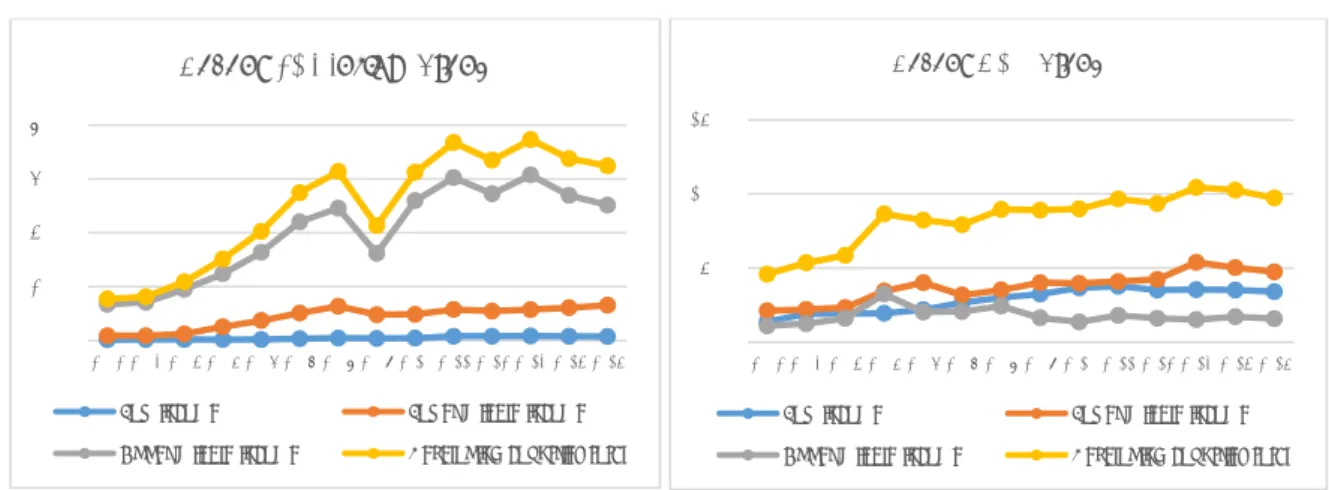
Since the global economic crisis in 2008, the developing countries have faced exodus of foreign investors. Not surprisingly, both investment and official development assistance had been drastically reduced. A financing deficiency caused many problems in a long-term infrastructure supply, developing country governments needed to focus on which infrastructure development was more effective than the others and can be a better step-stone for the future. They had looked into infrastructure project viability and its ripple effect with limited budget and funding source. Therefore, they have incentives to accept private participation for filling the funding gap as well as obtaining project cost efficiency.
Figure 1: ODA, FDI Trends in developing countries (2002 ~ 2015)
Source: World Development Indicators, World Bank, as of 2015. Note: Data cover the ODA, FDI Inflow. Unit: Billion US$
Private participation could be a plausible way to lessen burden of national budget and eliminate the inefficiency of public-leading project (Calderón, 2010). Additionally, private participation in infrastructure development seems to increase with freedom from corruption, quality of regulations and decrease with court disputes (Moszoro, Marian, et al., 2015). Recently, the governments have gradually opened infrastructure market to the private sector to achieve efficiency and bankability of infrastructure projects. Such private participation can bring about a more competitive environment, as well as the mobilization of the private sector’s technological expertise and managerial competences in the public interest (Christiansen, 2008).
However, the complex process with intricate permission by the authorities and uncertainties caused by a long business period frequently deter private investment in infrastructure. That is mostly because of unfavorable institution environment that results from the lack of sound public governance, transparency and good fiscal policy. Therefore, the public sectors try to implant diverse policies and institutions to ensure success of infrastructure development through private creativity. Public sector had realized that institutional capacity and economic returns determine the number of new infrastructure projects (Esfahani, 2003). 0 2000 4000 6000 8000 2002 2003 2004 2005 2006 2007 2008 2009 2010 2011 2012 2013 2014 2015
Recent FDI Inflow Trend
Low income Lower middle income Upper middle income Developing countries total
0 500 1000 1500
2002 2003 2004 2005 2006 2007 2008 2009 2010 2011 2012 2013 2014 2015
Recent ODA Trend
Low income Lower middle income Upper middle income Developing countries total
The business environment clearly had an influence on the infrastructure development of the private sector, which developed markets that encourage sound competitive environment and raised the effective and sustainable development interventions (Kellermann et al, 2014).
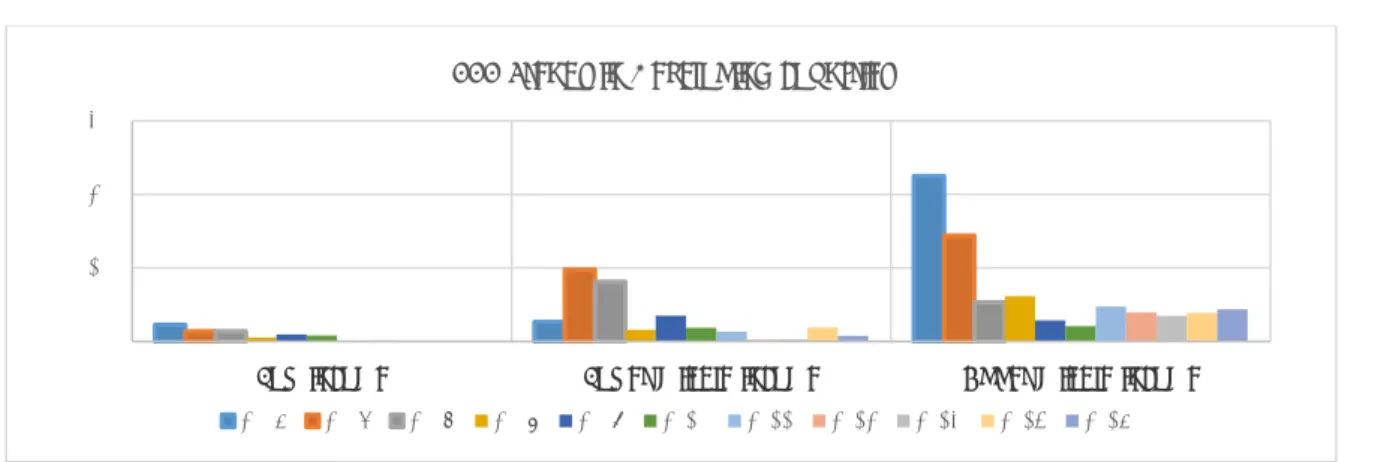
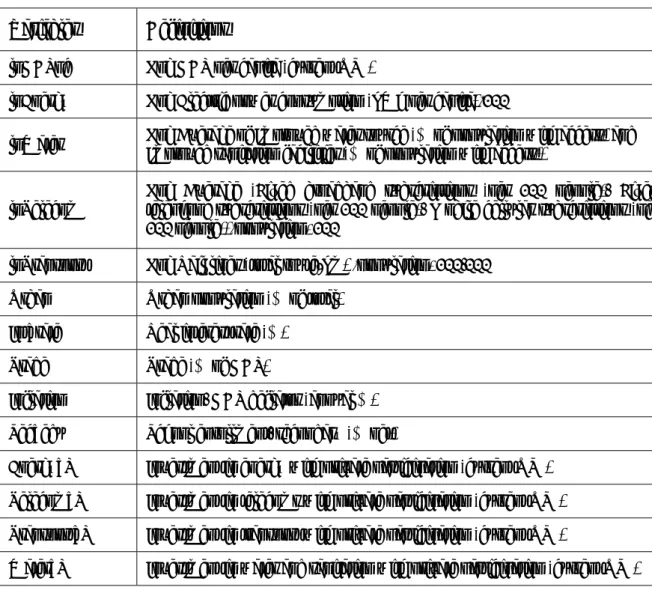
Figure 2: PPP Investment Trends in developing countries (2005 ~ 2015)
Source: PPI Database, World Bank, as of December 2015. Note: Data cover the projects in Energy, ICT, Railways, water and sanitation reaching financial closure 2005‐2015, All the investments are at 2015 US$ price level, Unit : Billion US$
Since the effect of infrastructure development on economic growth is the main interest of this study, the author evaluated and analyzed the relationship between infrastructure and economic growth in terms of private participation in infrastructure development, institutions and business environment as well.
1.2 Research Questions
The research attempts to answer the following research questions.
1. Which infrastructure sector development has greater impact on economic growth? 2. Does private participation in infrastructure investment have impacts on economic growth? 3. What is the nature of relationship between infrastructure development, related institutions
and economic growth?
4. Does business environment for infrastructure development affect economic growth? 0
10 20 30
Low income Lower middle income Upper middle income
PPP Trends in Developing countries
2005 2006 2007 2008 2009 2010 2011 2012 2013 2014 2015
1.3 Structure of the Paper
This paper is organized as follows. Introduction is provided in the chapter 1. A literature review relevant to the research is presented in the chapter 2. The author discusses the methodology used including data, specification of the econometric model and definitions of the variables used in the chapter 3. Finally, conclusion and policy implication are presented in the chapter 4.
2. LITERATURE REVIEW
Previous literature has been written regarding impact of infrastructure development on economic growth. Suffice it to say outcomes of previous studies could not be more various and different. Numerous studies have confirmed the intuitive expectations that infrastructure facilitates economic growth. The author reviewed several approaches to refer infrastructure indicators and its impact on economic growth as well as relevant issues such as infrastructure quantity indicators, the private sector participation, institutions and business environment for infrastructure development.
2.1. Infrastructure Quantity Indicator
Most of previous studies focus on single infrastructure sector. Röller and Waverman (2001) used a single indicator, telecommunications, and impact on economic development in industrial countries. Fernald (1999) analyzed the productivity effects of changes in road infrastructure.
Calderón and Servén(2008) considered multi-indicators. They researched the effect of infrastructure on economic growth and income distribution and as well as studied Infrastructure and economic development in Sub-Saharan Africa. They measured quantity and quality indicators which were their own synthetic indices. It measured telecommunications, electricity and roads sector.
David Canning and Peter Pedroni(1999) focused on the telephone and road infrastructure
and economic growth. Calderón and Servén(2003) found positive and significant output contributions of three infrastructures (telecommunications, transport and power). Sanchez-Robles (1998) found that physical infrastructure is positively and significantly related to growth in GDP per capita. Easterly (2001) reported that a measure of telephone infrastructure significantly contributes to the growth performance of developing countries.
Loayza, Fajnzylber and Calderón (2003) found that the same telecommunications indicator was related to economic growth in developing countries.
Although the indicators and methodologies differed from paper to paper, most previous studies found a positively significant effect of infrastructure development on economic growth. However, none of previous study considered four different type of infrastructure in overall developing countries while considering Public Private Partnership (PPP), institution and business environment.
2.2. Private Participation in the Infrastructure Development
Harris (2003) analyzed impacts of infrastructure services in several aspects; efficiency, the quality of service, service expansion, fiscal impacts, prices. The governments should prevent shortage of supply of infrastructure services and revitalize private participations in infrastructure development.
Mengistu et al(2013) researched the key factor of private participation in infrastructure in Sub-Saharan Africa countries. They researched the motivations of governments, private sectors to commence a public-private partnership (PPP) in relation to the institution and macroeconomic environment.
Previous study regarding private participation in infrastructure sectors focused on impact of PPP with institution and macroeconomic factors. However, this study diversified private participation in each of infrastructure sectors and gauged its own impact.
2.3. Institutions and Business Environment
Easterly and Rebelo (1993) verified that various policy variables permanently increased the economic growth rate and clarified whether investments related to information and telecommunications raised the economic growth rate. They found that infrastructure investment in transportation and communication were consistently correlated with economic growth.
Deverajan, Swaroop and Zou(1996) drew analytical conclusions about developing countries based on the endogenous growth theory in order to verify which type of government expenditures promote economic growth. They estimated the relationship between the composition of public expenditure and economic growth.
Stephen et al(2013) found policies to improve regulatory quality, promote the rule of law, improve education and health, reduce the size of government, facilitate globalization, and focus on the rural population will improve a country’s ease of doing business in both short and long run, and contribute a better sense of overall sustainability.
The author prepared his own synthetic indicators which can reflect real-world institution and business atmosphere. The institution synthetic indicator can minimize distortion by choosing sufficient institutional indicators. As well as business environment indicator mirrored overall financial and legal issues in quantity and quality aspects.
2.4 The Contribution of this Study
Through literature review, the author found that the impact of specific infrastructure investment on economic growth, considering related institutions and business environment. However, no study has been conducted comparing the impact of several infrastructure sector investments in a direct way, nor considered public private partnership, Institution and business environment sequentially. Thus, this paper contributes to finding out the impact of the infrastructure development on economic growth by comparing the impact of
infrastructure on each supplementary current aspects.
3. RESEARCH METHOD AND DATA
3.1. Research method
The empirical analysis focused on four issues. Firstly, this study examines the impact of infrastructure development on economic growth. Secondly, the author analyzes the relationship between the private participation in infrastructure investment and growth. Thirdly, the author analyzes the infrastructure and growth in relation to institutions and policies. Lastly, this study explains the infrastructure and growth in the aspect of business environments on economic development.
A quantitative methodology had been used to estimate the relationship between infrastructures and impact of economic development. The analysis included quantitative and qualitative infrastructure data from the World Bank’s World Development Indicators (2015). Generally, it takes time to complete an infrastructure project and the economic growth usually lags behind the infrastructure development. Therefore, the regression assumed that infrastructure development affects economic growth one to three years later. Private participation in infrastructure investment followed its original infrastructure development in two year later, whereas other variables remained. To identify the impact of private participation in infrastructure investment on economic growth, private investment of each infrastructure sector is jointly considered.
Government fiscal policy and institution for infrastructure development are the key factors that would decide the successful implementation of a given infrastructure development project. Hence, diverse governmental institutions are interpreted as a general support for infrastructure development as Country Policy and Institutional Assessment (“CPIA”). Doing Business Index(“DBI”) in the infrastructure industry is as important as Institutions. It can be
a realistic barometer for evaluating effectiveness of current infrastructure developing environment. In this paper, the author used DBI as a proxy for efficiency of business atmosphere. The author considered CPIA and DBI affecting 1 ~ 2 years ahead.
3.2. Data
To assess the impact of infrastructure on economic growth, the author used a large panel data set comprising 113 developing countries and spanning the years from 2005 to 2015. To avoid potential distortions raised by small economies, the author limited the coverage to countries with total population over one million.
GDPpc (GDP per capita, current US$), Energy (Electric power consumption (kWh per capita)/100), Telecom (Fixed telephone, Fixed broadband, Mobile cellular subscriptions, per capita Synthetic Index), Transport (Rail lines total route per capita) and Water (Improved water source, Improved sanitation facilities % of population, Synthetic Index) were transformed into natural logarithm.
On the other hand, Urban(Urban population(% of total), Int_rate(Real interest rate), Trade(% of GDP), Inflation(GDP deflator), Sec_edu (School enrollment, secondary, % net) and Quality indices were included as control variables which would better explain the impact of infrastructure development on economic development.
In addition, the author used synthetic index of country policies and institutions. The index consists of the building human resources rating, CPIA equity of public resource use rating, CPIA financial sector rating, CPIA fiscal policy rating, CPIA macroeconomic management rating, CPIA property rights and rule-based governance rating, CPIA public sector management and institutions cluster average, CPIA quality of budgetary and financial management rating, CPIA quality of public administration rating and CPIA transparency, accountability, and corruption in the public sector rating.
Lastly, a Business environment would be analyzed as a proxy for infrastructure
development environment. Considering adverse direction to dependent variable, the author made it reversely set by subtracting average value by 750. The synthetic index is made up of Cost to enforce a contract, Cost to register property, Cost to start a business, Minimum paid-in capital required to start a buspaid-iness, Procedures required to build a warehouse, Procedures required to connect to electricity, Procedures required to register property, Procedures required to start a business, Profit tax rate, Time required to enforce a contract, Time required to register property and Total tax rate. Definition and summary statistics of variables are shown below.
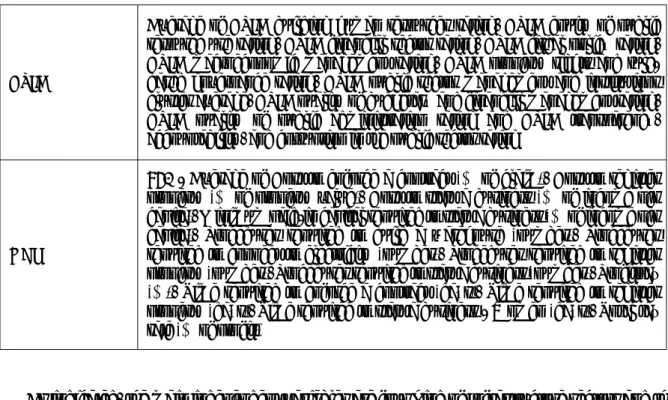
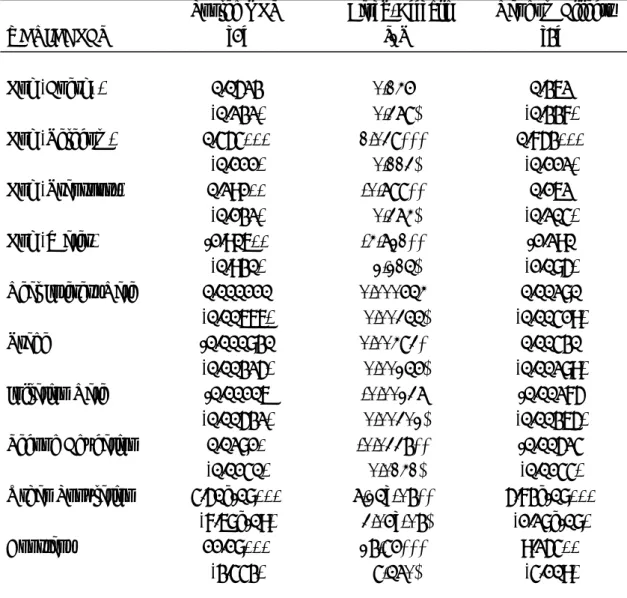
Table 1: Definition and Summary Statistics of Variables
Variables Definitions
lnGDPpc Log GDP per capita (current US$)
lnEnergy Log Electric power consumption (kWh per capita)/100
lnWater Log Average of Improved water source (% of population with access) and Improved sanitation facilities (% of population with access))
lnTelecom
Log Average (Fixed broadband subscriptions (per 100 people), Fixed telephone subscriptions (per 100 people), Mobile cellular subscriptions (per 100 people))/population*100
lnTransport Log Rail lines (total route-km) /population*100,000 Urban Urban population (% of total)
Int_rate Real interest rate (%) Trade Trade (% of GDP)
Inflation Inflation, GDP deflator (annual %) Sec_edu School enrollment, secondary (% net)
Energy_P Investment in energy with private participation (current US$) Telecom_P Investment in telecoms with private participation (current US$) Transport_P Investment in transport with private participation (current US$)
Water_P Investment in water and sanitation with private participation (current US$)
CPIA
Average of CPIA building human resources rating, CPIA equity of public resource use rating, CPIA financial sector rating, CPIA fiscal policy rating, CPIA macroeconomic management rating, CPIA property rights and rule-based governance rating, CPIA public sector management and institutions cluster average, CPIA quality of budgetary and financial management rating, CPIA quality of public administration rating and CPIA transparency, accountability, and corruption in the public sector rating
DBI
750 - Average of Cost to enforce a contract (% of claim), Cost to register property (% of property value), Cost to start a business (% of income per capita), Minimum paid-in capital required to start a business (% of income per capita), Procedures required to build a warehouse (number), Procedures required to connect to electricity (number), Procedures required to register property (number), Procedures required to start a business (number), Profit tax (%), Time required to enforce a contract (days), Time required to register property (days), Time required to start a business - Women (days), Total tax rate (% of profit)
As indicated, the main independent variables are four kind of Infrastructure sectors and the author had modeled in several forms. (1) Infrastructure on economic growth with several control variables. (2) The marginal impact of infrastructure development on economic growth in terms of private participation. (3) Infrastructure interacts with the policy variable to determine whether the effectiveness of infrastructure depends on the quality of policies and institutions. (4) Infrastructure on economic growth interacts with the Doing Business Index.
3.3. Infrastructure and Growth Regression
As this study examines in the literature review, infrastructure development promotes economic growth. To check pure impact of infrastructure development, the author used the Pooled OLS model with major dependent variables which are main interests of this paper. Table 2 shows the summary statistics and correlation matrix of variables.
<Descriptive Statistics, Correlation Matrix >
Table 2: Descriptive Statistics(log form)
GDPpc Energy Telecom Transport Water Panel A: Summary Statistic
Mean 7.224669 2.125582 2.359131 2.629689 4.138572
median 7.201912 2.397895 2.302585 2.564949 4.276666
Standard error 1.140064 1.168219 1.575154 1.074957 0.3913695
maximum 9.65143 4.189655 6.200509 4.543295 4.60517
minimum 4.61512 0 0 0 2.639057
Panel B: Correlation Matrix
GDPpc 1.0000
Energy 0.6866* 1.0000
Telecom 0.4518* 0.3964* 1.0000
Transport 0.4518* 0.5848* 0.4688* 1.0000
Water 0.7212* 0.8258* 0.3335* 0.3445* 1.0000 Note: * indicates significance at the 5% level.
<Infrastructure and Growth Regression Model >
The model to examine the impact of four infrastructure investment and economic growth is as the below equation.
Table 3: Regression Result of Infrastructure sectors and Economic Growth Model
Dependent variables: Log GDP per capita t+1 Sample of 113 Developing countries, 2005~2015.
VARIABLES Pooled OLS Expected Sign of Coefficient
Log (Energy) 0.422*** (+) (0.0613) Log (Telecom) 0.113*** (+) (0.0215) Log (Transport) -0.0277 (+) (0.0398) Log (Water) 0.462** (+) (0.204) Constant 4.434*** (0.805) Observations 623 R-squared 0.424
Standard errors in parentheses *** p<0.01, ** p<0.05, * p<0.1
Table 4 reports the Pooled OLS estimation result for the four main infrastructure variables. The pooled model captured the impact of each infrastructure on economic development.
Based on the analysis, this study found that economic development was positively related to the Energy, Telecom and Water variables at the 1%, 5% level. However, the Transport sector was not statistically related with economic development. Quantitatively, the Water sector had the highest coefficient among the four infrastructure variables. 1% increase in Telecom sector was likely to increase 0.462% economic growth. Energy and Telecom sectors were also highly correlated with economic development with the coefficients at 0.422 and 0.113 respectively.
< Multicollinearity Test-Variance Inflation Factor>
When multi-predictors in the model are correlated, multicollinearity occurs and provides redundant information about the response. To measure multicollinearity, the author examined the correlation structure of the predictor variables through variance inflation factors (“VIFs”). The VIFs measure how much the variance of an estimated regression coefficient increases if predictors were correlated multicollinearity. Higher VIFs are problematic because they can increase the variance of the regression coefficients, making them unstable and difficult to interpret. The results of the multicollinearity test are as below:
Table 4: Result of Variance Inflation Factors (VIFs)
Variable VIF 1/VIF
Log (Energy) 4.84 0.206676
Log (Telecom) 3.63 0.275219
Log (Transport) 2.02 0.495801
Log (Water) 1.35 0.741967
Mean VIF 2.96
As a rule of thumb, predictors are not correlated when VIF is equal to 0 whereas repressors are highly correlated when VIF is larger than 5. When VIF is between 1 and 5, then predictors are considered as moderately correlated. Since all the VIFs are between one and two, the multicollinearity issue is not the problematic in this regression model.
<Infrastructure and Growth Regression Expansion Model >
To expand the regression model, the author regressed with several control variables such as Trade, Real Interest rate, Inflation rate, Second education and Urban Population.
Negative Trade can be interpreted that the source of raw materials for infrastructures from foreign countries. Real Interest Rate can be regarded as opportunity costs of infrastructure project during design and development stages. In other words, an infrastructure project with lower interest rate would have high possibility of project bankability. Low Inflation Rate helps stable business structuring in both planning and financing stages. Moreover, low inflation is linked with foreign exchange rate which affects the price of imported construction materials and the revenue structure. Population with high Secondary Education enables developing countries to construct and maintain infrastructure projects. During the implementation of the infrastructure projects, it is required to use local labors. As a result, secondary educated people could be well capitalized when infrastructure project is implemented and maintained. Moreover, Influx of Urban Population has stimulated economic development.
The expansion model to measure the impact of infrastructure investment on economic growth has the following equation.
Table 5: Regression Result of Infrastructure and Growth Expansion-Model Dependent variables: Log GDP per capita t+1
VARIABLES Pooled OLS Expected Sign of Coefficient
Log (Energy) 0.0523 (+) (0.232) Log (Telecom) 0.454*** (+) (0.111) Log (Transport) 0.291** (+) (0.132) Log (Water) -1.906** (+) (0.930) 13
Real Interest Rate 0.000110 (-)
(0.00666) Trade -0.000830 (-) (0.00325) Inflation Rate -0.00106 (-) (0.00532) Second Education 0.0281* (+) (0.0140)
Urban Populatoin 4.50e-08*** (+)
(7.68e-09)
Constant 11.18***
(3.443)
Observations 62
R-squared 0.818
Standard errors in parentheses, *** p<0.01, ** p<0.05, * p<0.1
The study found that economic development was positively related to the Telecom sector at the 1% level and Transport and Water sectors at the 5% level but the Energy sector is not statistically related with economic development. Quantitatively, Telecom sector had the highest coefficient among the four different infrastructure sectors. 1% increase in Telecom is likely to increase 0.454% economic growth and Transport is also correlated with 0.291% economic growth. However, Water was negatively correlated with economic development. 1% increase in Water sector was likely to increase -1.906%.
In addition, this study showed the relationship between control variables and economic development. Firstly, Secondary Education is related to Economic development at the 10%. Urbanization and is positively related to Economic development at the 1% as expected. On the other hand, Real Interest Rate, Trade, Inflation rate were not statistically related with economic development.
3.3.1. White`s General test for Heteroskedasticity
If the error terms do not have constant variance, the regression model violated Gauss-Markov theorem due to heteroskedastic errors. Pooled OLS with heteroskedasticity is not optimal because it gives equal weight to all observations. When observations with larger
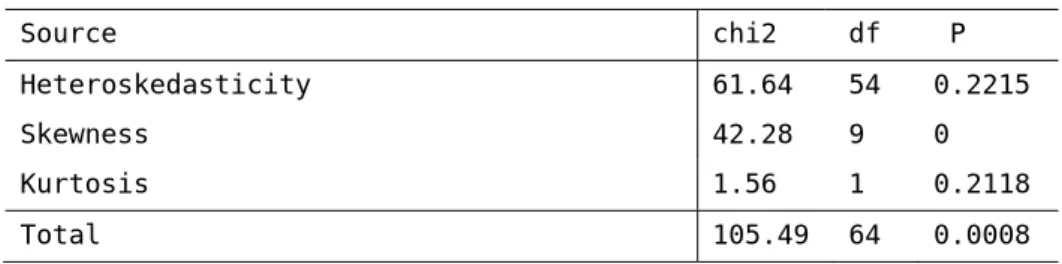
disturbance variance contain less information than observations with smaller disturbance variance, heteroskedasticity is present. In this paper, the author conducted White`s General test, and its result showed that P-value is 0.2215, then it can be proved that “Fail to reject null hypothesis which means that there is homoscedasticity”. The variance of the error term of this regression is constant.
Table 6: White test result for Heteroskedasticity.
White's test for Ho: homoskedasticity
against Ha: unrestricted heteroskedasticity
chi2(54) = 61.64 Prob > chi2 = 0.2215
Cameron & Trivedi's decomposition of IM-test
Source chi2 df P
Heteroskedasticity 61.64 54 0.2215
Skewness 42.28 9 0
Kurtosis 1.56 1 0.2118
Total 105.49 64 0.0008
Pooled OLS model is the most restrictive panel data model. Thus, this study also uses individual-specific effects model to find out which model is most appropriate
3.3.2 Breusch-Pagan Lagrangian Multiplier test for Random Effects
The author recognized that cross-country analyses caused numerous methodological concerns. One of which is unobservable heterogeneity of countries. Given that different countries have some unique characteristics, economic situation or otherwise, one cannot be sure if all the respective influence of these variables can be taken into account in our model if they can be observed. Although the countries under investigation are fairly similar to their income levels and economic structures, the issue of heterogeneity is one that still needs to be
examined to comply with fundamental assumptions of Gauss Markov. For this reason, the author conducted the Breusch-Pagan Lagrangian multiplier test for Random-Effects in order to determine more reliable estimator between Pooled OLS and Random-Effect model. In this section, the author conducted the test for the four sector of infrastructure regression and the results of the test are shown in tables 7.
Table 7: Breusch-Pagan Lagrangian Multiplier test result
Breusch and Pagan Lagrangian multiplier test for random effects lngdppc1[panelid,t] = Xb + u[panelid] + e[panelid,t] Estimated results: Var sd = sqrt(Var) lngdppc1 1.050132 1.02476 e 0.0388339 0.1970631 u 0.1781836 0.422118 Test: Var(u) = 0 chibar2(01) = 2.61 Prob > chibar2 = 0.0530
P-value is 0.0530, then it can be proved that “reject null hypothesis (Pooled OLS), and conclude that Random-Effects is appropriate model at 10% level.
3.3.3. Hausman Test for Random and Fixed Effects
The panel data models can be estimated with several estimators. The estimators differ based on whether they consider the between or within variation in the data. In this study, the author assumed that there is unobserved heterogeneity across country. For example, unobserved characteristics of a country that affects economic growth such as natural endowment, technology level, and political situation. The key question is which estimator is appropriate in this panel data. Theoretically, if the country specific effects correlated with dependent variables, the Fixed-Effect model is preferred to Random-Effect model. In this study, the author attempts to measure the impact of infrastructure investment and economic growth by using Hausman test.
Hausman test was used to differentiate from OLS by using Fixed-Effects model and Random-Effects model in panel data. When using Fixed-Effects, the author assumed that something within the country may impact or bias economic growth. This is the rationale behind the assumption of the correlation between entity’s error term and predictor variables. Fixed-Effects remove the effect of those time-invariant characteristics so the author can assess the net effect of the infrastructure on the economic growth. In this paper, the author defined Fixed-Effects as Country Effect.
Random-Effects model is that the variation across countries is assumed to be random and uncorrelated with the predictor or independent variables. Random-Effects assume that the entity’s error term is not correlated with the predictors which allows for time-invariant variables to play a role as explanatory variables.
Having decided to conduct a panel estimation the author face another decision of whether to estimate the model with Random-Effects or Fixed-Effects. The general approach to deciding a more appropriate model between a Random-Effects model and a Fixed-Effects model is to conduct the Hausman Test. The author conducted the Hausman test for the Infrastructure model. The result is shown in table 8 below.
Table 8: Hausman Test result for Random and Fixed Effects
hausman fixed_effects random_effects,sigmamore ---- Coefficients ----
(b) (B) (b-B) sqrt(diag(V_b-V_B))
fixed_effects random_effects Difference S.E.
lnenergy 0.1462589 0.3623102 -0.2160514 0.3586545 lntelecom 1.039466 0.7534694 0.2859966 0.0952603 lntransport -0.7990521 0.1616938 -0.9607459 0.4402261 lnwater -4.720758 -1.290047 -3.43071 2.66226 int_rate 0.0006542 0.0028014 -0.0021472 0.001928 trade 0.0049271 0.0042994 0.0006278 0.0016398 inflation -0.0023722 -0.002755 0.0003828 0.0014274 17
sec_edu -0.0338356 -0.0052412 -0.0285943 0.0113958
urban 7.25E-08 5.73E-08 1.52E-08 3.76E-08
b = consistent under Ho and Ha; obtained from xtreg B = inconsistent under Ha, efficient under Ho; obtained from xtreg Test: Ho: difference in coefficients not systematic
chi2(8) = (b-B)'[(V_b-V_B)^(-1)](b-B) = 26.08
Prob>chi2 = 0.0010
The test generates Chi-square test statistic 26.08 at and p-value at 0.0010. Therefore, the author reject the null hypothesis and proceeded to estimate Fixed-Effects model for the infrastructure-growth regression.
Table 9: Regression Result of Housman test between Fixed and Random Dependent variables: Log GDP per capita t+1
Pooled OLS Fixed-Effects Random Effects
VARIABLES [1] [2] [3] Log (Energy) 0.0523 0.146 0.362 (0.232) (0.379) (0.337) Log (Telecom) 0.454*** 1.039*** 0.753*** (0.111) (0.113) (0.112) Log (Transport) 0.291** -0.799** 0.162 (0.132) (0.374) (0.204) Log (Water) -1.906** -4.721** -1.290 (0.930) (2.215) (1.085)
Real Interest Rate 0.000110 0.000654 0.00280
(0.00666) (0.00355) (0.00419) Trade -0.000830 0.00493* 0.00430 (0.00325) (0.00256) (0.00289) Inflation Rate -0.00106 -0.00237 -0.00275 (0.00532) (0.00302) (0.00365) Second Education 0.0281* -0.0338** -0.00524 (0.0140) (0.0141) (0.0144)
Urban Population 4.50e-08*** 7.25e-08** 5.73e-08*** (7.68e-09) (3.06e-08) (1.28e-08)
Constant 11.18*** 28.96*** 9.254**
(3.443) (9.570) (4.109)
Observations 62 62 62
R-squared 0.818 0.893
Number of panelid 13 13
Standard errors in parentheses, *** p<0.01, ** p<0.05, * p<0.1
According to the overall results of Breusch-Pagan Lagrangian Multiplier test and Hausman Test for Random and Fixed-Effects, the author concluded that Fixed-Effects model is the most appropriate model in this study.
3.4. Infrastructure, Private Participation and Growth Regression
In order to find out the impact of the private participation in infrastructure development, this model includes additional new control variables such as the private participation in four major infrastructure variables. The regression equation is as follow;
Table 10: Regression Result of Private participation in Infrastructure and Economic Growth Dependent variables: Log GDP per capita t+3
VARIABLES Fixed-Effects Expected Sign of Coefficient
Log (Energy) 0.0114 (+) (0.507) Log (Telecom) 0.907*** (+) (0.165) Log (Transport) -1.447*** (+) (0.492) Log (Water) -5.400* (+) (2.858)
Private Energy t+2 -3.61e-05 (+)
(0.000285) Private Telecom t+2 -0.00129** (+) (0.000632) Private Transport t+2 0.000753 (+) (0.00134) Private Water t+2 -0.000184 (+) (0.000697)
Real Interest Rate -0.00250 (-)
(0.00467) Trade 0.00916** (-) (0.00352) Inflation Rate -0.00305 (-) (0.00419) Second Education -0.0230 (+) (0.0194)
Urban Population 6.83e-08* (+)
(4.02e-08) Constant 33.54** (12.29) Observations 59 Number of panelid 13 R-squared 0.828
Standard errors in parentheses *** p<0.01, ** p<0.05, * p<0.1
The study found that economic development is positively related to the Telecom variables at the 1% level, but the Transport and Water variable is negatively related with economic development at the 1%, 10% level. Quantitatively, the Telecom has the highest coefficient among four different infrastructure variables. 1% increase in Telecom infrastructure is likely to increase 0.907% economic growth. However, Energy sector is not statistically related with economic development.
In addition, this study reviews the relationship between private participation and its own infrastructure. Interestingly. The telecom variable itself is positively correlated with economic development. However, it private participation variable, the impact of the telecom on economic development becomes negative.
3.5. Infrastructure, Institutions and Growth Regression
In order to find out the impact of Institutions and policy, this model includes additional new control variables, “CPIA”. The regression equation is as follows;
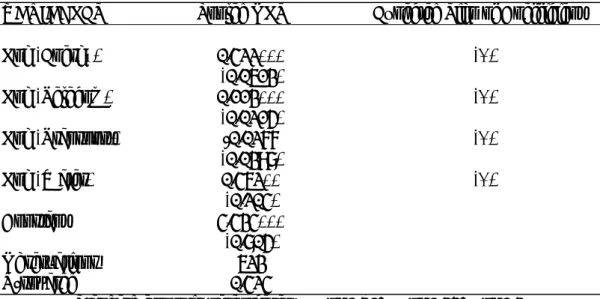
Table 11: Regression Result of Institution, Infrastructure and Economic Growth Dependent variables: Growth in GDP per capita t+3
VARIABLES Pooled OLS Expected Sign of Coefficient
Log (Energy) 0.454 (+) (0.416) Log (Telecom) 0.561** (+) (0.163) Log (Transport) 0.512* (+) (0.241) Log (Water) -1.728 (+) (1.459) CPIA t-2 -0.519 (+) (0.562)
Real Interest Rate 8.27e-05 (-)
(0.00628) Trade -0.00296 (-) (0.00718) Inflation Rate -0.0182 (-) (0.0116) Second Education -0.0206 (+) (0.0154)
Urban Population 4.12e-08*** (+)
(9.94e-09)
Constant 13.74*
(7.036)
Observations 17
R-squared 0.978
Standard errors in parentheses, *** p<0.01, ** p<0.05, * p<0.1
Insufficient observations disabled Fixed Effect model with Institution. Therefore, Impact of institution analysis is followed Pooled OLS model. The study found that CPIA is negatively correlated and not statistically significant to economic growth.
The Telecom and Transport variable are related to economic development and the rest of major indicators are not directly related to Institution. Judging from the statistical result, the author found that there are no distinctive relationship between Institution and economic growth in the light of Telecom and Transport sector.
3.6. Infrastructure, Business Environment and Growth Regression
The model allows for the examination of the impact of infrastructure investment and economic growth with Doing Business Index as Equation below.
Table 12: Regression Result of Infrastructure, Business Environment and Economic Growth Dependent variables: Growth in GDP per capita t+3
VARIABLES Fixed-Effects Expected Sign of Coefficient
Log (Energy) -0.0589 (+) (0.505) Log (Telecom) 0.986*** (+) (0.229) Log (Transport) -1.039** (+) (0.497) Log (Water) -19.55** (+) (7.332) DBI t-1 0.0208* (+) (0.0108)
Real Interest Rate -0.00368 (-)
(0.00452) Trade 0.00314 (-) (0.00447) Inflation Rate 0.000927 (-) (0.00448) Second Education 0.000297 (+) (0.0227) Urbanization 1.28e-07** (+) (4.98e-08) Constant 78.25** (28.29) Observations 49 Number of panelid 0.792 R-squared 12
Standard errors in parentheses, *** p<0.01, ** p<0.05, * p<0.1
First of all, better business environment is associated with higher level of economic growth. The author discovered the definitive evidence of the relationship among doing business index
and economic growth.
The study found that economic development is positively related to the Telecom, Transport and Water variables at the 1%, 5% level of significance respectively. However, the Energy variable was not statistically significant to economic growth. Quantitatively, the Telecom has the highest coefficient among four different infrastructure variables. 1% increase in Telecom infrastructure was likely to lead additional 0.986% economic growth. Transport and Water were also highly but negatively correlated with economic development; -1.039% and -19.55% respectively.
DBI was expected to be positively related to economic growth. Since the lower cost and time for business preparation contributed the greater performance of infrastructure development and economic growth. DBI itself was positively related to economic growth at the 10% level of significance.
4. CONCLUSIONS AND POLICY IMPLICATIONS
The implication of this research is that infrastructure has significant impact on economic growth in the developing countries when it is under favorable institution and business environment. The assessment is based on the estimation of infrastructure and economic growth regressions using data for a sample of 113 countries over the 2005-2015 periods, and employing a variety of variable techniques to account for the potential effect of infrastructure on economic growth and its qualitative determinants.
The author investigated several questions regarding the interaction among various infrastructures, policies, business environment and economic growth.
The primary question is concerned with the effect of infrastructure development on growth. There was a definitive tendency for commitment of infrastructure for Economic growth. Although the results were various along with a certain circumstance situation, Telecom and
Transport sector had more significant than Water and Energy sector in most of the models. Private participation in Infrastructure development is definitively influential in economic growth. Especially, Telecom sector had a distinctive tendency for commitment of infrastructure for Economic growth with private participation. Institution itself was not statistically related with economic development. However, the impact of Telecom and Transport infrastructures could be explained with an institution variable better than without model. Business environment was statistically related with economic development at 10%. The impact of Telecom sector was mostly affected by Business environment. In other words, Telecom sector had influenced by private participation, institution and business environment than other sectors. The author inferred that institutional support by public sector are essential to Telecom development which eventually contribute economic growth.
Considering overall models, the author interprets that Institutions makes better Business environment, that induces investment in infrastructure with private participation and those variables contribute economic development after all. To enhance the economic growth, the public sector should ensure the flexible business environment for attracting foreign developer and stable financial market to invest infrastructure.
Macroeconomic variables such as Real interest rate, Inflation rate had distinctive relationship with infrastructure development and economic growth, and those variables are the essential conditions for bankability of infrastructure projects.
Data set of spanning 11 years have an inherent limitation to look into nature of the relationship of variables exhaustively. Therefore, further research is required through larger data set within an individual developing country in consideration of initial-stage infrastructure development, venture capital investment, local government support and export credit agency`s loan and guaranty service.
BIBLIOGRAPHY
BOOPEN, Seetanah. Transport infrastructure and economic growth: evidence from Africa using dynamic panel estimates. The empirical economics letters, 2006, 5.1: 37-52.
BURNSIDE, Craig; DOLLAR, David. Aid Policies and Growth [Policy Research Working Paper No. 1777]. Washington, DC: World Bank, 1997.
CALDERÓN, César; EASTERLY, William; SERVÉN, Luis. Infrastructure compression and public sector solvency in Latin America. The Limits of Stabilization: Infrastructure, Public Deficits, and Growth in Latin America. Stanford University Press and the World Bank, 2003, 119-38.
CALDERON, Cesar; SERVEN, Luis. The effects of infrastructure development on growth and income distribution. World Bank Publications, 2004.
CALDERÓN, César; SERVÉN, Luis. Infrastructure and economic development in Sub-Saharan Africa. 2008.
CALDERÓN, César; SERVÉN, Luis. Infrastructure in Latin America. 2010.
CANNING, David; PEDRONI, Peter. Infrastructure and long run economic growth. Center for Analytical Economics working paper, 1999, 99.09.
CHRISTIANSEN, Hans. The OECD principles for private sector participation in
infrastructure. In: Public Investment and Public-Private Partnerships. Palgrave Macmillan
UK, 2008. p. 143-161.
DELLA CROCE, Raffaele; YERMO, Juan. Institutional investors and infrastructure financing. OECD Working Papers on Finance, Insurance and Private Pensions, 2013, 36: 1.
DEVARAJAN, Shantayanan; SWAROOP, Vinaya; ZOU, Heng-fu. The composition of public expenditure and economic growth. Journal of monetary economics, 1996, 37.2:
313-344.
EASTERLY, William; REBELO, Sergio. Fiscal policy and economic growth. Journal of monetary economics, 1993, 32.3: 417-458.
EASTERLY, William. The lost decades: developing countries' stagnation in spite of policy reform 1980–1998. Journal of Economic Growth, 2001, 6.2: 135-157.
ESFAHANI, Hadi Salehi; RAMIREZ, Maria Teresa. Institutions, infrastructure, and economic growth. Journal of development Economics, 2003, 70.2: 443-477.
FERNALD, John G. Roads to prosperity? Assessing the link between public capital and productivity. American Economic Review, 1999, 619-638.
HARRIS, Clive. Private participation in infrastructure in developing countries: trends, impacts, and policy lessons. World Bank Publications, 2003.
HUNT, Lester C.; LYNK, Edward L. Privatisation and efficiency in the UK water industry: an empirical analysis. Oxford Bulletin of Economics and Statistics, 1995, 57.3: 371-388.
Kim, Junghan, 해외투자개발사업의핵심타당성조사요인도출에관한연구(A Study of Key Feasibility Study Factors for Overseas Investment Development Projects).”
Graduate school of Gachon University, 2014.
KELLERMANN, Martin; KELLER, Daniel Paul. Leveraging the Impact of Business Environment Reform: The Contribution of Quality Infrastructure. Working Paper, Donor Committee for Enterprise Development, 2014.
KESSIDES, Christine. The contributions of infrastructure to economic development: a review of experience and policy implications. World Bank Publications, 1993.
LOAYZA, Norman; FAJNZYLBER, Pablo; CALDERÓN, César. Economic Growth in Latin America and the Caribbean: Stylized Facts, Explanations, and Forecasts.
Washington, DC: The World Bank. Mimeo, 2003.
MENGISTU, Tewodaj; SCHOOL, Pardee RAND Graduate. Determinants of private participation in infrastructure in low and middle income countries (LMICs). Pardee RAND Graduate School, 2013.
MISHKIN, Frederic S. Is the Fisher effect for real?: A reexamination of the relationship
between inflation and interest rates. Journal of Monetary economics, 1992, 30.2: 195-215.
MIYAMOTO, Kaori; BIOUSSE, Kim. Official support for private sector participation in developing country infrastructure. 2014.
MODY, Ashoka, et al. (ed.). Infrastructure strategies in East Asia: the untold story. World Bank Publications, 1997.
MOSZORO, Marian W., et al. Institutional and Political Determinants of Private Participation in Infrastructure. 2015.
OKOH, A. S.; EBI, B. O. Infrastructure investment, institutional quality, and economic growth in Nigeria: An interactive approach. European Journal of Humanities and Social Sciences, 2013, 26.1: 1343-1358.
POLLARD, Stephen K.; PIFFAUT, Pedro V.; SHACKMAN, Josh D. Business Infrastructure and the Ease of Doing Business.
RÖLLER, Lars-Hendrik; WAVERMAN, Leonard. Telecommunications infrastructure and economic development: A simultaneous approach. American economic review, 2001,
909-923.
SANCHEZ‐ROBLES, Blanca. Infrastructure investment and growth: Some empirical evidence. Contemporary economic policy, 1998, 16.1: 98-108.